
Abstract
Introduction
Hepatocellular carcinoma (HCC) is the most common form of primary liver cancer. It is the fourth leading cause of cancer-related death worldwide. Deregulation of the ATF/CREB family is associated with the progression of metabolic homeostasis and cancer. Because the liver plays a central role in metabolic homeostasis, it is critical to assess the predictive value of the ATF/CREB family in the diagnosis and prognosis of HCC.
Methods
Using data from The Cancer Genome Atlas (TCGA), this research evaluated the expression, copy number variations, and frequency of somatic mutations of 21 genes in the ATF/CREB family in HCC. A prognostic model based on the ATF/CREB gene family was developed via Lasso and Cox regression analyses, with the TCGA cohort serving as the training dataset and the International Cancer Genome Consortium (ICGC) cohort serving as the validation set. Kaplan-Meier and receiver operating characteristic analyses verified the accuracy of the prognostic model. Furthermore, the association among the prognostic model, immune checkpoints, and immune cells was examined.
Results
High-risk patients exhibited an unfavorable outcome as opposed to those in the low-risk category. Multivariate Cox analysis revealed that the risk score calculated based on the prognostic model was an independent prognostic factor for HCC. Analysis of immune mechanisms revealed that the risk score had a positive link to the expression of immune checkpoints, particularly CD274, PDCD1, LAG3, and CTLA4. Differences in immune cells and immune-associated roles were found between the high- and low-risk patients, as determined by single-sample gene set enrichment analysis. The core genes ATF1, CREB1, and CREB3 in the prognostic model were shown to be upregulated in HCC tissues as opposed to adjoining normal tissues, and the 10-year overall survival (OS) rate was worse among patients with elevated expression levels of ATF1, CREB1, and CREB3. Elevated expression levels of ATF1, CREB1, and CREB3 in HCC tissues were confirmed by qRT-PCR and immunohistochemistry studies.
Conclusion
According to the results of our training set and test set, the risk model based on the six ATF/CREB gene signatures predicting prognosis has certain predictive accuracy in predicting the survival of HCC patients. This study provides novel insights into the individualized treatment of patients with HCC.
Introduction
Initially identified by their capacity for binding to the consensus ATF/CRE domain “TGACGTCA”, the ATF/CREB family of transcriptional regulators is a large class of basic region-leucine zipper (bZip) proteins.Citation1 The ATF/CREB transcription factor family currently has 21 members, namely, ATF1, ATF2, ATF3, ATF4, ATF5, ATF6, ATF7, BATF, BATF2, BATF3, CREB1, CREB3, CREB5, CREM, CREB3L1, CREB3L2, CREB3L3, CPEB4, CPEB4, JDP2, ATF6B, and CREBZF.Citation2 The advancement of type 2 diabetes mellitus (T2DM) is linked to the deregulation of ATF/CREB family signaling.Citation2 The liver maintains systemic glucose homeostasis and regulates hormones, which include glucocorticoids, glucagon, and insulin.Citation3,Citation4 The ATF/CREB network of transcriptional regulators is necessary for the process of gluconeogenesis as well as the maintenance of systemic glucose homeostasis.Citation5–7 ATF3, for instance, plays a role in mediating the inhibition impacts of ethanol on hepatic glucose production;Citation8 CRTC2, a CREB1 coactivator, promotes hepatic gluconeogenesis;Citation9 and CREBH is responsible for the circadian regulation of glucose homeostasis through its regulation of hepatic gluconeogenesis and glycogenolysis.Citation10 The ATF/CREB family members are closely associated with HCC.Citation11,Citation12 For example, ATF3 can inhibit the tumorigenesis and progression of HCC through upregulation of CYR61 expression,Citation13 and high ATF5 expression could function as a favorable prognostic indicator in HCC after hepatectomy.Citation14
HCC is the most common form of primary liver cancer.Citation15 It is the fourth leading cause of cancer-related death worldwide, with approximately 830,000 liver cancer-related deaths reported annually.Citation16,Citation17 Surgical resection and liver transplantation are the optimal strategies for the treatment of HCC.Citation18 However, detecting liver cancer at an early stage is challenging, which hinders prompt and effective treatment.Citation19 The emergence of targeted therapies and immunotherapeutic agents in recent years has provided new avenues for the treatment of HCC.Citation20,Citation21 Therefore, it is important to discover and validate predictive biomarkers for the diagnosis, prognosis, and treatment of HCC.
This research assessed the expression of 21 ATF/CREB family genes in healthy liver and HCC tissues. We also examined how these genes’ expression levels correlated with the survival outcomes of patients suffering from HCC. We developed a predictive nomogram, designed a risk score model premised on the ATF/CREB gene family, and evaluated the model’s association with immune checkpoints and immune cells. The findings supported the use of a new predictive model for HCC based on the ATF/CREB gene family.
Materials and Methods
HCC Dataset Source and Preprocessing
The flowchart of the study design is depicted in Supplementary Figure 1. The TCGA and the ICGC databases were screened for data on patients with HCC comprising prognosis and total mortality, along with expression data of common genes. By integrating the multi-array averaging methods of Affy and simpleaffy, we adjusted the background and performed quantile normalization. TCGAbiolink, an R program, was utilized to perform a comprehensive analysis of RNA sequencing (FPKM values) and cytogenetic mutation data obtained from the TCGA Genome Data Commons (GDC, https://portal.gdc.cancer.gov/).Citation22 The values of FPKM were translated to the transcripts per kilobase million (TPM). To correct the non-biological technical bias batch effect, the “ComBat” algorithm from the sva package was utilized. Analyses of all data were done in R (version 4.1.2) with the aid of the R Bioconductor package.
Analysis of Copy Number Variations (CNVs) and Mutations in ATF/CREB Family Genes
The TCGA database was searched for information on the expression levels of 21 members of the ATF/CREB genes. The chromosomal distribution of the ATF/CREB family genes was collected utilizing the RCircos tool, and CNV analysis was conducted using the Perl software (5.32.1.1) and R (4.1.2). Waterfall mapping of the mutations was done with the maftools program. Subsequent evaluation using Student’s t-test was performed to determine the impact of single mutations on the overall level of gene expression. The direction and size of associations between the expression of genes and mutations were shown using the ggplot2 program.
Construction of Risk Scoring Model
By using the expression profiles and survival data of ATF/CREB genes, the full TCGA set was employed as the training dataset and the full ICGC set as the test dataset. The ATF/CREB family genes model was developed using the training dataset and validated using the full and test datasets. The Lasso and Cox regression (“glmnet” and “survival” packages) were employed to examine the link between pyroptosis-related genes and overall survival rate. The Lasso model was developed using cross-validation to ensure reliability. By applying the penalty parameter (λ), we identified six genes that were associated with survival and used them to construct a multivariate Cox regression model. Using a forward-backward Cox regression technique, the optimal set of genes was chosen and used to predict survival. Kaplan-Meier (KM) analysis was conducted to generate survival curves for both the training and testing sets. The risk score was computed using the following equation.
Development and Validation of a Nomogram for HCC Patients
Prognostic variables were derived from univariate and multivariate analyses, and a nomogram model was developed to anticipate 1-, 3-, and 5- year OS for HCC patients. Nomogram analysis was conducted with the “RMS” tool in R. Calibration curves were employed to visually compare the nomogram’s predicted probability (using the KM analysis) with the actual values using the KM analysis. Nomogram prediction models that have been calibrated correctly will have their scatter points cluster along a 45-degree diagonal line. Harrell concordance index (C-index) was also utilized to examine the nomogram model’s overall prediction ability. Prediction accuracy was measured by the C-index, ranging between 0.5–1, with a higher C-index indicating superior predictive efficacy. Two-tailed tests were performed on all data in this study, and a value of 0.05 indicated a significance level for all comparisons.
Gene Set Enrichment Analysis (GSEA)
Functional preset gene datasets were derived from the Molecular Signatures Database (MsigDB, https://www.gsea-msigdb.org/gsea/msigdb). To determine whether a candidate gene for a pathway was significantly enriched, p < 0.05 and a false discovery rate (FDR) of 0.25 were applied as the screening criteria. The signaling pathways with substantial enrichment were chosen using a combination of the adjusted p-value and normalized enrichment score.
Evaluation of the Immunological Characteristics of the Tumor Microenvironment in HCC
The “preprocessCore” program and CIBERSORT technique were adopted to assess the infiltration status of 22 distinct immune cells to investigate the link between risk score and immune cell infiltration.Citation23 Furthermore, the TCGA database was employed to probe the link between the risk score and 22 immune checkpoint molecules. A p-value of < 0.05 denoted the significance threshold.
Evaluation of Drug Sensitivity
The relevant gene expression and drug sensitivity data were downloaded from the CellMiner database (https://discover.nci.nih.gov/cellminer/home.do). After that, the data on drug sensitivity were screened using a combination of clinical laboratory validation and Food and Drug Administration standards certification. Subsequently, we merged the data on the expression of the six core prognostic genes with the data on drug sensitivity, implemented the Pearson correlation test, and determined the correlations between them.
Collecting Clinical Specimens
Between January and December 2018, tissue samples were obtained from patients diagnosed with HCC who received surgical treatment at the Department of Oncology Surgical at the First Affiliated Hospital of Bengbu Medical College. For qRT-PCR, 10 HCC and adjoining normal tissue were employed, while for immunohistochemistry (IHC) analysis, 60 HCC and 10 adjoining normal tissue were used. Patients did not receive chemotherapy, radiotherapy, or biological treatment pre- or post-operatively, nor had they been diagnosed with HCC before. The postoperative sample tissues were frozen at −80 ° C for the extraction of proteins.
Experimental Materials
Rabbit anti-human ATF1, CREB1, and CREB3 antibodies were purchased from CUSABIO (CSB-MA080223, CSB-PA005948ESR1HU, and CSB-PA002269DSR1HU) (50 μL; Wuhan, China). Jackson ImmunoResearch Inc. (West Grove, PA, USA) supplied a rabbit anti-mouse antibody coupled with horseradish peroxidase (HRP). Albumin from bovine serum was acquired from Sigma-Aldrich (St. Louis, MO, USA). Sangon Biotech Co., Ltd. (Shanghai, China) supplied the skim milk and Tween-20 used in this experiment. Thermo Fisher Scientific (USA) provided the TRIzol reagent. We used reagents from two Japanese companies, TaKaRa (Tokyo, Japan) for the PrimeScriptTM First Strand cDNA Synthesis Kit and TOYOBO (Osaka, Japan) for the SYBR Green Real-Time PCR Master Mix.
Immunohistochemistry (IHC) Analysis
Paraformaldehyde (4%) was used to fix the tissue samples, which were then embedded in paraffin, cut into slices (4 μm), and adhered to slides. Various xylene density gradients were used to deparaffinize the samples before rehydration. After incubating the sample at 82 ° C for 24 minutes, antigens were extracted in a citric acid buffer (pH 7.8, 0.1 M). After that, the slides were evenly covered with an endogenous peroxidase-blocking buffer for 15 minutes at room temperature (RT) to block peroxidase activity. Following that, the slides were subjected to incubation for an entire night with the presence of an anti-ATF1, anti-CREB1, and anti-CREB3 antibody mixture. The slides were subjected to gentle washing with PBS the next day, after which they were treated with a biotin-conjugated secondary antibody for ten minutes at RT, followed by treatment with streptavidin peroxidase for 5 minutes. Afterward, the samples were hematoxylin-stained, washed to eliminate any residual debris, and then dried in the air in preparation for the IHC examination.
Quantitative Reverse Transcription Polymerase Chain Reaction (qRT-PCR)
With the use of the TRIzol reagent, total RNA was isolated. The RNA that was obtained was then subjected to reverse transcription with the aid of the RevertAid First Strand cDNA Synthesis Kit, and the cDNA that was synthesized was then extracted using the SYBR Green Realtime PCR Master Mix. The following primers were utilized for qRT-PCR: human ATF1 forward, 5’-TTCTGGAGTTTCTGCTGCTGT-3’; ATF1 reverse, 5’-ACACCCCCATTTATTAAAA-3’; CREB1 forward, 5’-TGCAACATCATCTGCTCCCA-3’; CREB1 reverse, 5’-CTGAATAACTGATGGCTGGGC-3’; CREB3 forward, 5’-CCTGCATCTTGGTCCTACTAGTCTC-3’; CREB3 reverse, 5’-GACAACACTCCATGCTCAGCTG-3’; GAPDH forward, 5’-AAGGTGTTCTECTCGGTGAC-3’; GAPDH reverse, 5’-GAGGGTAGAGGACTGAATAGTACCTG-3’. The internal control for the study was GAPDH. There were three rounds of testing for every single sample from every group. To examine the results of the qRT-PCR experiment, a paired Student’s t-test was carried out.
Statistical Analysis
In this study, GSEA (v 4.2.3), Perl (v 5.32.1.1), and R software (v 4.1.2) were employed to analyze the data. Throughout the investigation, all statistical methodologies and appropriate R software packages were described. The cut-off criterion was established at p<0.05.
Results
Expression of ATF/CREB Family Genes and Their Role in the Hepatic Gluconeogenesis Pathway
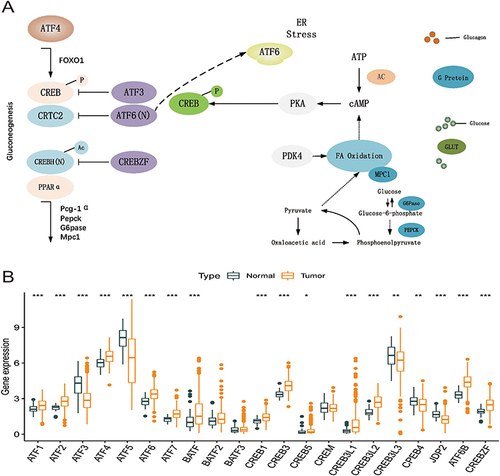
The expression data of 21 genes in the ATF/CREB family were derived from the TCGA-HCC cohort. depicts the involvement of ATF/CREB family genes in the hepatic gluconeogenic pathway. We compared the mRNA expression of these 21 genes between HCC and adjoining normal samples to ascertain if aberrant expression profiles were related to malignancy. Eighteen ATF/CREB genes showed substantial differences (variations) in expression between HCC and normal samples (). These findings support the hypothesis that ATF/CREB gene mRNA expression is remarkably heterogeneous in HCC and that abnormalities in gene expression contribute to the onset and progression of HCC.
Figure 1 Expression of ATF/CREB family genes and their role in the hepatic gluconeogenic pathway. (A) Role of ATF/CREB family genes in the pathways involved in hepatic gluconeogenesis. (B) Expression of 21 ATF/CREB family genes in normal liver tissue (darkslategray) and tumor tissue (darkorange). Box plots indicate the interquartile range of values. The rows in the boxes indicate median values and the asterisks above indicate p-values (*p < 0.05, **p < 0.01, ***p < 0.001).
Patterns of Genetic Variants Within the ATF/CREB Gene Family in HCC
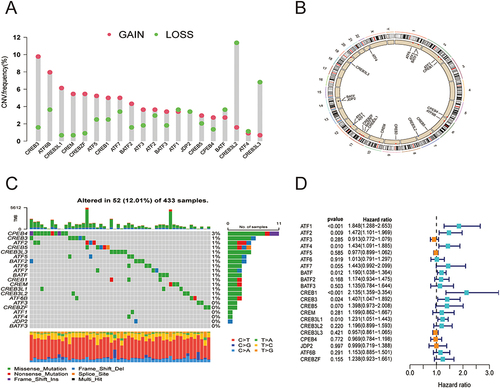
The 21 ATF/CREB genes showed a greater frequency of CNVs, copy number amplification in particular, whereas CREB3L2, CREB3L3, and BATF showed a high copy number deletion frequency (). depicts the chromosomal locations of CNVs in the ATF/CREB genes. Furthermore, mutations were discovered in every ATF/CREB gene, with a somatic mutation frequency of 12.01% (52/433 samples) (). Additionally, the 21 ATF/CREB genes were analyzed via univariate Cox proportional risk regression analysis, the hazard ratios (HRs) were calculated, and forest plots were drawn ().
Figure 2 Molecular characterization and expression variants of ATF/CREB family genes in HCC. (A) CNV frequencies of ATF/CREB family genes in HCC. Green dots represent deletion frequencies, red dots represent amplification frequencies, and the height of the columns represents a change in frequency. (B) Location of ATF/CREB family gene CNV on 23 chromosomes. (C) Mutation frequencies of ATF/CREB family genes in 433 patients with HCC in the TCGA database. Each column represents one patient, the bar on top represents TMB, and the numbers on the right represent the mutation frequency of each regulator. The bar on the right shows the proportion of each type of regulator. The stacked bars below show the percentage of conversions in each sample. (D) Univariate Cox regression analysis was used to study ATF/CREB family genes.
Risk Score Model Based on ATF/CREB Family Genes
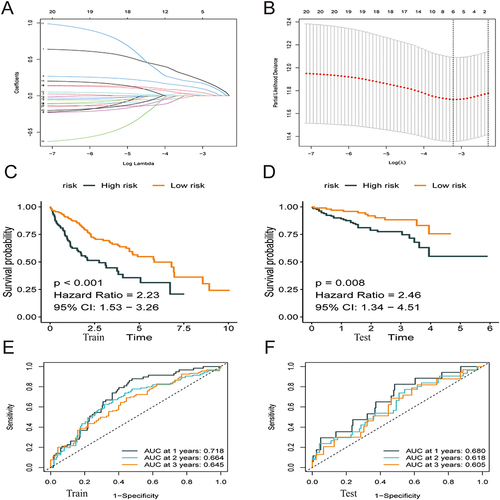
TCGA-HCC cohort (365 samples) was used as the training group, whereas the ICGC cohort (231 samples) was used as the validation group. Lasso–Cox regression analysis was used to estimate the coefficients of the selected ATF/CREB genes in the training group, and a risk score model was subsequently developed. Based on this model, the risk score was calculated as follows: Risk score = (0.249 * ATF1 exp.) + (0.116 * ATF4 exp.) + (0.057 * BATF exp.) + (0.189 * CREB1 exp.) + (0.027 * CREB3 exp.) + (0.010 * CREB3L1 exp.) ( and , Supplementary Tables 1 and 2). The median risk score was used to classify samples from both groups into high- and low-risk subgroups (categories). Survival, risk score, and gene expression were measured in both the training and validation dataset. The death rate was 42.30% and 28.96% in the high- and low-risk groups, respectively, in the training group, whereas it was 20.23% and 12.69%, respectively, in the validation group. Patients classified as having low risk had considerably prolonged OS as opposed to those classified as high risk, according to the outcomes of the survival analysis ( and ; p < 0.05). To ensure the robustness of the risk model, Receiver operating characteristic (ROC) curves were generated, and the area under the curve (AUC) was computed to provide predictions on patient survival ( and ).
Figure 3 Construction of a prognostic model based on ATF/CREB family genes. (A) The Lasso coefficient profiles of the 21 genes selected for OS against the log (lambda) sequence. (B) Ten-fold cross-validated error (the first vertical line equals the minimum error, whereas the second vertical line shows the cross-validated error within 1 standard error of the minimum). (C and D) Kaplan–Meier curves showed that patients with high-risk score had a worse OS than patients with low-risk score. (E and F) ROC curves at 1, 3 and 5 years for prognostic models.
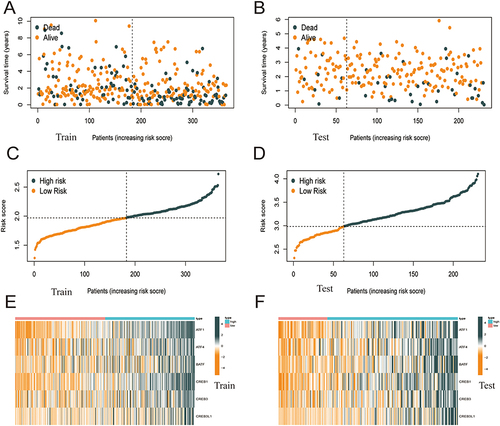
Heat maps were plotted to demonstrate the survival status of patients based on six independent prognostic genes, the distribution of risk score, and differences in gene expression. These heat maps were used to evaluate the risk model constructed using data extracted from TCGA database (). The prognostic model demonstrated excellent predictive accuracy, indicating that the model can accurately predict the onset and development of HCC.
Figure 4 The performance of the risk score model was based on 6 ATF / CREB family genes in training and test groups. (A–D) Patients with low-risk score generally had longer survival years, and lower mortality than patients with high-risk score. (E and F) Heatmaps of the risk score were based on ATF / CREB family genes in the training group (E) and the validation group (F).
Construction and Assessment of a Nomogram
To evaluate the clinical effectiveness of the ATF/CREB-based risk model in clinical practice, a nomogram was developed (). Patients were assigned a total score by adding the points of all prognostic parameters. When the sum of the points was greater, the patients’ clinical outcomes were less favorable. It was apparent from the calibration plot that the nomogram’s results were quite close to those of an ideal model (). The ROC curve also proved that the nomogram was sufficiently reliable in its predictions. ().
Figure 5 Nomogram model construction and prognostic factor analysis. (A) A nomogram model was constructed to predict the 1-year, 3-year, and 5-year OS probabilities of patients with HCC. (B) Calibration curves for the nomogram model to predict the probability of the 1-year, 3-year, and 5-year OS of patients with HCC. (C) ROC curves for the nomogram model to predict the probability of the 1-year, 3-year, and 5-year OS of patients with HCC. (D and E) The results of univariate (D) and multivariate Cox regression (E) for the OS of patients with HCC are shown in forest plots.
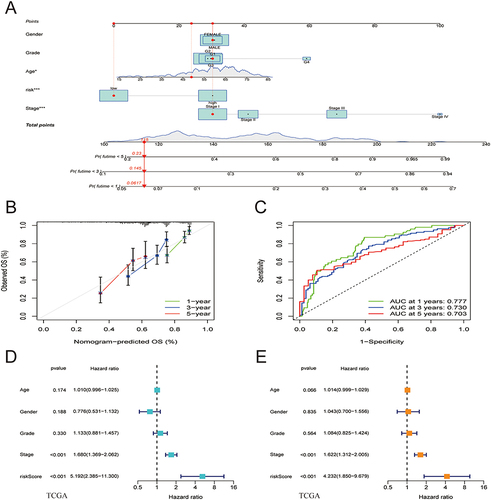
By making a comparison of the risk score model with clinical prognostic factors in the two cohorts by means of univariate and multivariate analyses, we determined the model’s role as an independent predictor of prognosis. The results revealed that both stage and risk score were associated with the prognosis of HCC, with the latter being an independent prognostic factor ( and ).
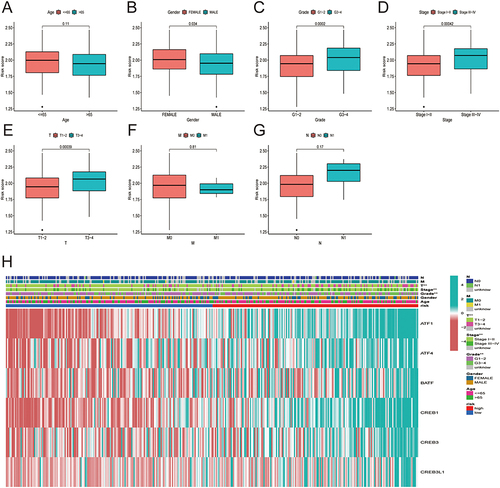
Association of HCC Patient Risk Score with Clinical-Pathological Features
The link between the risk score and clinicopathological variables of HCC patients was shown using box plots and heat map (). Histological grade, pathological stage, and T stage were all linked to the risk score. However, age and the M and N stages were not linked to the risk score. Heat map also revealed that ATF1, ATF4, BATF, CREB1, CREB3, and CREB3L1 were all expressed at high levels in the high-risk subgroup ().
Figure 6 Correlation between risk score and the clinicopathological features of patients with HCC: (A) age, (B) gender, (C) histological grade. (D) pathological stage, (E) T classification, (F) M classification, (G) N classification. (H) Heatmap demonstrating the expression of the six core genes in the high and low risk groups and the correlation of risk score with clinicopathological features.
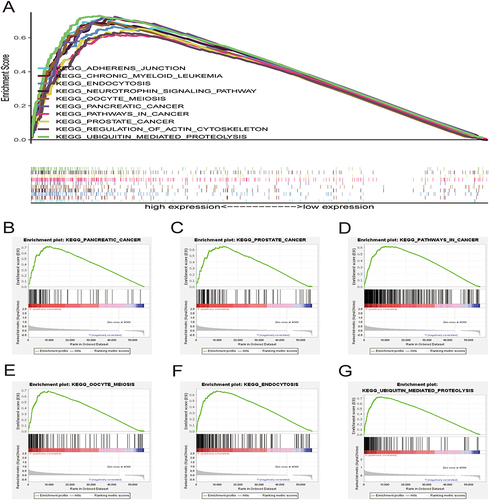
Gene Set Enrichment Analysis
Gene set enrichment analysis (GSEA) was performed to identify the top 10 relevant signaling pathways related to the 6 core prognostic genes in HCC (). The results showed that these genes were enriched in pathways associated with pancreatic cancer, prostate cancer, pathways in cancer, oocyte meiosis, endocytosis, and ubiquitin-mediated proteolysis (). Therefore, the six core genes are closely associated with cancer and may contribute to the development and progression of HCC.
Figure 7 Gene set enrichment analysis. (A) Top 10 pathways related to risk score-associated gene enrichment. Risk score-associated genes are enriched in (B) pancreatic cancer, (C) prostate cancer, (D) pathways in cancer, (E) oocyte meiosis, (F) endocytosis, and (G) ubiquitin mediated proteolysis.
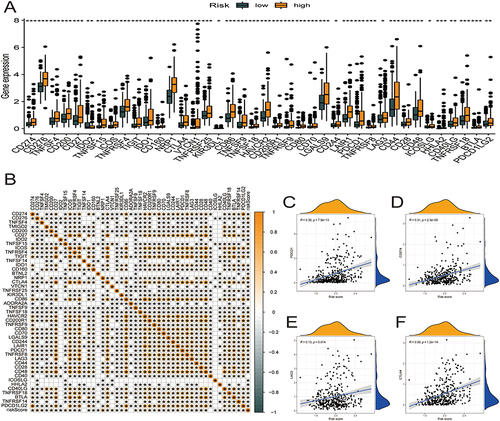
Correlational Analysis of Risk Score in the Prognostic Model with 46 Common Immune Checkpoint Genes in HCC
We characterized the interactions between risk score and 46 immune checkpoint genes in TCGA-HCC cohort (). The expression of the immune checkpoint genes was significantly higher in the high relative to the low-risk score group (). PDCD1, CD274, LAG3, and CTLA4 correlated positively with the risk score ().
Figure 8 Correlational analysis of risk score with 46 GC common immune checkpoint genes. (A) Differential expression of the 46 immune checkpoint genes between high- and low-risk score groups. (B) Correlation of risk score with 46 immune checkpoint genes in HCC. (C–F) Correlation of risk score with the expression of PDCD1, CD274, LAG3, and CTLA4 in TCGA-HCC dataset.
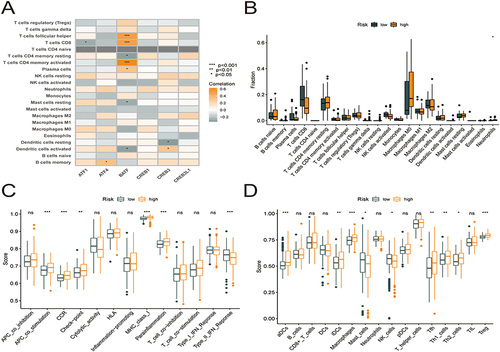
Link Between Risk Score and Immune Cell Infiltration
The CIBERSORT technique was used to evaluate the link between the risk model and immune cell infiltration by assessing the link between the 6 key prognostic genes and 22 different kinds of TIICs (, Supplementary Table 3). The study found an inverse relationship between ATF1 expression and the infiltration status of CD8 T cells. The presence of memory B cells was strongly linked to ATF4 expression; BATF expression was inversely linked to the infiltration status of resting memory CD4 T cells, resting mast cells, and activated dendritic cells and positively linked to the infiltration status of CD8 T cells, follicular helper T cells, and activated memory CD4 T cells; CREB3 expression was inversely linked to the abundance of resting dendritic cells (DCs) and favorably linked to the abundance of activated DCs. Furthermore, A comparison was made between high- and low-risk patients in terms of the level of immune cell infiltration (). The proportion of neutrophils was higher in the high-risk group. Neutrophils form the front line of defense in the innate immune system, with certain pro-inflammatory effects. After that, we evaluated how risk score is associated with immune cells and immune-related activities, and we used the ssGSEA approach to calculate enrichment score for various subgroups of immune cells and immune-related functions or pathways. Eighteen of the 29 subgroups of immune cells and functions were found to be substantially varied between the high- and low-risk categories (p < 0.05; and ). The high-risk category had more active immune cells and immune-related functions compared to the low-risk category.
Figure 9 Six core prognostic genes in HCC correlate significantly with immune cell infiltration. (A) Correlation between the six core prognostic genes and 22 immune cell infiltrates. (B) Box plots showing the differences in the proportions of 22 different types of immune cells in HCC tumor samples between high- and low-risk groups. (C) Differences in immune function scores between the high- and low-risk groups obtained using the ssGSEA algorithm. (D) Differences in the immune cell abundances between the high- and low-risk groups obtained using the ssGSEA algorithm.
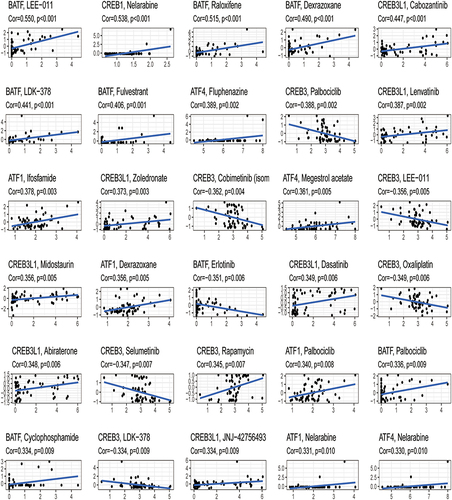
Correlation Between the Expression of the Six Core Prognostic Genes and Drug Sensitivity
We discovered that ATF1 expression was positively linked to ifosfamide and dexrazoxane sensitivity (p < 0.05). Megestrol acetate and fluphenazine sensitivity were strongly linked to ATF4 expression (p < 0.05). BATF expression was favorably linked to raloxifene and dexrazoxane sensitivity (p < 0.05). There was a favorable link between CREB1 expression and imiquimod sensitivity (p < 0.05). We found that CREB3 expression was positively linked to rapamycin sensitivity (p < 0.05). Lenvatinib and zoledronate sensitivity was positively linked to CREB3L1 expression (p < 0.05) (, Supplementary Table 4).
Figure 10 Correlational analysis of the expression of the six core prognostic genes and drug sensitivity.
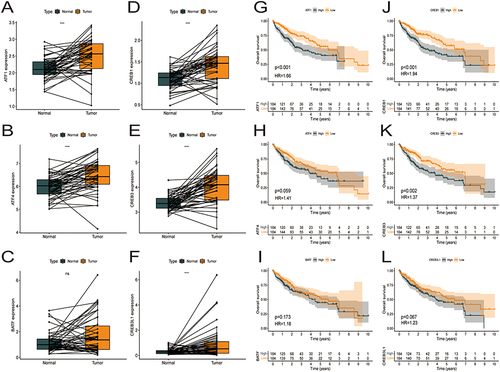
Expression of the Six Core Genes in HCC and Adjacent Normal Tissues and Their Correlation with the Prognosis of HCC
On comparing the mRNA expression profiles of 50 pairs of HCC and adjacent normal tissues in TCGA-HCC cohort, the expression of ATF1, ATF4, CREB1, CREB3, and CREB3L1 was found to be significantly higher in HCC tissues (p < 0.05, ), whereas that of BATF was not significantly different between HCC and normal tissues (p > 0.05, ). The KM plotter was used to analyze the relationship between OS and the six core prognostic genes. The prognosis of patients with low expression of ATF1, CREB1, and CREB3 was better than that of patients with high expression of these genes (; p < 0.05). However, the prognosis of patients with high and low expression of ATF4, BATF, and CREB3L1 was not significantly different (; p > 0.05). These results suggest that ATF1, CREB1, and CREB3 are potential prognostic biomarkers for HCC.
Figure 11 Expression of 6 core genes in HCC and adjacent tissues and prognosis in HCC. (A–F) ATF1, ATF4, BATF, CREB1, CREB3, and CREB3L1 are overexpressed in the tumor tissues as compared to the paraneoplastic tissues in TCGA-HCC cohort. (G–I) Survival curve showing the impact of expressions of ATF1, ATF4, BATF, CREB1, CREB3, and CREB3L1 on the OS in TCGA-HCC dataset.
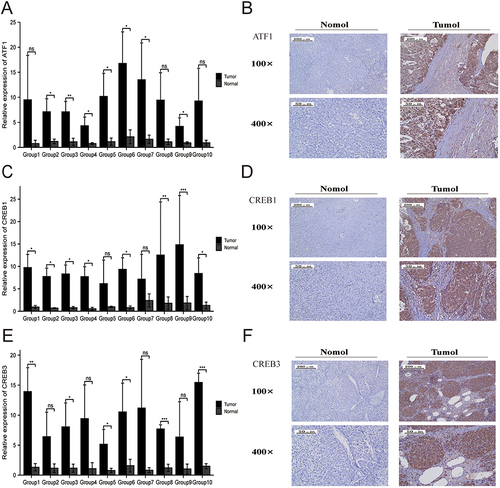
Validation of ATF1, CREB1 and CREB3 Expression in HCC
The above analysis revealed that ATF1, CREB1, and CREB3 have the potential as prognostic biomarkers for HCC. We verified the expression of ATF1, CREB1, and CREB3 in HCC and adjoining samples using qRT-PCR and IHC assays. qRT-PCR and immunohistochemistry showed that ATF1, CREB1, and CREB3 were expressed at higher levels in HCC in contrast with adjoining normal samples (P < 0.05, ).
Figure 12 ATF1, CREB1, and CREB3 expression in HCC tissues and adjacent normal tissues. (A, C and E) qRT-PCR revealed that ATF1, CREB1, and CREB3 expression was higher in HCC tissues than in normal tissues. (B, D and E) Immunohistochemical analysis showed that ATF1, CREB1, and CREB3 expression was significantly higher in HCC tissues than in adjacent normal tissues (*p < 0.05; **p < 0.01; ***p < 0.001).
Discussion
The liver plays an important role in regulating glucose and lipid metabolism.Citation24,Citation25 Dysregulation of glucose and lipid metabolism can lead to type 2 diabetes mellitus and non-alcoholic fatty liver disease, which increases the risk of HCC.Citation26 The ATF/CREB family of transcription factors is involved in the regulation of not only insulin sensitivity and glucose metabolism but also many aspects of lipid metabolism. In addition, the ATF/CREB family members are involved in the regulation of hepatocyte growth and proliferation; however, the uncontrolled activation of cell growth and proliferation leads to tumorigenesis.Citation2 Dysregulation of ATF/CREB signaling is associated with carcinogenesis and tumor progression in HCC.Citation8,Citation14,Citation27 This study aimed to assess the relationship between the ATF/CREB family and HCC, and the findings may help to develop new strategies for the treatment of HCC.
HCC is the fourth leading cause of cancer-related death worldwide.Citation16,Citation28 Usually, the development of HCC occurs in livers that are severely damaged by chronic injury or inflammation.Citation29 Treatment options for HCC include surgery,Citation18,Citation30 liver transplantation,Citation31 local area therapy,Citation32,Citation33 chemotherapy,Citation34,Citation35 and targeted therapies based on tyrosine protein kinase inhibitors.Citation29 However, because most patients are diagnosed at an advanced stage, the optimal time window for surgical resection or liver transplantation is often lost.Citation19 In recent years, significant progress has been made in the treatment of HCC owing to the development of targeted drugs and identification of immunotherapeutic agents.Citation36,Citation37 Currently, atezolizumab plus bevacizumab have been used as first-line treatments for patients with unresectable HCC, and nivolumab and pembrolizumab immune checkpoint inhibitors have also been investigated as novel second-line agents for the treatment of HCC.Citation38 However, the therapeutic outcomes are unsatisfactory, thus necessitating the discovery of new therapeutic strategies.
The ATF/CREB family contains 21 members.Citation2 In this study, the molecular profiles of these genes were comprehensively assessed using expression data extracted from the TCGA-HCC cohort. These 21 genes were also investigated for expression, CNVs, somatic mutations, and prognostic significance in HCC. The entire TCGA dataset was used as the training group, whereas the ICGC dataset was used as the validation group. Six ATF/CREB genes (ATF1, ATF4, BATF, CREB1, CREB3, and CREB3L1) were used in a Lasso-Cox analysis to develop a predictive model. Then, the median risk score was utilized to classify both groups of participants into high- and low-risk categories. In comparison to the low-risk category, those at high risk exhibited an unfavorable prognosis. In particular, the risk score was shown to have adequate prediction performance, as per ROC curve analysis. Good discriminating efficacy was shown by the risk model in the prediction of HCC patients’ prognoses. The risk score independently functioned as a prognostic indicator, as shown by both univariate and multivariate Cox regression analyses. The clinical effectiveness of the ATF/CREB-based risk model was validated by a nomogram. Although there was a link between the risk score and sex, histological grade pathological stage, and T stage, such connections were not shown with age, the M stage, or the N stage. To evaluate the distribution of TIICs between low- and high-risk categories, the CIBERSORT algorithm was utilized. The high-risk category had a remarkably greater proportion of follicular helper T cells than the low-risk patients. Neutrophils are effectors of innate immunity and can potentially modulate a wide variety of processes, including acute injury and repair, cancer, autoimmunity, and chronic inflammation.Citation39 Using the ssGSEA method, 29 distinct kinds of immune cells and immunological-related functions were obtained, and 18 of them showed a statistically significant variation across the two risk categories. In the high-risk patients, immune cells and immune-related functions were more active than those in the low-risk category. In addition to this, it was discovered that most ICGs were expressed at higher levels in the high-risk category, and there was a positive link between the risk score and PDCD1, CD274, LAG3, and CTLA4 expression.
ATF1, CREB1, and CREB3 were among the six key prognostic genes that were shown to be upregulated in HCC in contrast with the neighboring normal tissues. Also, HCC patients with elevated expression levels of ATF1, CREB1, and CREB3 had a lower 10-year OS. Elevated levels of ATF1, CREB1, and CREB3 expression were validated by qRT-PCR and IHC studies in HCC samples. Therefore, ATF1, CREB1, and CREB3 may be used as prognostic biomarkers in HCC. H3K27 acetylation-activated lncRNA GHET1 promotes tumorigenesis by regulating ATF1 in HCC.Citation40 The proliferative and migratory capacities of HCC cells are enhanced by the HBx-CTTN interplay through CREB1.Citation41 Transcription factor CREB3 is a growth suppressor targeted by the hepatitis C virus oncoprotein.Citation12 Analysis of immune cell infiltration revealed that ATF1 expression was inversely linked to CD8 T cell levels. Tumor suppression and immunotherapeutic responses are mostly dependent on CD8 T cells.Citation42,Citation43 Moreover, CREB3 expression was inversely linked to the infiltration status of resting dendritic DCs and positively linked to that of activated DCs. In the context of immunological responses, DCs exert a fundamental function as powerful antigen-presenting cells.Citation44 Overall, the findings of this research show a strong association of ATF1, CREB1, and CREB3 with the prognosis of HCC patients.
This study may have several limitations. First, although we did qRT-PCR and immunohistochemistry experiments, in-depth mechanistic studies were lacking, especially genome-directed stratification experiments were not designed. Therefore, future research experiments are necessary. Second, previous studies have shown some bias in proportional risk in Cox regression models of transcriptomic data in the TCGA cancer cohort,Citation45 and our study relied primarily on data from the public source TCGA database, which may result in bias in multivariate models and hazard’s proportionality. In addition, the ROC curve was applied twice in this study, which is defined as a plot of test sensitivity as the y coordinate versus its 1-specificity or false positive rate as the x coordinate, is an effective method of evaluating the quality or performance of diagnostic tests.Citation46 By constructing a roc curve, shifting the cut-off along the entire range of possible results, a theoretically infinite number of paired sensitivity and specificity values would be obtained, but choosing a threshold in which all true positives could be identified would certainly result in a high number of false positives.Citation47,Citation48 Therefore, it will cause some bias in the study results, which is another limitation of this study.
Conclusion
The predictive value, together with the mutation and expression patterns of ATF/CREB family genes in HCC, was systematically analyzed. A risk model was constructed, and patients with HCC were divided into the high- and low-risk groups. Patients in the low-risk category had a remarkably more favorable prognosis than those in the high-risk category. Furthermore, a nomogram was constructed, which anticipated the recurrence of HCC in an accurate manner, thus facilitating the development of individualized treatment for HCC. In addition, the relationships among ATF/CREB genes, the tumor immune microenvironment, and chemotherapeutic responses were examined. This study’s findings provide important information for developing more specific and tailored approaches to treating HCC.
Abbreviations
HCC, hepatocellular carcinoma; TCGA, The Cancer Genome Atlas; ICGC, the International Cancer Genome Consortium; OS, overall survival; CNVs, copy number variations; C-index, concordance index; GSEA, Gene set enrichment analysis; IHC, Immunohistochemistry; RT, room temperature; qRT-PCR, Quantitative reverse transcription polymerase chain reaction; DCs, resting dendritic cells; KM, Kaplan-Meier; FDR, false discovery rate; AUC, area under the curve; ROC, Receiver operating characteristic.
Data Sharing Statement
This study analysed used clinical data publicly available in the following online databases: TCGA (https://www.cancer.gov/), ICGC (https://dcc.icgc.org), and CellMiner (https://discover.nci.nih.gov/cellminer/home.do).
Ethics Approval and Informed Consent
Human subject research was reviewed and approved by the Ethics Committee of the First Affiliated Hospital of Bengbu Medical College [2022] 298. The study was performed in compliance with the Helsinki Declaration. All original liver donations were conducted voluntarily, with written informed consent and in compliance with the Declaration of Istanbul.
Author Contributions
All authors made a significant contribution to the work reported, whether that is in the conception, study design, execution, acquisition of data, analysis and interpretation, or in all these areas; took part in drafting, revising or critically reviewing the article; gave final approval of the version to be published; have agreed on the journal to which the article has been submitted; and agree to be accountable for all aspects of the work.
Disclosure
The authors report no conflicts of interest in this work.
Acknowledgments
We thank Bullet Edits Limited for language editing and proofreading of the manuscript and open databases such as TCGA, ICGC, and CellMiner for providing the platform and datasets.
Additional information
Funding
References
- Hai T, Hartman MG. The molecular biology and nomenclature of the activating transcription factor/cAMP responsive element binding family of transcription factors: activating transcription factor proteins and homeostasis. Gene. 2001;273(1):1–11. doi:10.1016/S0378-1119(01)00551-0
- Cui A, Ding D, Li Y. Regulation of hepatic metabolism and cell growth by the ATF/CREB family of transcription factors. Diabetes. 2021;70(3):653–664. doi:10.2337/dbi20-0006
- Lin HV, Accili D. Hormonal regulation of hepatic glucose production in health and disease. Cell Metab. 2011;14(1):9–19. doi:10.1016/j.cmet.2011.06.003
- Lou MD, Li J, Cheng Y, et al. Glucagon up-regulates hepatic mitochondrial pyruvate carrier 1 through cAMP-responsive element-binding protein; inhibition of hepatic gluconeogenesis by ginsenoside Rb1. Br J Pharmacol. 2019;176(16):2962–2976. doi:10.1111/bph.14758
- Allen-Jennings AE, Hartman MG, Kociba GJ, Hai T. The roles of ATF3 in glucose homeostasis. A transgenic mouse model with liver dysfunction and defects in endocrine pancreas. J Biol Chem. 2001;276(31):29507–29514. doi:10.1074/jbc.M100986200
- Seo HY, Kim MK, Min AK, et al. Endoplasmic reticulum stress-induced activation of activating transcription factor 6 decreases cAMP-stimulated hepatic gluconeogenesis via inhibition of CREB. Endocrinology. 2010;151(2):561–568. doi:10.1210/en.2009-0641
- Lee MW, Chanda D, Yang J, et al. Regulation of hepatic gluconeogenesis by an ER-bound transcription factor, CREBH. Cell Metab. 2010;11(4):331–339. doi:10.1016/j.cmet.2010.02.016
- Tsai WW, Matsumura S, Liu W, et al. ATF3 mediates inhibitory effects of ethanol on hepatic gluconeogenesis. Proc Natl Acad Sci U S A. 2015;112(9):2699–2704. doi:10.1073/pnas.1424641112
- Koo SH, Flechner L, Qi L, et al. The CREB coactivator TORC2 is a key regulator of fasting glucose metabolism. Nature. 2005;437(7062):1109–1111. doi:10.1038/nature03967
- Kim H, Zheng Z, Walker PD, Kapatos G, Zhang K. CREBH maintains circadian glucose homeostasis by regulating hepatic glycogenolysis and gluconeogenesis. Mol Cell Biol. 2017;37(14). doi:10.1128/MCB.00048-17
- Shuda M, Kondoh N, Imazeki N, et al. Activation of the ATF6, XBP1 and grp78 genes in human hepatocellular carcinoma: a possible involvement of the ER stress pathway in hepatocarcinogenesis. J Hepatol. 2003;38(5):605–614. doi:10.1016/S0168-8278(03)00029-1
- Chin KT, Zhou HJ, Wong CM, et al. The liver-enriched transcription factor CREB-H is a growth suppressor protein underexpressed in hepatocellular carcinoma. Nucleic Acids Res. 2005;33(6):1859–1873. doi:10.1093/nar/gki332
- Chen C, Ge C, Liu Z, et al. ATF3 inhibits the tumorigenesis and progression of hepatocellular carcinoma cells via upregulation of CYR61 expression. J Exp Clin Cancer Res. 2018;37(1):263. doi:10.1186/s13046-018-0919-8
- Wu Y, Wu B, Chen R, Zheng Y, Huang Z. High ATF5 expression is a favorable prognostic indicator in patients with hepatocellular carcinoma after hepatectomy. Med Oncol. 2014;31(11):269. doi:10.1007/s12032-014-0269-0
- Llovet JM, Kelley RK, Villanueva A, et al.Hepatocellular carcinoma. Nat Rev Dis Primers. 2021;7(1):7. doi:10.1038/s41572-021-00245-6
- Sung H, Ferlay J, Siegel RL, et al. Global cancer statistics 2020: GLOBOCAN estimates of incidence and mortality worldwide for 36 cancers in 185 countries. CA Cancer J Clin. 2021;71(3):209–249. doi:10.3322/caac.21660
- Llovet JM, Zucman-Rossi J, Pikarsky E, et al. Hepatocellular carcinoma. Nat Rev Dis Primers. 2016;2:16018. doi:10.1038/nrdp.2016.18
- Wilson GC, Geller DA. Evolving Surgical Options for Hepatocellular Carcinoma. Surg Oncol Clin N Am. 2019;28(4):645–661. doi:10.1016/j.soc.2019.06.006
- Serper M, Taddei TH, Mehta R, et al. Association of provider specialty and multidisciplinary care with hepatocellular carcinoma treatment and mortality. Gastroenterology. 2017;152(8):1954–1964. doi:10.1053/j.gastro.2017.02.040
- Huang A, Yang XR, Chung WY, Dennison AR, Zhou J. Targeted therapy for hepatocellular carcinoma. Signal Transduct Target Ther. 2020;5(1):146. doi:10.1038/s41392-020-00264-x
- Sangro B, Sarobe P, Hervas-Stubbs S, Melero I. Advances in immunotherapy for hepatocellular carcinoma. Nat Rev Gastroenterol Hepatol. 2021;18(8):525–543. doi:10.1038/s41575-021-00438-0
- Colaprico A, Silva TC, Olsen C, et al. TCGAbiolinks: an R/Bioconductor package for integrative analysis of TCGA data. Nucleic Acids Res. 2016;44(8):e71. doi:10.1093/nar/gkv1507
- Chen B, Khodadoust MS, Liu CL, Newman AM, Alizadeh AA. Profiling tumor infiltrating immune cells with CIBERSORT. Methods Mol Biol. 2018;1711:243–259.
- Han HS, Kang G, Kim JS, Choi BH, Koo SH. Regulation of glucose metabolism from a liver-centric perspective. Exp Mol Med. 2016;48:e218. doi:10.1038/emm.2015.122
- Jones JG. Hepatic glucose and lipid metabolism. Diabetologia. 2016;59(6):1098–1103. doi:10.1007/s00125-016-3940-5
- Tilg H, Moschen AR, Roden M. NAFLD and diabetes mellitus. Nat Rev Gastroenterol Hepatol. 2017;14(1):32–42. doi:10.1038/nrgastro.2016.147
- Arai M, Kondoh N, Imazeki N, et al. Transformation-associated gene regulation by ATF6alpha during hepatocarcinogenesis. FEBS Lett. 2006;580(1):184–190. doi:10.1016/j.febslet.2005.11.072
- Yang JD, Heimbach JK. New advances in the diagnosis and management of hepatocellular carcinoma. BMJ. 2020;371:m3544. doi:10.1136/bmj.m3544
- Leone P, Solimando AG, Fasano R, et al. The evolving role of immune checkpoint inhibitors in hepatocellular carcinoma treatment. Vaccines. 2021;9(5). doi:10.3390/vaccines9050532
- Cai W, Liu Z, Xiao Y, et al. Comparison of clinical outcomes of laparoscopic versus open surgery for recurrent hepatocellular carcinoma: a meta-analysis. Surg Endosc. 2019;33(11):3550–3557. doi:10.1007/s00464-019-06996-4
- Vivarelli M, Cucchetti A, La Barba G, et al. Liver transplantation for hepatocellular carcinoma under calcineurin inhibitors: reassessment of risk factors for tumor recurrence. Ann Surg. 2008;248(5):857–862. doi:10.1097/SLA.0b013e3181896278
- European Association for the Study of the Liver. Electronic address eee, European Association for the Study of the L. EASL clinical practice guidelines: management of hepatocellular carcinoma. J Hepatol. 2018;69(1):182–236. doi:10.1016/j.jhep.2018.03.019
- Beleù A, Autelitano D, Geraci L, et al. Radiofrequency ablation of hepatocellular carcinoma: CT texture analysis of the ablated area to predict local recurrence. Eur J Radiol. 2022;150:110250. doi: 10.1016/j.ejrad.2022.110250
- Ikeda M, Morizane C, Ueno M, Okusaka T, Ishii H, Furuse J. Chemotherapy for hepatocellular carcinoma: current status and future perspectives. Jpn J Clin Oncol. 2018;48(2):103–114. doi:10.1093/jjco/hyx180
- Yamamoto S, Kondo S. Oral chemotherapy for the treatment of hepatocellular carcinoma. Expert Opin Pharmacother. 2018;19(9):993–1001. doi:10.1080/14656566.2018.1479398
- Kirstein MM, Wirth TC. Multimodale Therapie des hepatozellulären Karzinoms[Multimodal treatment of hepatocellular carcinoma]. Internist. 2020;61(2):164–169. German. doi:10.1007/s00108-019-00722-x
- Johnston MP, Khakoo SI. Immunotherapy for hepatocellular carcinoma: current and future. World J Gastroenterol. 2019;25(24):2977–2989. doi:10.3748/wjg.v25.i24.2977
- Solimando AG, Susca N, Argentiero A, et al. Second-line treatments for advanced hepatocellular carcinoma: a systematic review and bayesian network meta-analysis. Clin Exp Med. 2022;22(1):65–74. doi:10.1007/s10238-021-00727-7
- Liew PX, Kubes P. The neutrophil’s role during health and disease. Physiol Rev. 2019;99(2):1223–1248. doi:10.1152/physrev.00012.2018
- Ding G, Li W, Liu J, et al. LncRNA GHET1 activated by H3K27 acetylation promotes cell tumorigenesis through regulating ATF1 in hepatocellular carcinoma. Biomed Pharmacother. 2017;94:326–331. doi:10.1016/j.biopha.2017.07.046
- Li Y, Fu Y, Hu X, et al. The HBx-CTTN interaction promotes cell proliferation and migration of hepatocellular carcinoma via CREB1. Cell Death Dis. 2019;10(6):405. doi:10.1038/s41419-019-1650-x
- Hossain MA, Liu G, Dai B, et al. Reinvigorating exhausted CD8(+) cytotoxic T lymphocytes in the tumor microenvironment and current strategies in cancer immunotherapy. Med Res Rev. 2021;41(1):156–201. doi:10.1002/med.21727
- Lees JR. CD8+ T cells: the past and future of immune regulation. Cell Immunol. 2020;357:104212. doi:10.1016/j.cellimm.2020.104212
- Brossart P, Wirths S, Brugger W, Kanz L. Dendritic cells in cancer vaccines. Exp Hematol. 2001;29(11):1247–1255. doi:10.1016/S0301-472X(01)00730-5
- Zeng Z, Gao Y, Li J, et al. Violations of proportional hazard assumption in Cox regression model of transcriptomic data in TCGA pan-cancer cohorts. Comput Struct Biotechnol J. 2022;20:496–507. doi:10.1016/j.csbj.2022.01.004
- Park SH, Goo JM, Jo CH. Receiver operating characteristic (ROC) curve: practical review for radiologists. Korean J Radiol. 2004;5(1):11–18. doi:10.3348/kjr.2004.5.1.11
- Obuchowski NA, Bullen JA. Receiver operating characteristic (ROC) curves: review of methods with applications in diagnostic medicine. Phys Med Biol. 2018;63(7):07TR01. doi:10.1088/1361-6560/aab4b1
- Kamarudin AN, Cox T, Kolamunnage-Dona R. Time-dependent ROC curve analysis in medical research: current methods and applications. BMC Med Res Methodol. 2017;17(1):53. doi:10.1186/s12874-017-0332-6