
Abstract
Introduction
Immune checkpoint (IC) inhibitor-related immunotherapies have attracted considerable attention in hepatocellular carcinoma (HCC). High IC expression and high tumor infiltrating lymphocyte levels are the current indicators of sensitivity to IC inhibitors. Thus, it is imperative to apply precision medicine strategies for patient selection.
Methods
Six independent HCC cohorts were used for analysis at the single-cell and tissue levels. Multiplex immunofluorescence and immunochemistry staining assays were used to validate our results. A series of methodologies were used for immune-related evaluations.
Results
Herein, we uncovered a unique CD8+CD274+ cell subpopulation that is associated with tumor progression and poor survival in HCC at the single-cell level. We assessed this subset at the tissue level and found that the prognostic significance of CD274 is dependent on CD8A expression in HCC. Subsequently, we identified a unique high-risk subpopulation that showed high CD8A expression coupled with intense CD274 expression in multiple HCC cohorts. CD8AHighCD274High* subgroup was correlated with malignant indexes and remained an independent prognostic factor when considering the influence of these indexes. Molecular characteristic analyses showed that the CD8AHighCD274High* subgroup harbored more mutations, had higher immune response activity and presented enrichment of cancer-related biological processes. Moreover, this high-risk subpopulation in HCC was characterized by high immune cell infiltration, low tumor purity, and enrichment of cancer-related signatures. Finally, cases with this phenotype demonstrated higher immunomodulator and IC levels and greater sensitivity to IC inhibitors.
Conclusion
Our findings illustrate that some HCC patients may have a poor prognosis despite high CD8+ T-cell infiltration. These patients would probably benefit from IC inhibitor-based combination treatment.
Introduction
Liver cancer is the seventh most common cancer type in the world and remains a global health challenge in the 21st century. Hepatocellular carcinoma (HCC) has a high degree of malignancy and accounts for greater than 90% of primary liver cancers.Citation1 In addition to surgical treatment, new drug therapies for HCC have attracted much attention. With the launch of precision medicine, especially the advent of the immunotherapy era, increasing attention has been given to studies of immune checkpoint (IC) inhibitors in the precision treatment of HCC.Citation2 Programmed death receptor-1 (PD-1) is a critical IC that inhibits T-cell activation and cytokine production through its two ligands, CD274 (commonly known as PD-L1) and PD-L2. CD274 inhibition is one of the most popular clinical research and treatment strategies. CD274 inhibitors can reactivate the immune response function of T cells on tumors by inhibiting IC activity, resulting in antitumor effects. However, the benefits of CD274 inhibitors cannot be accurately captured in clinical practice. Currently, patients who are sensitive to CD274 or PD-L1 antibodies mainly have the following characteristics: 1) high CD274 expression, ie, patients with an expression rate of 1% can be treated with this therapy, but those with an expression rate over 50% exhibit better efficacy; 2) high tumor mutational burden, ie, treatment is effective in patients with a tumor mutational burden of > 20/Mb; 3) high levels of tumor infiltrating lymphocytes.Citation3,Citation4 However, the efficacy of these inhibitors in the treatment of HCC remains limited. Thus, it is now imperative to apply precision medicine strategies for patient selection.
The immune response is complex and may be highly heterogeneous among tumors, even tumors from the same cancer type, probably due to the complex and heterogeneous tumor microenvironment (TME).Citation5,Citation6 Thus, TME-based molecular subtyping systems have been developed for precision therapy in several cancer types. Previous studies on the Immunoscore showed that high immune cell infiltration predicts prolonged survival in multiple cancer types, including HCC.Citation7,Citation8 However, recent studies have identified unique subgroups with high risk that feature high levels of immune infiltration and IC expression, and only two genes need to be examined to stratify patients into these groups.Citation5,Citation9 Hence, the identification of a novel TME-based immune molecular subtyping system is urgently needed in HCC to personalize cancer immunotherapies.
In this study, we analyzed tumors at the single-cell level and identified a unique CD8+CD274+ cell subpopulation in HCC. We assessed this subset at the tissue level and found a risk subpopulation among HCC patients showing high CD8A expression coupled with intense CD274 expression. Furthermore, molecular and immune characteristics of this subgroup were explored in HCC datasets.
Materials and Methods
Data and Resources
We downloaded The Cancer Genome Atlas (TCGA) HCC primary tumor RNA-Seq data, mutation and related clinical information from the Genomic Data Commons (GDC) Data Portal (https://portal.gdc.cancer.gov/). Overall survival (OS) data of the TCGA cohort were obtained from the integrated TCGA Pan-cancer clinical data resource.Citation10 HCC microarray expression data GSE76427 were available on GEO (http://www.ncbi.nlm.nih.gov/geo). HCC RNA-Seq data LINC-JP were downloaded from ICGC (https://dcc.icgc.org/releases/current/Projects/). HCC protein data were obtained from CPTAC (https://proteomics.cancer.gov/programs/cptac). HCC single-cell RNA sequencing (scRNA-Seq) data were obtained from a previous study (https://db.cngb.org/search/project/CNP0000650). A total of 80 pathological paraffin sections and medical records were obtained from patients who underwent radical resection at The Second Affiliated Hospital of South China University of Technology (Guangzhou, China) between December 2016 and December 2020 (Table S1). These patients did not receive immunotherapy, chemotherapy, or radiofrequency ablation. All experimental procedures were approved by the Ethics Committee of The Second Affiliated Hospital of South China University of Technology. Written informed consent was provided by all patients before the study.
Single-Cell Level Analysis
The HCC scRNA-Seq dataset CNP0000650 contains information on 19 samples, including 6 recurrent tumor samples and 12 orthotopic tumor samples. We selected tumor in situ samples for follow-up analysis. The specific data quality control process was strictly based on the literature published in a previous study, and 12,185 cells were selected for further analysis. The Seurat R package was used to perform unsupervised clustering of the single cells using the read count matrix as input.Citation11 For the clustering of cells, the top 20 principal components (PCs) were selected for principal component analysis (PCA) with a resolution parameter equal to 0.8. For the clustering of T lymphocytes, the top 12 PCs were selected with a resolution parameter equal to 0.6. The Scissor R package used bulk phenotypes to identify cell subsets that are highly correlated with phenotypes from scRNA-seq data.Citation12 To obtain the appropriate sparsity, we finally determined the penalty value as alpha = 0.02 after many iterations. The CellChat R package was used to infer, visualize and analyze intercellular communication from scRNA-seq data.Citation13 The cell lineage trajectory of CD8+ T cells was inferred by using Monocle2.Citation14
Mutation Analysis
The Maftools package from R software was used to analyze Mutation Annotation Format files in the HCC CD8AHighCD274High* and other subgroups of the TCGA HCC cohort as previously described.Citation15,Citation16
Enrichment Analysis
GSEA 4.3.0 software was used to estimate the recurrence risk and assess the enrichment of biological processes in the HCC CD8AHighCD274High* subgroup. Predefined gene sets are available on the Molecular Signatures Database (MSigDB) website (https://www.gsea-msigdb.org/gsea/msigdb/collections.jsp). HOSHIDA_LIVER_CANCER_LATE_RECURRENCE_UP and WOO_LIVER_CANCER_RECURRENCE_UP were defined as gene sets whose expression correlated with a higher risk of late recurrence of HCC. Gene ontology biological process and KEGG pathway database and hallmark gene sets, respectively. Single-sample gene set enrichment analysis (ssGSEA) was performed via the GSVA package in R software to calculate the enrichment degree of KEGG_PATHWAYS_IN_CANCER, HALLMARK_ANGIOGENESIS, and KEGG_JAK_STAT_SIGNALING_PATHWAY signatures in the TCGA HCC cohort.
Immune Evaluation
Four independent approaches were used to evaluate immune infiltrates in the TCGA HCC cohort: ESTIMATE, analysis of a 22 immune cell type signature (LM22) via CIBERSORTx, Pan-cancer immunogenomics and TIMER2.Citation17–21 Multiplatform integrative molecular subtyping of the TCGA HCC cohort and revealed the following groups: iClust1, iClust2 and iClust3.Citation22 Six immune subtypes were identified in 33 TCGA cancer types: C1 (wound healing), C2 (IFN-g dominant), C3 (inflammatory), C4 (lymphocyte depleted), C5 (immunologically quiet) and C6 (TGF-β dominant).Citation23 Four immune/fibrotic TME subtypes were detected and conserved in TCGA human cancers: immune-enriched/fibrotic (IE/F), immune-enriched/nonfibrotic (IE), fibrotic (F) and immune-depleted (D).Citation24 Cancer-associated fibroblast (CAF) level estimation was performed with the MCPCOUNTER and EPIC algorithms via the TIMER 2.0 (http://timer.cistrome.org/).Citation25,Citation26 Immunomodulator genes were collected from a previous TCGA immune subtype study.Citation23 Tumor Immune Dysfunction and Exclusion (TIDE) analysis was performed at http://tide.dfci.harvard.edu/. The TIDE score computed for each tumor can serve as a surrogate biomarker to predict the response to IC blockade. A more negative TIDE score probably predicts a better IC blockade response.Citation27
Immunohistochemistry (IHC) Assay
Formalin-fixed and paraffin-embedded pathological wax blocks were sequentially sectioned. Next, the slices were dewaxed, dehydrated and subjected to EDTA (pH = 8.0) at high temperature and pressure for 3 min. Then, the endogenous peroxidase activity was blocked by incubation with 0.3%H2O2 at 37°C for 10 min, sealed with 5% goat serum at 37°C for 20 min. Primary antibodies, including anti-CD8A (China, LBP, IHC-R024) and anti-CD274 (UK, Abcam, ab210931), were incubated overnight at 4°C and finally stained with DAB. All slides were counterstained with hematoxylin and sealed with neutral resin. A Lecai SOPTOP HS6 scanner, ImageJ and scoring systems were used to analyze the results according to a previous study.Citation28
Multiplex Immunofluorescence (mIF) Assay
Multiplex staining of FFPE tissue was performed using a multiple fluorescent immunohistochemical staining kit (absin, abs50012) according to the manufacturer’s instructions. CD274 (UK, Abcam, ab210931) and CD8 (China, LBP, IHC-R024) antibodies were sequentially applied, followed by horseradish peroxidase-conjugated secondary antibody incubation and tyramide signal amplification. After the sections were washed 3 times with PBS, multispectral images were obtained by using the Mantra System (Zeiss LSM880), which captures fluorescent spectra at 20-nm wavelength intervals from 420–720 nm with identical exposure times. For each slide, five fields of immune cell-enriched tumoral area were selected for image capture.
Statistical Analysis, Code Availability and Visualization
OS was evaluated by Kaplan–Meier survival analysis and Log rank test as previously described:Citation9,Citation16 HCC samples of each cohort were divided into high and low expression groups according to CD8A or CD274 level, and P values based on two groups were examined based on Kaplan–Meier survival analysis. The lowest log-rank P value was selected from the 10th to 90th percentiles of these samples. Patient survival was analyzed by R software 4.1.0 and GraphPad Prism 9. The Mann–Whitney test was used in the two-group comparisons, and the Kruskal–Wallis test was used in the three-group comparisons in GraphPad Prism 9. All reported P values were two-sided. Chi-squared test analyses were performed using GraphPad Prism 9. Analyses were performed using R software 4.1.0 with the GSVA (1.40.1) package (ssGSEA) for Pan-cancer immunogenomics and enrichment score calculation; the survival (3.2–11) package for two-group OS analysis; the ESTIMATE (1.0.13) package for ESTIMATE immune score and tumor purity estimation; the Seurat (4.0.3) package for clustering and annotation of HCC single-cell samples; and the Scissor (2.0.0) package for identifying high- and low-risk subpopulations at the single-cell level by integrating bulk sequencing data. The Monocle (2.18.0) package can be used to model the changes in cells by comparing cell features over time. A P value less than 0.05 was regarded as statistically significant. Figure generation and data analysis were performed with GraphPad Prism 9 and R software 4.1.0.
Results
A Unique CD8+ T-Cell Subpopulation is Related to a Poor Prognosis in HCC
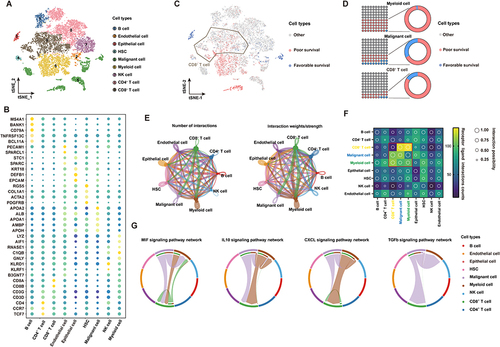
To construct a global tumor niche atlas, we identified and visualized 9 major clusters using the T-distributed stochastic neighbor embedding (t-SNE) method (). Nonimmune cells primarily consisted of endothelial cells, hepatic stellate cells, apparently normal epithelial cells and HCC malignant cells (). Furthermore, the most abundant immune cells in the TME of HCC patients were CD4+/CD8+ lymphocytes, followed by myeloid cells, NK cells and B cells (). To determine the molecular characteristics of cell subsets of the HCC TME that are related to the prognosis, we performed an analysis using the scissors algorithm. Notably, we found that some malignant tumor cells and myeloid cells in the HCC TME are related to a poor prognosis in patients. Interestingly, among prognosis-related cells, most CD8+ T cells were associated with poor survival ( and ). Recently, researchers found that tumor occurrence and progression are the results of the joint action of tumors and other nonmalignant stromal cells in the TME.Citation29 Thus, the CellChat algorithm was used to analyze and construct the possible cell communication network between various cell populations in the HCC TME (). Consistent with the abovementioned findings, cell communication levels among three subsets mainly related to a poor prognosis (CD8+ T cells, malignant tumor cells and myeloid cells) suggest that the three are closely related in terms of the number and intensity of receptor‒ligand relationships (). The presence of leukocytes called tumor infiltrating lymphocytes (TILs) in tumors is associated with better treatment outcomes for most types of cancer. CD8+ TILs can find tumor antigens on the surface of cancer cells and destroy them.Citation30 To explore this phenomenon, we extracted the most active receptor‒ligand relationship pairs between the three cell clusters (). In addition to activating MIF and CXCL signaling pathways related to macrophage and T-cell recruitment, malignant tumor cells and myeloid cells mainly induce signal activation of IL10 and TGF-β to regulate CD8+ T cells. These pathways are related to the functional depletion of CD8+ T cells.Citation31 Thus, the HCC TME contains a series of CD8+ T cells related to a poor prognosis and pathways that repress antitumor immune responses.
Figure 1 scRNA-seq profiling of the tumor ecosystem in primary HCC. (A) T-distributed stochastic neighbor embedding (t-SNE) plot showing the annotation and color codes for cell types in the HCC ecosystem. (B) The expression of marker genes in the indicated cell types. (C) The relationship between cells and the prognosis of HCC patients. Red represents poor survival, blue represents favorable survival, and gray is meaningless. (D) The proportions of prognosis-related cells in myeloid cell, malignant cell and CD8+ T-cell types. (E) The regulatory network between various groups of cells in the HCC tumor microenvironment based on the receptor ligand exchange mode. The connecting line between cell groups represents the regulatory relationship between the two cells, and the thickness of the line represents the number of receptor ligand pairs (left) and interaction intensity (right). (F) The number and intensity of regulation between receptor‒ligand pairs among cell groups. (G) The regulatory relationship of a specific signaling pathway between cell groups.
CD8+CD274+ T Cells are Related to a Poor Prognosis and Tumor Development in HCC
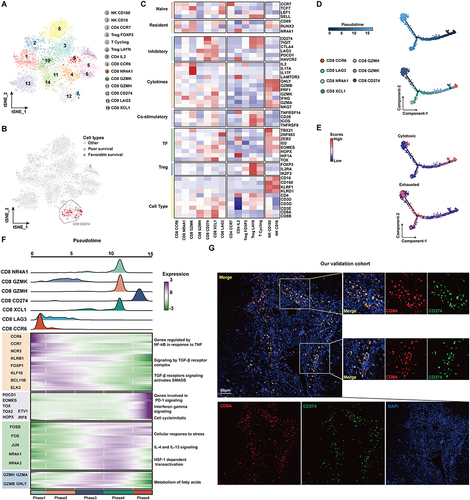
To further locate the previously identified CD8+ TIL cell subsets related to a poor prognosis, we further performed unsupervised clustering of T cells (). The reclustering of T cells revealed 14 populations, including two NK subtypes (CD16 and CD160), four subtypes of CD4+ T cells (CD4-CCR7, CD4-IL2, Treg-FOXP3, and Treg-LAYN), and seven subtypes of CD8+ T cells (CD8-CCR6, CD8-LAG3, CD8-GZMK, CD8-GZMH, CD8-CD274, CD8-XCL1, CD8-NR4A1) (). These results showed that the CD8+ T subsets associated with a poor prognosis are mainly CD8+CD274+ cells, and these cells highly express a variety of IC inhibitory molecules ( and ). Further pseudotime analysis suggested that CD8+ cells tended to change to the CD8+ CD274+ phenotype with tumor development (). Correspondingly, the cytotoxic function of CD8+ cells was gradually lost, and the cells were gradually depleted (). We next investigated the transcriptional changes associated with transitional states and observed that the CD8+ T-cell clusters could be categorized into five phase groups (). CD8+CD274+ cells were predominantly Phase 5 cells. Phase 5 was characterized by high levels of T-cell exhaustion-related TFs, including TOX, TOX2, HOPX and IRF8, and genes involved in the PD-1 and mitotic pathways, further confirming the exhausted state of these cells.Citation32 Hence, we found an exhausted CD8+ T-cell phenotype that may be related to the poor prognosis of HCC at the single-cell transcriptome level. We further confirmed its authenticity in HCC tumor tissue by using mIF staining assays (). We found that CD8+CD274+ cells appeared in the tumor tissues of patients with HCC, featured by “circles” because they are mainly expressed on the cell surface. These results suggest that this unique CD8+ T-cell type may play important roles in HCC; in particular, the exact correlation of CD8A and CD274 should be further explored.
Figure 2 The subtypes of T cells and cell transition states in primary HCC. (A) t-SNE projections of subclustered T cells, labeled in different colors. Cell type annotations are provided in the figure. (B) The expression of selected gene sets, including markers of naïve and resident cells, inhibitory molecules, cytokines, costimulatory markers, transcription factors, and cell type markers, in T-cell subtypes. (C) The t-SNE plot showing cell origins by color, showing the relationship between cells and the prognosis of HCC patients. (D) Pseudotime-ordered analysis of CD8+ T cells from primary HCC samples. (E) 2D pseudotime plot showing the dynamics of cytotoxic (upper panel) or exhausted signals (lower panel) in CD8+ T cells from primary HCC samples. (F) The dynamic changes in gene expression along with pseudotime (lower panel). The distribution of CD8 subtypes during the transition (divided into 5 phases), along with pseudotime. Subtypes are labeled by colors (upper panel). (G) Immunofluorescence images showing the colocalization of CD274 and CD8 in HCC tissue. Scale bar for all images = 50 µm.
The Prognostic Significance of CD274 is Associated with CD8A Expression in HCC
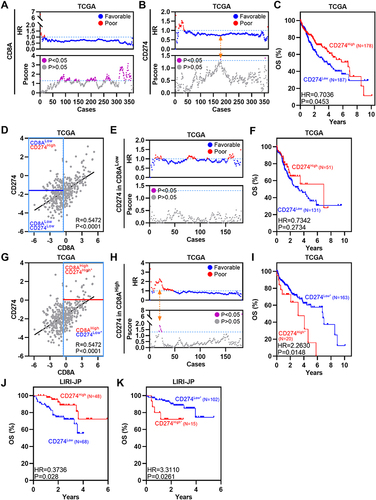
Analyses of single-cell data suggest the importance of CD8+CD274+ T cells, particularly the unique relationship between CD8A and CD274 in the TME of HCC. Previous studies have explored correlations between CD8A and macrophage-expressed CD274 in colorectal cancer (CRC).Citation5 Thus, TCGA HCC RNA-Seq and clinical data were used to assess the OS of different CRC subpopulations based on CD8A and CD274 expression. First, we divided patients into two groups based on CD8A and CD274 expression levels based on our previous TME-related studies.Citation9,Citation33 High CD8A expression was associated with favorable survival in HCC according to several peaks with optimal cutoffs of Pscore > 1.3 (equivalent to Log rank test P<0.05) (). High expression of CD274 was also associated with favorable OS in HCC according to only one peak with an optimal cutoff of Pscore > 1.3 ( and ). Then, we applied the commonly used median value to define CD8A high and low expression groups and performed survival analysis based on the optimal cutoff of CD274 expression. CD274High status was still associated with favorable survival in CD8ALow HCC, even though P > 0.05 (). However, among CD8AHigh HCC patients, the CD274High* subgroup had poorer OS than the CD274Low* subgroup (). Additional LIRI-JP HCC expression data were analyzed, and similar results were obtained ( and ). Collectively, these data indicate that CD274 expression predicts the opposite OS trend in the CD8ALow and CD8AHigh HCC groups.
Figure 3 The prognostic significance of CD274 is dependent on CD8A expression in HCC. (A) Dotplots showing HR (up) and Pscore (bottom) for different CD8A expression cutoffs in TCGA HCC patients. The dotted line represents HR = 1 (up) and Pscore= 1.3 (equivalent to P<0.05, bottom). (B) Similar to (A), but for CD274. The Orange arrow represents the optimal cutoff. (C) Kaplan–Meier plot showing the OS for CD274 in TCGA HCC patients according to the optimal cutoff. (D) Pearson correlation between CD8A and CD274 expression in TCGA HCC patients. Vertical blue lines represent the median value of CD8A. The horizontal dark blue line represents the optimal cutoff of CD274 in CD8ALow patients. (E) Similar to (A), but for CD274 in CD8ALow patients. (F) Kaplan–Meier plot showing the OS for CD274 in CD8ALow patients according to the optimal cutoff. (G–I) Similar to (D–F), but for CD274 in CD8AHigh cases. (J and K) Kaplan–Meier plots showing the OS for CD274 in CD8AHigh patients (J) or CD8ALow patients (K) in the LIRI-JP HCC cohort according to the optimal cutoff.
CD8AHighCD274High* Patients Represent a Novel High-Risk Subgroup in HCC
To validate the subtyping effect of CD8AHighCD274High* patients based on our approach in the aforementioned analyses, we identified this subgroup in the TCGA HCC, GSE76427 and LIRI-JP cohorts, and this subpopulation showed the worst survival outcomes (). Moreover, this correlation was also confirmed at the protein level by analyzing the CPTAC HCC dataset (). Hence, a unique high-risk subpopulation, CD8AHighCD274High*was identified in HCC. Moreover, GSEA was performed to determine whether the signatures associated with HCC recurrence were enriched in CD8AHighCD274High* patients. We found that the CD8AHighCD274High* subgroup was significantly correlated with increased risks of early and late recurrence in the TCGA HCC dataset (). These results demonstrated that the CD8AHighCD274High* subgroup is associated with poor survival and recurrence.
Figure 4 CD8AHighCD274High* patients represent a novel high-risk subtype in HCC. (A) Pearson correlation between CD8A and CD274 expression in TCGA HCC patients (left). Vertical blue lines represent the median value of CD8A. The horizontal dark blue line represents the optimal cutoff of CD274 in CD8AHigh patients. Kaplan–Meier plots showing the OS for each CD8A/CD274 subtype in TCGA HCC patients. (B–D) Similar to (A), but in GSE76427 (B), LIRI-JP (C) and CPTAC protein (D) HCC cohorts. (E) GSEA plots showing that the CD8AHighCD274High* subgroup was significantly correlated with a higher risk of recurrence in TCGA HCC patients. (F and G) Univariable and multivariate COX regression models showing the effect of the CD8A/CD274 stratification system, TNM stage, grade and vascular invasion indexes on OS in TCGA HCC patients. (H) Multivariate Cox regression models showing the effect of CD8A/CD274, T stage and N stage on OS (G) in TCGA HCC patients. (I) Pie charts showing the chi-squared test of clinicopathologic factors for CD8A/CD274 stratification system TNM stage, grade and vascular invasion indexes from the TCGA HCC cohort.
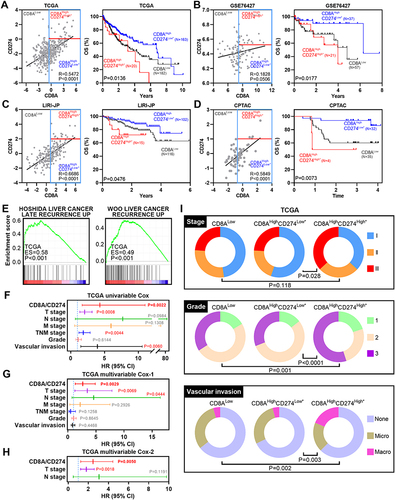
To evaluate the prognostic value of CD8A/CD274, we explored the clinical features among these subtypes in the TCGA HCC dataset. First, CD8AHighCD274High*T3+T4, tumor node metastasis (TNM) stage III+IV or vascular invasion were found to be associated with poor survival according to the univariable Cox analysis (). Then, multivariable Cox analysis revealed that CD8AHighCD274High*T3+T4 or N1 stage III+IV were associated with poor survival (). Thus, further multivariable Cox analysis was performed based on these three indexes, and CD8AHighCD274High* remained an independent prognostic factor when considering the influence of the other two indexes (). Finally, the CD8AHighCD274High* patients were observed to have a higher tumor stage, higher tumor grade and vascular invasion (such as stage III disease, grade 3 disease and macrovascular invasion) ().
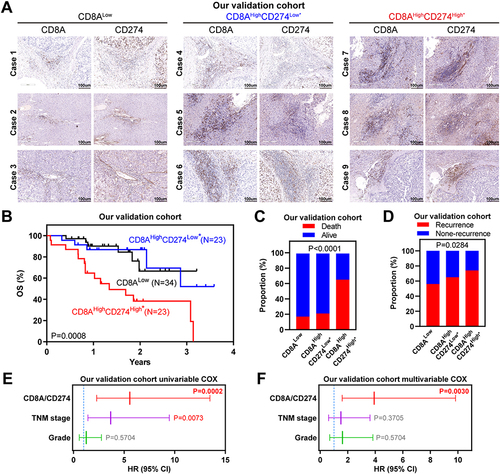
To further validate these genomic findings, primary tumor tissues were collected from 80 HCC patients at The Second Affiliated Hospital of South China University of Technology. As shown in , the CD8AHighCD274High* cases showed increased immune cell infiltration, and this phenotype indicated the worst survival outcomes and highest relapse risk, which was consistent with our observations of public HCC cohorts. Importantly, cases with CD8AHighCD274High* remained an independent prognostic factor after multivariable Cox analysis ( and ). Taken together, our analyses based on mRNA and protein expression data show that the CD8AHighCD274High* subgroup has a higher risk of poor clinical outcomes than other patients with HCC.
Figure 5 Wet-laboratory experimental validation in our independent HCC cohort. (A) IHC staining assay of each CD8A/CD274 subtype in the validation HCC cohort. Scale bar for all images = 100 µm. (B) Kaplan–Meier plots showing the OS for each CD8A/CD274 subtype in the validation HCC cohort. (C and D) Stacked bar plot showing the chi-squared test of survival (C) and recurrence (D) status for each CD8A/CD274 subgroup in the validation HCC cohort. (E and F) Univariable and multivariate COX regression models showing the effect of the CD8A/CD274 stratification system, TNM stage and grade on OS in our validation cohort.
Molecular Characteristics of the CD8AHighCD274High* Subgroup
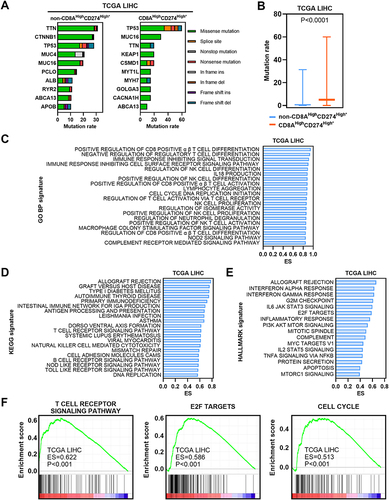
We first estimated the gene mutation rates. Missense variations were the most common mutation type in both subgroups. We found significantly higher mutation rates in the CD8AHighCD274High* subgroup than in the other patients ( and ). In particular, TP53 mutation was more common in the CD8AHighCD274High* subgroup than in the other subgroups. Next, GSEA was performed based on GO BP, KEGG and Hallmark signatures and demonstrated that immune-related pathways and cancer-related pathways were enriched in the CD8AHighCD274High* subgroup ( and ). For example, the T-cell receptor signaling pathway, E2F target and cell cycle signatures were enriched in the CD8AHighCD274High* subgroup (). These results suggest that the CD8AHighCD274High* subpopulation is characterized by an active immune response and cancer-related biological processes.
Figure 6 Molecular characteristics of the CD8AHighCD274High* subgroup. (A) Mutation profiles of the 20 most mutated genes in the CD8AHighCD274High* subgroup or non-CD8AHighCD274High* samples among TCGA HCC tumor samples. (B) Boxplot showing the mutation rate of total genes grouped by CD8AHighCD274High* and non-CD8AHighCD274High* patients from the TCGA HCC cohort. (C) Barplot showing the top 20 significantly enriched GO BP signatures in the CD8AHighCD274High* subgroup from the TCGA HCC cohort based on ES. (D) Barplot showing the top significantly enriched HALLMARK signatures in the CD8AHighCD274High* subgroup from the TCGA HCC cohort. (E) Barplot showing the top 20 significantly enriched KEGG signatures in the CD8AHighCD274High* subgroup from the TCGA HCC cohort based on ES. (F) GSEA plots showing that the CD8AHighCD274High* subgroup was significantly correlated with higher T-cell receptor signaling pathway, E2F target and cell cycle signatures in TCGA HCC patients.
The CD8AHighCD274High* High-Risk Subpopulation is Characterized by an Immune Overdrive TME Phenotype
To further investigate the immune activity level in the CD8AHighCD274High* high-risk subgroup in HCC, we first estimated the total immune infiltration level in the TCGA HCC dataset based on mRNA expression and observed the highest overall immune infiltration level in the CD8AHighCD274High* subgroup compared with other subgroups (). Then, the total immune infiltration level was estimated in the CPTAC HCC dataset based on protein expression, and similar results were observed (). Moreover, the CD8AHighCD274High* subgroup showed the highest levels of five major immune cell types: B cells, CD4+ T cells, CD8+ T cells, Tregs and macrophages (Figure S1). We next estimated tumor purity using the ESTIMATE algorithm, and the CD8AHighCD274High* subgroup had the lowest levels of tumor purity among these subgroups ( and ). These data indicate that CD8AHighCD274High* HCC is characterized by a TME with high immune cell infiltration and low tumor purity.
Figure 7 TME characteristics of the CD8AHighCD274High* subgroup. (A and B) Boxplots showing the total immune infiltrates based on ESTIMATE, CIBERSORTx, Pan-cancer immunogenomic analysis signature and TIMER for each CD8A/CD274 subtype in TCGA (a) and CPTAC protein (b) HCC cohorts. (C and D) Boxplots showing the total tumor purity based on the ESTIMATE algorithm for each CD8A/CD274 subtype in the TCGA (c) and CPTAC protein (d) HCC cohorts. (E–G) Stacked bar-plot showing the Chi-squared test of TCGA HCC subtype (e), TCGA immune subtype (f) and TCGA TME subtype (g) for each CD8A/CD274 subgroup in TCGA HCC cases. (H) Boxplots showing the levels of KEGG pathways in cancer and hallmark angiogenesis signatures for each CD8A/CD274 subtype in the TCGA HCC cohort. (I) Boxplots showing the expression of MYBL2, PLK1, and MKI67 for each CD8A/CD274 subtype in the TCGA HCC cohort. (J and K) Similar to (H), but for the KEGG JAK/STAT signaling pathway and hallmark TGF-β signaling signatures. (L) Boxplot showing the expression of ICs for each CD8A/CD274 subtype in the TCGA HCC cohort. (M) Boxplot showing the TIDE score for each CD8A/CD274 subtype in the TCGA HCC cohort (left). Stacked bar-plot showing the Chi-squared test of IC inhibitor-response status for each CD8A/CD274 subgroup in the TCGA HCC cohort (right).
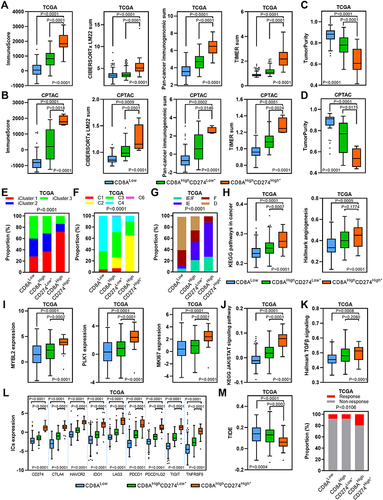
We next wondered why the CD8AHighCD274High* subgroup shows a high risk of poor clinical outcome despite high immune cell infiltration and low tumor purity. We investigated the proportions of the previously described HCC and immune subtypes in each subgroup of the CD8A/CD274 subtyping system.Citation22–24 We first analyzed the TCGA HCC subtyping system and observed that the CD8AHighCD274High* high-risk subpopulation largely overlapped with the iCluster:1 subtype (). Then, TCGA immune and TME subtypes were used, and the CD8AHighCD274High* high-risk subpopulation showed a high proportion of samples with the C2, IE/F and IE subtypes (). Interestingly, iCluster:1 cases exhibit specific features, such as high tumor grade and macrovascular invasion. We found that the CD8AHighCD274High* high-risk subpopulation demonstrated higher levels of KEGG pathways in cancer and hallmark angiogenesis signatures than the CD8AHighCD274Low* and CD8ALow subpopulations (). In addition, the iCluster:1 phenotype was associated with the upregulation of proliferation marker genes, such as MYBL2, PLK1, and MKI67. Our analyses validated that these genes were overexpressed in the CD8AHighCD274High* high-risk subpopulation (). Moreover, C2 has a strong CD8 signal and a high proliferation rate. Immunomodulator genes are most highly expressed in the C2 subtype. IE/F cases are distinguished by angiogenesis and CAF activation. IE has high levels of immune infiltration, and assessment of activated signaling pathways revealed increased JAK/STAT pathway activation, which may be associated with increased T-cell activity. Further analyses showed that the CD8AHighCD274High* high-risk subpopulation had the highest levels of the KEGG JAK/STAT signaling pathway and hallmark TGF-β signaling signature enrichment in the TCGA HCC dataset, and this population also had high expression of ICs (). The CD8AHighCD274High* high-risk subpopulation also exhibited the highest level of CAFs in the TCGA HCC cohort (Figure S2). Immunomodulators play a critical role in cancer immunotherapy, and many immunomodulator agonists and antagonists are currently being used in clinical oncology.Citation23 Notably, most of the immunomodulator genes were overexpressed in the CD8AHighCD274High* high-risk subpopulation compared with the other subgroups (Figure S3). Remarkably, the CD8AHighCD274High* high-risk subpopulation had the lowest TIDE score and a higher proportion of IC inhibitor-sensitive cases in the TCGA HCC cohort ().
Together, these results demonstrate that both immune cell infiltration and IC genes are overrepresented in the CD8AHighCD274High* high-risk subpopulation, reflecting an immune overdrive TME phenotype. Furthermore, both the JAK/STAT pathway and TGF-β signaling are active in the CD8AHighCD274High* high-risk subpopulation, reflecting a counterbalancing phenotype between immunostimulatory and immunosuppressive mechanisms.
Discussion
In this scenario, we uncovered a unique CD8AHighCD274High* subpopulation at the HCC single-cell level. This subpopulation was next identified at the tissue level and associated with poor clinical outcomes. Moreover, the CD8AHighCD274High* high-risk subpopulation featured an immune overdrive phenotype in HCC.
CD8+ T cells are characterized by CD8A gene expression, which is a cytotoxic T-cell lineage marker. The CD274 gene is located on chromosome 9p24.1 and encodes the PD-L1 protein. The critical IC PD-L1 suppresses antitumor immunity through an interaction with its receptor PD-1 on the cell membrane. The binding of PD-L1 and PD-1 results in the transmission of an inhibitory signal, which reduces the proliferation of antigen-specific T cells in lymph nodes. Blockade of the PD-L1/PD-1 interaction promotes the antitumor immune response and provides survival benefits for patients. This is a major breakthrough in cancer therapy. Interestingly, PD-L1 also has nonimmune checkpoint functions; it harbor nuclear transcriptional activity and is involved in the pyroptosis pathway.Citation34 Several studies have noted that a high CD8+ T-cell level is associated with a longer OS duration.Citation7,Citation8 Interestingly, recent studies have revealed that a series of special CD8 T-cell subpopulations were associated with poor prognosis despite high immune cell infiltration in digestive system cancers.Citation5,Citation35 However, these analyses were only performed at the tissue level. The availability of single-cell transcriptomic data provides an unprecedented opportunity to understand the TME in great depth. Through comprehensive analysis of scRNA-seq data from 12 HCC cases, we realized the comprehensive molecular characteristics of the TME of liver cancer, including malignant tumor cells and nonmalignant stromal cells. On this basis, the precise, key cell subpopulation causing the poor prognosis of HCC patients includes some malignant tumor cells and most monocytes. This finding is consistent with previous research results and demonstrates the accuracy of our analysis and methods to a certain extent.Citation36,Citation37 However, we accidentally found that some CD8+ T cells are strongly associated with a poor prognosis. Moreover, we found that CD8+ T cells gradually tended to exhibit a change in the CD8+CD274+ phenotype in the process of tumor progression based on cell communication and pseudotime analyses. The important feature of this phenotype is overexpressed multiple ICs, and this characteristic is probably related to the imbalance of IL10, TGF-β and arginine metabolic pathways mediated by tumor cells and macrophages.Citation38 Based on the mIF staining assay, we identified a T-cell phenotype with high expression of both CD8 and CD274. Previous studies have shown that CD8+CD274+ T cells have predictive value in NSCLC patients who received IC inhibitors.Citation39 Reportedly, PD-L1 molecules are expressed on a higher percentage of peripheral blood CD8+ T cells in advanced gastric cancer patients than in those of healthy controls.Citation40 In addition, chemoradiation and immunotherapy decreased the proportion of CD8+CD274+ T cells in cervical biopsy specimens.Citation41 Thus, CD8+CD274+ T cells probably have an immunosuppressive role in the TME, although CD8+ T cells are generally considered antitumor cells.Citation34 PD-L1 inhibits antitumor immunity via interaction with its receptor PD-1 membrane. Therefore, CD8+ CD274+ T cells may be adjacent to PD-1+ cells to play an immunosuppressive role.Citation42 Moreover, in our analysis at the tissue level, we found that the CD274high group was associated with favorable survival according to the best cutoff value in HCC. Only patients with CD274high* expression in the CD8Ahigh subgroup showed poor survival and high recurrence risk, indicating that the prognostic significance of CD274 is dependent on CD8A expression in HCC. These findings are consistent with the results of our single-cell level analysis and similar to those of previous TCGA-related studies of melanoma and CRC.Citation5
Based on our analyses using TCGA mRNA and CPTAC protein HCC datasets, this CD8AHighCD274High* high-risk subpopulation features a TME with high immune cell infiltration and low tumor purity, respectively. In addition, this subpopulation has higher JAK/STAT pathway activation, which may be associated with increased T-cell activity.Citation24 We wondered why this subpopulation has high immune infiltration and low tumor purity but exhibits worse clinical outcomes. The CD8AHighCD274High* high-risk subpopulation showed high expression levels of ICs, such as CD274, CTLA4, HAVCR2, IDO1, LAG3, PDCD1, PDCD1LG2, TIGIT and TNFRSF9. These ICs provide negative signals to decrease T-cell responses and limit antitumor immune responses, resulting in tumor development.Citation43 Some cell types, such as CAFs, are associated with immunosuppression and have protumorigenic and immunosuppressive properties in human cancers.Citation43 In addition, this high-risk subtype also exhibited obviously increased cancer-related biological processes, such as tumor proliferation and angiogenesis, particularly increased TGF-β signaling, which is one of the primary mechanisms mediating immune evasion.Citation44 The characteristics of this TME type in the CD8AHighCD274High* subgroup are similar to the immune overdrive phenotype described in previous studies in CRC, which involves the infiltration of CD8 T cells, macrophages expressing CD724, and Tregs overexpressing CTLA4.Citation5,Citation9 In addition, a recent study suggests that CD8+ T cells help to induce nonalcoholic steatohepatitis (HCC) rather than invigorate or execute immune surveillance.Citation45 Hence, this study suggests that relying on evaluation of a single immune marker may lead to the misclassification of risk in HCC and underscores the importance of extending the Immunoscore study.
The CD8AHighCD274High* subpopulation may provide novel guidelines for HCC patient selection in IC-related therapies. The liver is not only the largest immune organ of the body but also a well-known immune tolerance organ. The liver is exposed to foreign antigens from the gastrointestinal tract for long periods, thus forming its unique immune tolerance microenvironment.Citation46 Immunosuppressive cytokines play a key role in HCC tumor formation, progression, metastasis, immunosuppression and drug resistance. On the other hand, HCC has significant TME heterogeneity, and there is no difference in the outcomes of patients treated with PD-L1 inhibitors. Numerous PD-L1 inhibitors with low response rates are available; thus, the efficacy of PD-L1 inhibitors is not ideal. Major unmet challenges in HCC checkpoint immunotherapy include the discovery and validation of predictive biomarkers, advancing treatment to earlier stages of the disease, the application of treatment to patients with liver dysfunction and the discovery of more effective combinatorial or sequential approaches. To overcome this challenge, the body’s immune response to the tumor is stimulated, immune tolerance is weakened, and immune cells are reinvigorated to play their antitumor role. Thus, it is necessary to identify individuals likely to benefit from immunotherapy.Citation47 The CD8AHighCD274High* subgroup is characterized by high immune infiltration (such as T cells) and low tumor purity, so this subgroup represents an ideal population to target for immunotherapy. Remarkably, this subgroup showed a high expression of ICs, some of which are related to promoting tumor immune escape, such as the TGF-β pathway.Citation48 TIDE analysis also showed that the CD8AHighCD274High* subgroup had a lower TIDE score and a higher proportion of IC inhibitor-response cases. In addition, the CD8AHighCD274High* subgroup showed high levels of tumor mutations, including a high number of somatic mutations in the tumor genome of this subgroup, likely indicating the better efficacy of PD-1/PD-L1 therapy.Citation49 Interestingly, the CD8AHighCD274High* status was correlated with enhancement of angiogenesis, which plays an essential role in tumor progression. Similar to IC inhibitors, antiangiogenic agents target TME components other than tumor cells and synergize with IC inhibitors by promoting CD8+ T lymphocyte infiltration and activation. A recent study suggested that IC inhibitor- and antiangiogenesis-based neoadjuvant/conversion therapy has good efficacy and feasibility in late-stage gastric cancer.Citation50 Hence, targeting the TGF-β pathway and angiogenesis probably enhances the efficacy of IC inhibitors in CD8AHighCD274High* HCC cases.
A limitation of our study is the lack of biopsy samples from advanced HCC patients treated with IC inhibitors. We acknowledge that it is difficult to collect samples from patients treated with IC inhibitors, including HCC patients. However, the interesting aspect and strengths of this study are clear. First, the existence of the CD8AHighCD274High* subpopulation was validated in multiple HCC cohorts, including Western and Eastern HCC patient cohorts, and at both the mRNA and protein levels. This unique subpopulation exists at both the single-cell level and bulk tissue level. Importantly, this high CD8 T cell infiltration subpopulation is significantly associated with poor OS, which is considered the gold standard in terms of outcomes in clinical cancer trials. CD8A/CD274 stratification also remained an independent prognostic variable for survival after adjusting for other indexes. Moreover, the use of multiple methodologies of immune evaluation is likely to overcome potential biases and add confidence to our findings. Finally, this subtyping system only requires the examination of the expression levels of CD8A and CD274, which can be readily performed via IHC staining assay.
Conclusions
In summary, our comprehensive analyses uncovered a new CD8AHighCD274High* subpopulation that could classify patients into an immune-overdrive high-risk subgroup in HCC. Notably, the combined evaluation of CD8A and CD274 expression is a strong predictor of HCC prognosis than evaluation of either marker alone. CD8 T cells overexpressing CD274 might be used as biomarkers and therapeutic targets in HCC. HCC patients in the CD8AHighCD274High* immune-overdrive high-risk subpopulation may benefit from more active IC inhibitor-based combination treatment. This study will help in the development of related therapeutic strategies.
Abbreviations
HCC, hepatocellular carcinoma; PD-1, programmed death receptor-1; TME, tumor microenvironment; PCA, principal component analysis; PCs, principal components; CRC, colorectal cancer; MSigDB, Molecular Signatures Database; ssGSEA, single-sample gene set enrichment analysis; LM22, 22 immune cell type signature; CAF, cancer-associated fibroblasts; IHC, immunohistochemistry; mIF, multiplex immunofluorescence; OS, overall survival; t-SNE, T-distributed stochastic neighbor embedding; TILs, tumor infiltrating lymphocytes; TNM stage, tumor node metastasis stage.
Ethics Approval and Consent to Participate
HCC tissues of pathological paraffin section and medical records were obtained from those who underwent radical resection at The Second Affiliated Hospital of South China University of Technology (Guangzhou, China) between December 2016 and December 2020. All experimental procedures were approved by the Ethics Committee of The Second Affiliated Hospital of South China University of Technology (Approval number: k-2022-031-02). Written informed consent was provided by all patients before the study. We confirmed that this study was conducted in accordance with the Declaration of Helsinki.
Author Contributions
All authors made a significant contribution to the conception, study design, execution, acquisition of data, analysis and interpretation and took part in drafting and revising the article. All authors have agreed on the journal to which the article has been submitted and agree to be accountable for all aspects of the work.
Disclosure
The authors declare that they have no competing interests in this work.
Acknowledgments
We thank the TCGA, GEO, ICGC and CPTAC projects. We would like to thank the developers of each method and package. We thank Dr. Liangjie Zhang, Affiliated Hospital of Bengbu Medical College, for assisting in patient follow-up. We thank the Pathology Department of the Second Affiliated Hospital of South China University of Technology for providing wax blocks and chief physician Jing Yang for providing pathological technical guidance.
Data Sharing Statement
Available public datasets are described in Materials and Methods. The data that support this study are available from the corresponding author upon reasonable request.
Additional information
Funding
References
- Morse MA, Sun W, Kim R, et al. The role of angiogenesis in hepatocellular carcinoma. Clin Cancer Res. 2019;25(3):912–920. doi:10.1158/1078-0432.CCR-18-1254
- Zongyi Y, Xiaowu L. Immunotherapy for hepatocellular carcinoma. Cancer Lett. 2020;470:8–17. doi:10.1016/j.canlet.2019.12.002
- Yi M, Jiao D, Xu H, et al. Biomarkers for predicting efficacy of PD-1/PD-L1 inhibitors. Mol Cancer. 2018;17(1):129. doi:10.1186/s12943-018-0864-3
- Sangro B, Chan SL, Meyer T, Reig M, El-Khoueiry A, Galle PR. Diagnosis and management of toxicities of immune checkpoint inhibitors in hepatocellular carcinoma. J Hepatol. 2020;72(2):320–341. doi:10.1016/j.jhep.2019.10.021
- Fakih M, Ouyang C, Wang C, et al. Immune overdrive signature in colorectal tumor subset predicts poor clinical outcome. J Clin Invest. 2019;129(10):4464–4476. doi:10.1172/JCI127046
- Giraldo NA, Sanchez-Salas R, Peske JD, et al. The clinical role of the TME in solid cancer. Br J Cancer. 2019;120(1):45–53. doi:10.1038/s41416-018-0327-z
- Pages F, Mlecnik B, Marliot F, et al. International validation of the consensus Immunoscore for the classification of colon cancer: a prognostic and accuracy study. Lancet. 2018;391(10135):2128–2139. doi:10.1016/S0140-6736(18)30789-X
- Wang J, Li R, Cao Y, et al. Intratumoral CXCR5(+)CD8(+)T associates with favorable clinical outcomes and immunogenic contexture in gastric cancer. Nat Commun. 2021;12(1):3080. doi:10.1038/s41467-021-23356-w
- Cui K, Yao S, Zhang H, et al. Identification of an immune overdrive high-risk subpopulation with aberrant expression of FOXP3 and CTLA4 in colorectal cancer. Oncogene. 2021;40(11):2130–2145. doi:10.1038/s41388-021-01677-w
- Liu J, Lichtenberg T, Hoadley KA, et al. An integrated TCGA pan-cancer clinical data resource to drive high-quality survival outcome analytics. Cell. 2018;173(2):400–416 e11. doi:10.1016/j.cell.2018.02.052
- Satija R, Farrell JA, Gennert D, Schier AF, Regev A. Spatial reconstruction of single-cell gene expression data. Nat Biotechnol. 2015;33(5):495–502. doi:10.1038/nbt.3192
- Sun D, Guan X, Moran AE, et al. Identifying phenotype-associated subpopulations by integrating bulk and single-cell sequencing data. Nat Biotechnol. 2021. doi:10.1038/s41587-021-01091-3
- Jin S, Guerrero-Juarez CF, Zhang L, et al. Inference and analysis of cell-cell communication using CellChat. Nat Commun. 2021;12(1):1088. doi:10.1038/s41467-021-21246-9
- Qiu X, Mao Q, Tang Y, et al. Reversed graph embedding resolves complex single-cell trajectories. Nat Methods. 2017;14(10):979–982. doi:10.1038/nmeth.4402
- Mayakonda A, Lin DC, Assenov Y, Plass C, Koeffler HP. Maftools: efficient and comprehensive analysis of somatic variants in cancer. Genome Res. 2018;28(11):1747–1756. doi:10.1101/gr.239244.118
- Cui K, Liu C, Li X, Zhang Q, Li Y. Comprehensive characterization of the rRNA metabolism-related genes in human cancer. Oncogene. 2020;39(4):786–800. doi:10.1038/s41388-019-1026-9
- Hanzelmann S, Castelo R, Guinney J. GSVA: gene set variation analysis for microarray and RNA-seq data. BMC Bioinform. 2013;14:7. doi:10.1186/1471-2105-14-7
- Yoshihara K, Shahmoradgoli M, Martinez E, et al. Inferring tumour purity and stromal and immune cell admixture from expression data. Nat Commun. 2013;4:2612. doi:10.1038/ncomms3612
- Charoentong P, Finotello F, Angelova M, et al. Pan-cancer immunogenomic analyses reveal genotype-immunophenotype relationships and predictors of response to checkpoint blockade. Cell Rep. 2017;18(1):248–262. doi:10.1016/j.celrep.2016.12.019
- Newman AM, Steen CB, Liu CL, et al. Determining cell type abundance and expression from bulk tissues with digital cytometry. Nat Biotechnol. 2019;37(7):773–782. doi:10.1038/s41587-019-0114-2
- Li T, Fu J, Zeng Z, et al. TIMER2.0 for analysis of tumor-infiltrating immune cells. Nucleic Acids Res. 2020;48(W1):W509–W514. doi:10.1093/nar/gkaa407
- Ally A, Balasundaram M, Carlsen R; Cancer Genome Atlas Research Network. Comprehensive and integrative genomic characterization of hepatocellular carcinoma. Cell. 2017;169(7):1327–1341 e23. doi:10.1016/j.cell.2017.05.046
- Thorsson V, Gibbs DL, Brown SD, et al. The immune landscape of cancer. Immunity. 2018;48(4):812–830 e14. doi:10.1016/j.immuni.2018.03.023
- Bagaev A, Kotlov N, Nomie K, et al. Conserved pan-cancer microenvironment subtypes predict response to immunotherapy. Cancer Cell. 2021;39(6):845–865 e7. doi:10.1016/j.ccell.2021.04.014
- Becht E, Giraldo NA, Lacroix L, et al. Estimating the population abundance of tissue-infiltrating immune and stromal cell populations using gene expression. Genome Biol. 2016;17(1):218. doi:10.1186/s13059-016-1070-5
- Racle J, de Jonge K, Baumgaertner P, Speiser DE, Gfeller D. Simultaneous enumeration of cancer and immune cell types from bulk tumor gene expression data. Elife. 2017;6. doi:10.7554/eLife.26476
- Jiang P, Gu S, Pan D, et al. Signatures of T cell dysfunction and exclusion predict cancer immunotherapy response. Nat Med. 2018;24(10):1550–1558. doi:10.1038/s41591-018-0136-1
- Zlobec I, Terracciano L, Jass JR, Lugli A. Value of staining intensity in the interpretation of immunohistochemistry for tumor markers in colorectal cancer. Virchows Arch. 2007;451(4):763–769. doi:10.1007/s00428-007-0466-8
- Vitale I, Manic G, Coussens LM, Kroemer G, Galluzzi L. Macrophages and metabolism in the tumor microenvironment. Cell Metab. 2019;30(1):36–50. doi:10.1016/j.cmet.2019.06.001
- Lowery FJ, Krishna S, Yossef R, et al. Molecular signatures of antitumor neoantigen-reactive T cells from metastatic human cancers. Science. 2022;375(6583):877–884. doi:10.1126/science.abl5447
- Snell LM, MacLeod BL, Law JC, et al. CD8(+) T cell priming in established chronic viral infection preferentially directs differentiation of memory-like cells for sustained immunity. Immunity. 2018;49(4):678–694 e5. doi:10.1016/j.immuni.2018.08.002
- Speiser DE, Utzschneider DT, Oberle SG, Munz C, Romero P, Zehn D. T cell differentiation in chronic infection and cancer: functional adaptation or exhaustion? Nat Rev Immunol. 2014;14(11):768–774. doi:10.1038/nri3740
- Cui K, Yao S, Liu B, et al. A novel high-risk subpopulation identified by CTSL and ZBTB7B in gastric cancer. Br J Cancer. 2022;127(8):1450–1460. doi:10.1038/s41416-022-01936-x
- Hou J, Zhao R, Xia W, et al. PD-L1-mediated gasdermin C expression switches apoptosis to pyroptosis in cancer cells and facilitates tumour necrosis. Nat Cell Biol. 2020;22(10):1264–1275. doi:10.1038/s41556-020-0575-z
- Zhang R, Li T, Wang W, et al. Indoleamine 2, 3-dioxygenase 1 and CD8 expression profiling revealed an immunological subtype of colon cancer with a poor prognosis. Front Oncol. 2020;10:594098. doi:10.3389/fonc.2020.594098
- Yu M, Chen Z, Zhou Q, et al. PARG inhibition limits HCC progression and potentiates the efficacy of immune checkpoint therapy. J Hepatol. 2022;77:140–151. doi:10.1016/j.jhep.2022.01.026
- Cadoux M, Caruso S, Pham S, et al. Expression of NKG2D ligands is downregulated by beta-catenin signalling and associates with HCC aggressiveness. J Hepatol. 2021;74(6):1386–1397. doi:10.1016/j.jhep.2021.01.017
- Makarova-Rusher OV, Medina-Echeverz J, Duffy AG, Greten TF. The yin and yang of evasion and immune activation in HCC. J Hepatol. 2015;62(6):1420–1429. doi:10.1016/j.jhep.2015.02.038
- Li L, Lu G, Liu Y, et al. Low infiltration of CD8+ PD-L1+ T cells and M2 macrophages predicts improved clinical outcomes after immune checkpoint inhibitor therapy in non-small cell lung carcinoma. Front Oncol. 2021;11:658690. doi:10.3389/fonc.2021.658690
- Zgodzinski W, Grywalska E, Zinkiewicz K, et al. Peripheral blood T lymphocytes are downregulated by the PD-1/PD-L1 axis in advanced gastric cancer. Arch Med Sci. 2019;15(3):774–783. doi:10.5114/aoms.2018.75092
- Hasan Y, Furtado L, Tergas A, et al. A phase 1 trial assessing the safety and tolerability of a therapeutic DNA vaccination against HPV16 and HPV18 E6/E7 oncogenes after chemoradiation for cervical cancer. Int J Radiat Oncol Biol Phys. 2020;107(3):487–498. doi:10.1016/j.ijrobp.2020.02.031
- Diskin B, Adam S, Cassini MF, et al. PD-L1 engagement on T cells promotes self-tolerance and suppression of neighboring macrophages and effector T cells in cancer. Nat Immunol. 2020;21(4):442–454. doi:10.1038/s41590-020-0620-x
- Riera-Domingo C, Audige A, Granja S, et al. Immunity, hypoxia, and metabolism-the menage a trois of cancer: implications for immunotherapy. Physiol Rev. 2020;100(1):1–102. doi:10.1152/physrev.00018.2019
- Batlle E, Massague J. Transforming growth factor-beta signaling in immunity and cancer. Immunity. 2019;50(4):924–940. doi:10.1016/j.immuni.2019.03.024
- Pfister D, Nunez NG, Pinyol R, et al. NASH limits anti-tumour surveillance in immunotherapy-treated HCC. Nature. 2021;592(7854):450–456. doi:10.1038/s41586-021-03362-0
- McGlynn KA, Petrick JL, El-Serag HB. Epidemiology of hepatocellular carcinoma. Hepatology. 2021;73(Suppl 1):4–13. doi:10.1002/hep.31288
- Wei Y, Zhao Q, Gao Z, et al. The local immune landscape determines tumor PD-L1 heterogeneity and sensitivity to therapy. J Clin Invest. 2019;129(8):3347–3360. doi:10.1172/JCI127726
- Sangro B, Sarobe P, Hervas-Stubbs S, Melero I. Advances in immunotherapy for hepatocellular carcinoma. Nat Rev Gastroenterol Hepatol. 2021;18(8):525–543. doi:10.1038/s41575-021-00438-0
- Yarchoan M, Hopkins A, Jaffee EM. Tumor mutational burden and response rate to PD-1 inhibition. N Engl J Med. 2017;377(25):2500–2501. doi:10.1056/NEJMc1713444
- Li S, Yu W, Xie F, et al. Neoadjuvant therapy with immune checkpoint blockade, antiangiogenesis, and chemotherapy for locally advanced gastric cancer. Nat Commun. 2023;14(1):8. doi:10.1038/s41467-022-35431-x