
Abstract
Background
The nuclear pore complex (NPC) is the main mediator of nuclear and cytoplasmic communication, and delaying or blocking nuclear RNA export and protein shuttling can inhibit cell proliferation and induce apoptosis. Although NPC is a research hotspot in structural biology, relevant studies in hepatocellular carcinoma are scarce, especially in terms of translation into clinical practice.
Methods
This study used a bioinformatics approach combining validation experiments to investigate the biological mechanisms that may be related with NPC. A series of experiments performed to explore the function of the Targeting protein for Xenopus kinesin-like protein 2 (TPX2) in HCC.
Results
Patients with HCC can be divided into two NPC clusters. Patients with high NPC levels (C1) had a shorter survival time than those with low NPC levels (C2) and are characterised by high levels of proliferative signals. We demonstrated that TPX2 regulates HCC growth and inhibits apoptosis in an NPC-dependent manner and contributes to the maintenance of HCC stemness. We developed the NPCScore to predict the prognosis and degree of differentiation in HCC patients.
Conclusion
NPC plays an important role in the malignant proliferation of HCC. Assessing NPC expression patterns could help enhance our understanding of tumor cell proliferation and could guide more effective chemotherapeutic strategies.
Introduction
Hepatocellular carcinoma (HCC) is one of the most lethal cancers in the world and is the sixth most common malignancy in the world, with a very poor prognosis and no effective treatment available.Citation1,Citation2 Due to the remarkable clinical response produced by PD1 checkpoint inhibitors, oncology treatment has now fully entered the era of immunotherapy, however, immunotherapy strategies are not successful in all patients and conventional chemotherapy still has an irreplaceable position.Citation3–6 Simultaneously, even patients with similar clinical characteristics respond very differently to the same treatment strategy, this phenomenon is now thought to be explained by the heterogeneity of TME.Citation7
The nuclear pore complex (NPC) is the most versatile transport conduit in eukaryotes and plays an important role as the gatekeeper of the nuclear membrane.Citation8 NPCs have a unique lifespan of their own - they go from formation to old age and are repeatedly taken apart and reassembled in the process.Citation9,Citation10 A large body of evidence has confirmed that the life cycle of NPCs is closely related to the cell cycle,Citation11,Citation12 especially reflected in the increased number and activity of NPCs during interphase mitosis, which is accompanied by an increase in the surface area of the nuclear membrane.Citation13 Although NPC is known as one of the two “holy grails” of structural biology, its role in the development of cancer is poorly understood. Benefiting from the remarkable cell fate determining function of NPC, a small number of studies have begun to explore its potential as a new strategy for the treatment of malignant tumors. A previous study showed that targeting nuclear inputs regulated by NPC can prevent cancer-promoting molecules from reaching the nucleus to inhibit tumor growth.Citation14 Considering that the atomic resolution crystal structure of NPC has now been resolved, it is extremely promising to advance the research of NPC into clinical translation and even the development of specific drugs.Citation9,Citation15,Citation16
In this study, we analyzed the gene expression heterogeneity of 30 NPC molecules at the pan-cancer level and the results showed that DNA methylation and copy number variation affect the expression of NPC molecules. We jointly analyzed information from multiple sources of datasets to correlate NPC with tumor stemness and malignant proliferation, and identified TPX2 as an important upstream regulator. We developed a scoring system, called NPCScore, to quantify NPC level in HCC. A prognostic prediction model was built based on NPCScore to integrate NPC with clinical practice and is of great clinical importance.
Materials and Methods
Public Datasets
We collected the RNA-seq and corresponding clinicopathological data from 374 hepatocellular carcinoma (LIHC) patients and 50 healthy controls from the The Cancer Genome Atlas (TCGA) database.Citation17 The external validation information was acquired from the International Cancer Genome Consortium (ICGC) database (LIRI - JP, n = 240).Citation18 All single-cellular RNA (scRNA) information was acquired from a prior investigation involving hepatocellular carcinoma (HCC).Citation19 All gene expression profiles were downloaded from the aforementioned sources using R, and we prepared a data matrix for additional analyses. Moreover, The Cancer Genome Atlas TCGA-LIHC-based analysis was partly carried out using the Gene Set Cancer Analysis (GSCA) web tool.Citation20
Consensus Clustering
We complied a summary of The Human Genome Organization (HUGO) portal-derived data on nuclear pore complex (NPC) molecules,Citation20 namely, AAAS, AHCTF1, GLE1, NDC1, NUP35, NUP37, NUP43, NUP50, NUP54, NUP58, NUP62, NUP85, NUP88, NUP93, NUP98, NUP107, NUP133, NUP153, NUP155, NUP160, NUP188, NUP205, NUP210, NUP214, RANBP2, POM121, RAE1, SEC13, SEH1L, and TPR. Using the expression profiles of the 30 aforementioned NPC molecules, we next performed clustering analysis to screen for NPC phenotypes that are associated with HCC in an attempt to stratify HCC patients. We next established the most ideal clustering quantity of the LIHC-cohort using the consensus clustering algorithm, and validated its stability. We employed the R package “ConsensusClusterPlus” for all analyses and the entire procedure was replicated in 50 repetitions with 80% resampling rate.Citation21
NPCScore Assessment
Using the principal components analysis (PCA) (orthogonal rotation)Citation22 technique in the “IOBR” package, we next generated scores to assess the amount of 30 NPC molecules within HCC patients. This scoring system was termed as the NPCScore,Citation23 and it employed the following formula: NPCScore = ∑(PC1+PC2). We examined distributional patterns in various HCC subtypes, and validated the prognostic predictability of the NPCScore among HCC patients using the “timeROC” and “ggplot2” packages.
Screening of HCC-Related Differentially Expressed Genes (DEGs)
We identified HCC-related DEGs using the “Limma” packageCitation22 and the following significance criteria: P value <0.05 and absolute log2 fold change (FC) >2. Significant DEGs were further evaluated in subsequent analyses.
Functional Enrichment Analysis (FEA)
We utilized METASCAPE to carry out Gene Ontology (GO)Citation24 and Kyoto Encyclopedia of Genes and Genomes (KEGG) enrichmentCitation25 analyses.Citation26 Subsequently, we performed gene set enrichment analysis (GSEA) via the “clusterProfiler” package to identify strongly enriched signaling networks.Citation27 The HALLMARK and c2.cp.v7.2 gene set data resource from the Molecular Signatures Database-MsigDB (www.broadinstitute.org/gsea/msigdb) served as the background set. Significance was based off of a P value < 0.05. Finally, we conducted Gene set variation analysis (GSVA) using the “Limma” package in R to screen for DE genetic profiles between C1 and C2.Citation28
Assessment of Drug Responsiveness
We employed the largest open-access pharmacogenomics database, Genomics of Drug Sensitivity in Cancer (GDSC, https://www.cancerrxgene.org/) and the GSCA web tool to estimate the chemotherapeutic drug responsiveness of HCC patients.Citation29
Immunologic Evaluation
Employing the “IOBR” package, we next computed the TCGA-LIHC sample immune cell invasion predictions using algorithms, such as, TIMER,Citation30 QUANTISEQ,Citation31 XCELL,Citation32 and EPIC.Citation33 Subsequently, using the “pheatmap” R package, we generated heat maps that demonstrated differences in the immune cell abundance profiles.Citation34 We also determined the tumor immune dysfunction and exclusion (TIDE) score, which indicated the blockade response of the potential immune checkpoint (ICB) among HCC patients.Citation35 Lastly, we employed the “IOBR” package-based gene sets to assess the varying physiological signal scores present within TCGA-LIHC samples, and compared the differences in distribution patterns present within distinct NPC subtypes using the Welch’s t-test.
Establishment of Co-Expression Axes
To elucidate the co-expression axis, we utilized the “multiscale embedded gene co-expression network analysis (MEGENA)” package in R.Citation36 MEGENA, a recently developed co-expression module assessment tool possess novel benefits for the effective establishment of large-scale co-expression plane filtering axes and gene association preservation. The first step to MEGENA analysis is the generation of a fast planar filtered network (PFN). This is followed up by the computational recognition of relevant PFN gene pairs, then the accumulation of generated PFNs for multiscale clustering analysis (MCA), among other analyses. The largest co-expression network-based gene module was converted into a readable document using Cytoscape to aid in visualization and final evaluation.Citation37 Finally, we also recorded the degree values to stratify module genes for potential hub gene identification.
Expression and Survival Analyses
Mortality assessment utilized the public dataset and the “survival” package in R. The evaluation included progression-free interval (PFI), overall survival (OS) and disease-specific survival (DSS). Additionally, we employed the paired t-test to assess TCGA-LIHC differences among paired samples, and utilized the “ggplot2” package for result visualization.
LASSO and Cox Regression
The least absolute shrinkage and selection operator (LASSO) analysis was conducted using “glmnet” in R to screen for relevant genomic variables. We employed both uni- and multivariate Cox regression analyses to assess the stand-alone prognostic predictability of NPC molecules.Citation38 Lastly, result visualization was done via R using forest plot, and included hazard ratios (HRs), P-values, and 95% confidence intervals (CIs) for all variables.
scRNA Analysis
The scRNA Sequencing (scRNA-seq) information was collected from the Gene Expression Omnibus (GEO) database.Citation39 All data were entered into Seurat V3Citation40 and filtered cell assessment was done via Uniform Manifold Approximation and Projection (UMAP) following stringent quality regulation involving raw unique molecular identifier (UMI) > 200, mitochondrial genes percentage < 20%, and log10 Gene per nUMI > 0.8).Citation41 Subsequently, hepatocytes were delineated from all other cells using manual annotation. All cell type marker genes were assessed based on adjustments to the “FindAllMarkers” functions (min.pct=0.25, logfc.threshold=1, tes.use=“wilcox”). Lastly, the “Dotplot” and “Vlnplot” functions were employed for generation of dot and violin plots. Cell-cell crosstalk was estimated using CellPhoneDB and the metabolic profiles of 1824 hepatocytes, generated by SCMetabolism. The TME differentiation was mapped out with Monocle3 to establish marked translational associations among various cell types. The differentiation potential of 1824 hepatocytes was established using CytoTRACE. Strongly altered genes were recognized with the “Track genes” function in Monocle 3 using q value < 0.01.
Participant Selection Criteria and Sample Acquisition
This work received ethical approval from Zhangjiagang TCM Hospital Affiliated to Nanjing University of Chinese Medicine (approval number: 2022–03-14). Patient data was randomized and anonymized before analyses. Frozen samples were acquired, and maintained in liquid nitrogen. The following patients were included for analysis: (1) Those with first time HCC diagnosis via pathology. (2) Those admitted to the Zhangjiagang TCM Hospital Affiliated to Nanjing University of Chinese Medicine between 2022–04-01 and 2023–01-01, and had available pathological specimens for stand-alone re-diagnosis by two separate physicians. (3) Availability of complete clinical data. The following patients were excluded from analysis: (1) Those with a tumor metastasis to the liver. (2) Those with any other serious chronic disease or other visceral tumor. (3) The unavailability of complete clinical information. In all, we analyzed 40 HCC patients.
Reagents
All employed antibodies and reagents are listed in Supplementary Table 1. Antibody dilutions were made either following prior reports or directions from provider.
Lentiviral Vector Generation and Cellular Incorporation
Lentiviral vectors were employed for both TPX2 overexpression and knock down experiments. The GeneChem Corporation conceived, synthesized, and distributed the viruses. Cellular incorporation was done as directed by provider. In short, both HuH-7 and Li-7 cells underwent a 24 h recombinant lentiviral transduction via 2 μg/mL polybrene, and stably incorporated cells were identified with 1.5 μg/mL puromycin. Lastly, Western blot assays were used to determine TPX2 overexpression and knockdown incorporation efficiencies, as well as outcomes.
RNAi Plasmid Generation and Cellular Incorporation
GeneChem (Shanghai, China) synthesized all plasmids. From three distinct NUP98 and NUP153 short hairpin interfering RNAs (sh-iRNAs), we selected the ones with the largest inhibition efficiency for further analyses. Next, we incorporated si-NUP98, si-NUP153, or negative control (NC) plasmid into HuH-7 and Li-7 cells at 70% confluency using Lipofectamine 3000, as directed in kit protocols.
Cell Culture
Human HCC HuH-7 and Li-7 cells were acquired from Wuhan Pu-nuo-sai Life Technology Co. Ltd. (Wuhan, China), and were maintained in Dulbecco’s modified Eagle’s medium (DMEM) containing 10% fetal bovine serum (FBS) at 37°C in a 5% CO2 humid incubator.
CCK8 Assay
We employed the CCK8 kit and its associated directions for the cell viability assay. In short, 5×10³ HCC cells were seeded in 100 μL of culture medium in 96-well plates for 12, 24, 48 h at 37°C. At the end of the specified duration, 100 μL CCK-8 solution was introduced to cells for 2 h, followed by another incubation over 12, 24, and 48 h, prior to optical density (OD) assessment at 450 nm using a microplate reader (BioTek Synergy HT).
Colony Formation Assays
We seeded 500 HCC cells in 6-well plate, followed by incubation over approximately 14 days, prior to a 10-min 0.5% crystal violet colony staining at room temperature (RT, 20–25°C) and counting under a stereomicroscope.
TUNEL Staining
We utilized the TUNEL apoptosis detection kit to assess cell apoptosis. TUNEL positive (red) and negative (blue) staining was evaluated under a fluorescence microscope (Olympus CKX-41, Japan) (×200 magnification).
Sphere Production
Sphere forming abilities were assessed, as reported in a prior investigation.Citation42 In short, 5 × 10³cells/well were seeded in 6-well ultralow attachment plates, followed by a 7-day incubation in serum-free medium with human recombinant fibroblast growth factor (FGF) (20 ng/mL), human recombinant epidermal growth factor (EGF) (20 ng/mL), and 2% B27. The sphere quantity and size were assessed under a light microscopy (Olympus BX53, Japan).
Immunohistochemical (IHC) and Immunofluorescence (IF) Staining
The protocols for IHC and IF stainings were adopted from previous investigations,Citation43,Citation44 and the employed antibodies are presented in Supplemental Table 1. Antibody final concentrations were either according to prior research or provider recommendations. Following tissue section blocking with protein blocking solution, slides underwent incubation in primary antibody. The IHV scoring (staining intensity and extent) was conducted by two independent researchers. Image capture was done using a NIKON Eclipse Ni-E microscope (NIKON, Japan), and the stain grading was performed as follows: 0, negative; 1, weak; 2, moderate; and 3, strong. The staining extent was graded dependent on the amount of positive vs negative cells in each specimen: 0, no positive staining; 1 <10% positive staining; 2, 10–50% positive staining; and 3, >50% positive staining. The IHC score (H-SCORE) integrating the amount of stained cells and staining intensity, was computed as follows: H-SCORE= ∑(PI × I) = (percentage of cells with weak intensity × 1) + (percentage of cells with moderate intensity × 2) + (percentage of cells with strong intensity × 3). Herein, PI referred to the percentage of positive cells to the entire quantity of cells in a given field of view, and I represented staining intensity. The H-SCORE ranged between 0–300, with a higher score denoting enhanced positive staining.Citation45
Tissue sections were blocked with either 5% bovine serum albumin in phosphate-buffered saline (PBS) or in 0.1% Tween, prior to a overnight treatment in 4 °C with primary antibody, and subsequent treatment with secondary antibodies in 25 °C for 1hour. A 3-min nuclear staining was conducted without light with 4’,6-diamidino-2-phenylindole (DAPI). Then, sections underwent a 5-min PBS-rinse four separate times, followed by sealing with a solution containing a IF quencher. IF staining observation and image capture was done via an inverted IF Olympus CKX-41 microscope (Japan).
Statistical Analysis
Spearman correlation coefficients assessed potential links between variables. The Welch’s T-Test was employed for statistical significance prediction of data with normal distribution, and the Mann–Whitney U-test (otherwise called Wilcoxon rank sum test) was employed for assessment of data with non-normal distribution. Inter- and multi-group comparisons were done with Kruskal–Wallis and one-way ANOVA analyses, respectively. The log-rank (Mantel-Cox) test was utilized for statistical difference determination. The hazard ratios were calculated using a univariate Cox proportional hazard regression model. All data were analyzed using used R (https://www.r-project.org/), and a two-tailed P value < 0.05 was set as the significance standard.
Results
Genetic Characteristics and Transcriptional Variations of 30 NPC Members
We downloaded data on 30 NPC member molecules from The Human Genome Organization (HUGO) portal. The 30 molecules are AAAS, AHCTF1, GLE1, NDC1, NUP35, NUP37, NUP43, NUP50, NUP54, NUP58, NUP62, NUP85, NUP88, NUP93, NUP98, NUP107, NUP133, NUP153, NUP155, NUP160, NUP188, NUP205, NUP210, NUP214, RANBP2, POM121, RAE1, SEC13, SEH1L, and TPR. The basic biological functions of NPCs are shown in . TCGA pan-cancer based data showed that out of 1900 samples (each with at least one mutation in 30 NPC molecules), 1400 carried NPC mutations with a frequency of 73.68%. Among them, RANBP2 had the highest mutation frequency (19%), followed by TPR (14%) and AHCTF1 (14%), with missense mutations being the most common type. Cutaneous melanoma (TCGA-SKCM) has the highest mutation frequency among all cancer types (). Considering that only 14 cancer types had paired normal and tumor samples, we compared the transcriptome level differences of NPC molecules only in these 14 cancer types, and the results showed that several genes including NUP210, NUP155, NUP107, and NUP62 were highly expressed in several cancer tissues (). Since dysregulation of gene expression in cancer is often due to genomic alterations, we examined whether factors including copy number variant (CNV) and DNA methylation can influence NPC molecules expression levels ( and ). The results showed that CNV and mRNA were positively correlated in almost all cancer types, especially GLE1, while the degree of DNA methylation was negatively correlated with mRNA levels in most tumors, especially NUP43.
Figure 1 Continued.
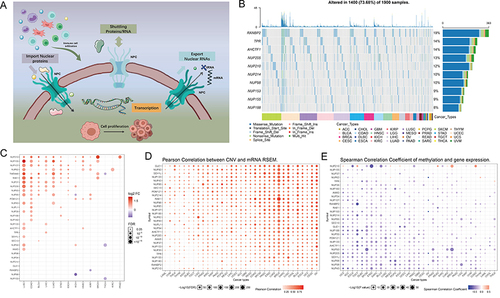
Figure 1 Expression variation of the nuclear pore complex (NPC) molecules. (A) The pattern map to show the NPC regulation mechanism of molecules between the nucleoplasm and cytoplasm and its potentially important regulatory role in the tumor immune microenvironment (TME). (B) The waterfall diagram shows the somatic mutations of the 10 NPC molecules with the highest mutation frequency using pan-cancer analysis. 73.68% is the proportion of 1900 samples with at least one mutation of the top 10 genes among 1900 samples with at least one mutation of 30 NPC genes. The percentage figure of each line on the right of the picture is the number of samples with the corresponding gene mutation divided by 1900 samples with at least one mutation among the 30 NPC molecules. (C) The color of the dots represents the degree of variance. Redder dots represent higher expression in cancer tissue. Bluer dots represent higher expression in normal tissue. The fold change equals mean (Tumor) / mean (Normal), p-value was used, t-test and p-value was adjusted by FDR. The size of the bubbles indicates the FDR. Larger bubbles represent a lower FDR. The genes with fold change (Fold change >2) and significance (FDR> 0.05) were retained to produce the figures. If there is no significant gene in one cancer type, the cancer type is omitted in the final figure. (D) The bubble chart shows the correlation between copy number variant (CNV) and mRNA expression level. Red indicates positive correlation; blue indicates negative correlation. The deeper color indicates a larger correlation index. The bubble size indicates the FDR. (E) The bubble chart shows the correlation between methylation of the 30 NPC-related molecules and mRNA expression. Red shows a positive correlation and blue shows a negative correlation. The darker color indicates a larger correlation index. Bubble size indicates the FDR. (F) Mutation characteristics of the 30 NPC-related molecules in 374 patients with hepatocellular carcinomas in the TCGA-LIHC cohort; green indicates co-mutation, brown indicates mutex-mutation. (G) Mutation frequency of 30 NPC-related molecules in 374 patients with Hepatocellular carcinoma in the TCGA-LIHC cohort. Each column represents an individual patient. The small figure above shows the tumor mutation burden (TMB), the number on the right shows the mutation frequency of each regulator. (H and I) Correlation between expression levels of 30 NPC molecules, red represents positive correlation, blue represents negative correlation, and shades of yellow indicates the P values. [Spearman method, (F) The Cancer Genome Atlas (TCGA)-LIHC, n =374; (G) International Cancer Genome Consortium (ICGC), n = 240]. (J) Least absolute shrinkage and selection operator (LASSO) model fitting. Each curve represents a gene. The profiles of coefficients were plotted versus log(λ). Vertical lines indicate the positions of seven genes with coefficients greater than 0 determined by 10-fold cross-validation. λ was determined from 10-fold cross-validation. The x-axis represents log(λ); the y-axis represents binomial deviance. Optimal values calculated from minimum criteria and one standard error of the criteria are indicated by the dotted vertical lines. (K) Univariate Forest plot showing association between 6 candidate genes expression and overall survival (OS) in TCGA-LIHC. *P <0.01, •P <0.05.
![Figure 1 Expression variation of the nuclear pore complex (NPC) molecules. (A) The pattern map to show the NPC regulation mechanism of molecules between the nucleoplasm and cytoplasm and its potentially important regulatory role in the tumor immune microenvironment (TME). (B) The waterfall diagram shows the somatic mutations of the 10 NPC molecules with the highest mutation frequency using pan-cancer analysis. 73.68% is the proportion of 1900 samples with at least one mutation of the top 10 genes among 1900 samples with at least one mutation of 30 NPC genes. The percentage figure of each line on the right of the picture is the number of samples with the corresponding gene mutation divided by 1900 samples with at least one mutation among the 30 NPC molecules. (C) The color of the dots represents the degree of variance. Redder dots represent higher expression in cancer tissue. Bluer dots represent higher expression in normal tissue. The fold change equals mean (Tumor) / mean (Normal), p-value was used, t-test and p-value was adjusted by FDR. The size of the bubbles indicates the FDR. Larger bubbles represent a lower FDR. The genes with fold change (Fold change >2) and significance (FDR> 0.05) were retained to produce the figures. If there is no significant gene in one cancer type, the cancer type is omitted in the final figure. (D) The bubble chart shows the correlation between copy number variant (CNV) and mRNA expression level. Red indicates positive correlation; blue indicates negative correlation. The deeper color indicates a larger correlation index. The bubble size indicates the FDR. (E) The bubble chart shows the correlation between methylation of the 30 NPC-related molecules and mRNA expression. Red shows a positive correlation and blue shows a negative correlation. The darker color indicates a larger correlation index. Bubble size indicates the FDR. (F) Mutation characteristics of the 30 NPC-related molecules in 374 patients with hepatocellular carcinomas in the TCGA-LIHC cohort; green indicates co-mutation, brown indicates mutex-mutation. (G) Mutation frequency of 30 NPC-related molecules in 374 patients with Hepatocellular carcinoma in the TCGA-LIHC cohort. Each column represents an individual patient. The small figure above shows the tumor mutation burden (TMB), the number on the right shows the mutation frequency of each regulator. (H and I) Correlation between expression levels of 30 NPC molecules, red represents positive correlation, blue represents negative correlation, and shades of yellow indicates the P values. [Spearman method, (F) The Cancer Genome Atlas (TCGA)-LIHC, n =374; (G) International Cancer Genome Consortium (ICGC), n = 240]. (J) Least absolute shrinkage and selection operator (LASSO) model fitting. Each curve represents a gene. The profiles of coefficients were plotted versus log(λ). Vertical lines indicate the positions of seven genes with coefficients greater than 0 determined by 10-fold cross-validation. λ was determined from 10-fold cross-validation. The x-axis represents log(λ); the y-axis represents binomial deviance. Optimal values calculated from minimum criteria and one standard error of the criteria are indicated by the dotted vertical lines. (K) Univariate Forest plot showing association between 6 candidate genes expression and overall survival (OS) in TCGA-LIHC. *P <0.01, •P <0.05.](/cms/asset/4855b169-9d79-49f8-b18b-733afb75241a/djhc_a_12158543_f0001b_c.jpg)
The attention was next focused on the HCC. Notably, with the exception of the NUP205 and SEC13 mutations, we found little significant mutational co-occurrence among NPC molecules (), suggesting that the mutational events of most NPC molecules are independent of each other without interactions. Among all NPC molecules, RANBP2 had the highest mutation frequency, mainly missense mutations (). Both The Cancer Genome Atlas (TCGA)-Liver hepatocellular carcinoma (LIHC) and International Cancer Genome Consortium (ICGC)-based data showed a broad positive correlation between NPC molecules ( and ). In order to avoid the interference caused by multicollinearity in the COX model, we screened seven genes by LASSO regression (), and subsequent univariate COX regression indicated that NDC1, NUP43, NUP155, NUP205, REAE1, SEC13 were unfavorable factors for prognosis of HCC patients (). Together, these results provide the landscape of NPC in TCGA pan-cancer cohorts.
Two Different NPC Subtypes Characterized by Unsupervised Clustering
To comprehensively understand the regulatory patterns of NPCs in HCC, we identified two clusters, named cluster 1 (C1) and cluster 2 (C2), based on the expression profiles of NPC members ( and ). Figure S1 showed that we can obtain the satisfactory clustering effect when k = 2. Principal components analysis (PCA) showed that C1 and C2 had distinct NPC expression patterns (). We noted that NPC level was significantly higher in C1 than in C2 and that patients with C1 had a worse prognosis, including overall survival (OS), disease-specific survival (DSS), and progression-free interval (PFI), compared to C2 ( and , P < 0.05). And, a higher proportion of patients with progressive HCC were found in C1 compared with pathological stage; more patients with poorly differentiated carcinoma were found in C1 compared with tumor grade (). The same process was then carried out in the ICGC data (), and similar results were found. These results suggest that the expression pattern of NPC correlates significantly with the clinical characteristics of HCC patients.
Figure 2 Continued.
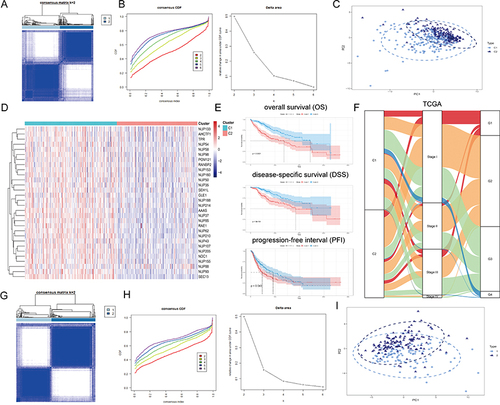
Figure 2 Unsupervised Machine Learning algorithms have been used to identify 2 molecular subtypes. (A) The consensus score matrix of all samples when k = 2. The higher the consensus score was, the more likely they were assigned to the same group based on TCGA-LIHC. (B) Left: The cumulative distribution function (CDF) curves in consensus cluster analysis. CDF curves of consensus scores by different subtype numbers (k = 2, 3, 4, 5, and 6) were displayed. Right: Relative change in area under the CDF curve for k = 2–6. (C) The Principal Component Analysis (PCA) distribution of TCGA-LIHC samples by expression profile of calcium channel molecules. Each point represents a single sample; different colors represent the C1 and C2 subtypes respectively. (D) Expression distribution of 30 NPC molecules between two subtypes based on TCGA. (E) Survival analysis including Overall Survival (OS), Disease-Specific Survival (DSS) and Progression-Free interval (PFI) based on 2 subtypes (TCGA-LIHC, Logrank test, n = 374). (F) The Sankey diagram fully demonstrated the association between Clinicopathological and subtypes attributes. (G) The consensus score matrix of all samples when k = 2. The higher the consensus score was, the more likely they were assigned to the same group based on ICGC. (H) Left: The cumulative distribution function (CDF) curves in consensus cluster analysis. CDF curves of consensus scores by different subtype numbers (k = 2, 3, 4, 5, and 6) were displayed. Right: Relative change in area under the CDF curve for k = 2–6. (I) The Principal Component Analysis (PCA) distribution of ICGC samples by expression profile of NPC-related molecules. Each point represents a single sample; different colors represent the C1 and C2 subtypes respectively. (J) Expression distribution of 30 NPC molecules between two subtypes based on ICGC. (K) Survival analysis including Overall Survival (OS) based on two subtypes (ICGC, Logrank test, n = 240). (L) The Sankey diagram fully demonstrated the association between Clinicopathological and subtypes attributes based on ICGC.
Characteristics of Tumor Immune Microenvironment (TME) Cell Infiltration in Different NPC Subtypes
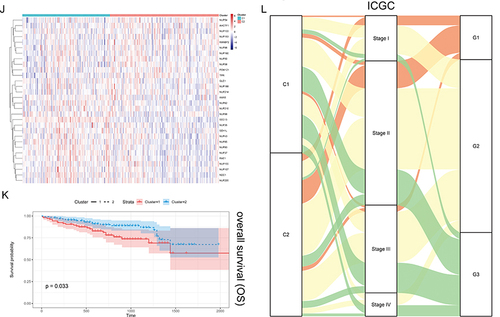
As the immune microenvironment is a current research hotspot, we analyzed here the effect of NPC on immune infiltration characteristics. We noted that the average levels of chemokines, interleukins, interferons, and other cytokines were generally higher in C1 than in C2 (), suggesting that C1 may have a stronger antigen-presenting capacity and higher levels of immune cells. Then we conducted Quantiseq, Timer, Mcp_counter and EPIC algorithms to assess the abundance of immune cells in TCGA-LIHC (). Interestingly, the activity of antitumor immune cells, such as CD8+ T cells, cytotoxic lymphocytes, NK cells, and myeloid dendritic cells, was significantly higher in C1 than in C2. In pathological sections, we found that the tumor tissue of patient C1 exhibited more apparent cytologic atypia compared to patient C2, suggesting a high degree of malignancy (). We further compared the differences in gene set scores between the 2 subtypes including immune checkpoints, antigen processing mechanisms, and cell proliferation signaling. On the one hand, cell division and proliferation scores including mismatch repair, DNA replication, and nucleotide excision repair were significantly enriched in C1 ( and Figure S2A, P < 0.05), and on the other hand, Tumor immune dysfunction and exclusion (TIDE) score was higher in C1 than in C2, implying that patients in C1 were more difficult to benefit from immunotherapy ( and Figure S2B, P < 0.05).
Figure 3 Variations in immune-related genes and the infiltration characteristics of TME cells in the 2 NPC phenotypes. (A) The thermogram shows variations in mRNA expression of chemokines, interferons, interleukins, and other cytokines between the 2 levels of NPCs. (B) The thermogram shows the frequency of TME infiltrating cells and immune score in 2 NPC phenotypes. (C) Representative pictures of pathological Hematoxylin-eosin (HE) staining of 2 NPCs phenotypes (Magnification, ×100, scale bars = 100 μm; Magnification, ×400, scale bars = 20 μm). (D) The violin plots specifically showed the TME related scores of different NPC patterns (Welch’s t-test). (E) The violin plots specifically showed the differences in 2 NPC phenotypes in terms of immune cell infiltration level, stromal cell content, and tumor purity (Welch’s t-test).
Biological Signaling Differences Between Two NPC Subtypes
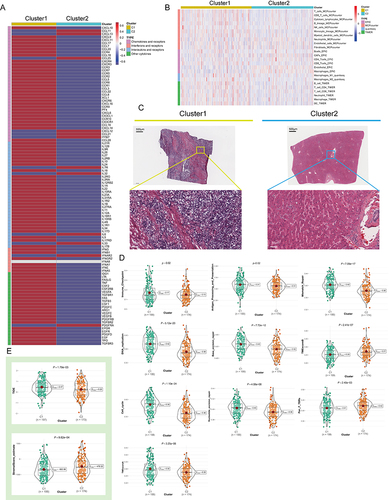
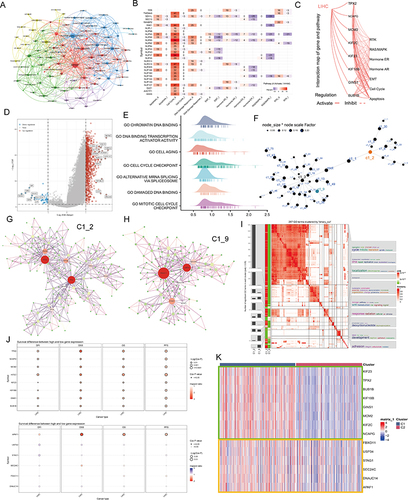
The above results implied that C1 was characterized by high levels of proliferation, and here we further analyzed the genes differentially expressed between NPC subtypes and explore the possible biological mechanisms. Word cloud analysis revealed a complex cross-linkage between NPC and cancer (). At the pan-cancer level, the vast majority of NPC molecules exhibit consistent activation of the cell cycle (). Specifically in HCC, most NPC molecules activate cell cycle and Epithelial-mesenchymal transition (EMT) signaling pathways, but inhibit hormone ER/EA, RAS/MAPK and RTK signaling pathways (). Notably, NPC molecules levels are negatively associated with IC50 levels for most drugs except selumetinib, Trametinib, RDEA119, and PD-0325901 (Figure S3). We subsequently obtained differently expressed genes (DEGs) between C1 and C2 (), and gene set enrichment analysis (GSEA) as well as Gene Set Variation Analysis (GSVA) showed that cell cycle and mitosis-related signals were highly activated in C1 ( and Figure S4A). To identify reliable regulatory modules in HCC, we constructed a Multiscale Embedded Gene Co-Expression Network Analysis (MEGENA) network based on the above DEGs (). Information about modules was listed in Supplementary Table 2. The whole network contains 47 modules, of which the two largest gene modules are C1_2 containing 188 genes () and C1_9 containing 127 genes (), respectively. Interestingly, C1_2 was highly correlated with cell mitotic cycle signaling and, C1_9 was enriched in cell adhesion (). Compared to C1_9, all hub genes in C1_2 were significantly associated with poor prognosis of HCC patients (, Logrank test, P < 0.05) and highly expressed in C1 (). The hub genes in C1_2 but not C1_9 showed a consistent expression change trend in different pathological stages of HCC (Figure S4B and C). The results reveal a potential pathogenic mechanism for NPC in HCC.
Figure 4 Analysis of NPC-related signal pathways. (A) Word cloud for the frequency of NPC-related research. (B) The heatmap shows the correlation between the expression level of the 30 NPC molecules in important cancer signaling pathways. The global percentage of cancers in which a gene has an effect on the pathway among the 32 cancers types, is shown as the percentage: (number of activated or inhibited cancer types/32 *100%). Heatmap shows NPC molecules that have a function (inhibit or activate) in at least 5 cancer types. “Pathway activate” (red) represents the percentage of cancers in which a pathway may be activated by given genes, inhibition in a similar way shown as “pathway inhibit” (blue). (C) The correlation between the 30 NPC molecules in Hepatocellular carcinoma (HCC) and important cancer signaling pathways. The solid line represents activation and the dashed line represents inhibition. (D) Expression difference analyses between the two subtypes were performed with the “limma” R package based on TCGA-LIHC, and a volcano plot was constructed. Blue, genes highly expressed in C2; Red, genes highly expressed in C1; Grey, genes with no statistical difference in expression level. (E) The mountain graph shows the differences in HCC characteristic pathway scores in the 2 NPC subtypes. (F) The co-expression network based on Multiscale Embedded Gene Co-Expression Network Analysis (MEGENA). Each node represents a module, with the larger nodes indicating a higher number of genes. The two largest gene modules are marked in Orange (C1_2) and blue (C1_9), respectively. (G and H) The MEGENA network showing the top two gene module. The darker the color and the larger the size, the more important it is in the network, the more important it is in the network, and the darker the color of the line, the greater the weight value between the nodes. (I) The signaling pathways involved in C1_2 and C1_9 were enriched using the “simplifyEnrichment” package. The bar chart on the left shows the degree of enrichment of different GO terms in different modules, the heat map in the middle shows the clustering of 287 GO terms, and the word cloud on the right summarizes the important GO terms. The redder the color, the higher the similarity between GO terms and the smaller the P-value. (J) Survival analysis of the hub genes in C1_2 (upper part) and C1_9 (lower part) in TCGA-LIHC. Red dots represent HR > 1. Blue dots represent HR < 1. Black circles indicate statistically significant (P < 0.05) and larger circles represent smaller P values. (K) The expression level of 14 modular hub genes is significantly different in 2 NPCs subtypes.
Characterization of Hub Genes at the Single-Cell Level
Considering that the hub genes may be the key factors contributing to the biological differences between different NPC subtypes, we utilized a single-cell RNA sequence of HCC. The process of single-cell analysis is shown in using a Uniform Manifold Approximation and a Projection (UMAP). We then manually annotated each cluster according to the expression of known marker genes and the annotation information from data source ( and Figure S5A-C), with a bubble blot displaying the marker genes for each cell type (). The bubble blot indicated that the hub gene in C1_2 is consistently up-regulated in hepatocytes, whereas the hub gene in C1_9 is widely expressed in all cell types (). We then performed clustering analysis for all hepatocytes and identified six prominent cell subgroups (). All hepatocytes were defined as malignant cell based on the tissue origin (). Interestingly, Cluster 1 highly expressed the hub genes which were obtained in C1_2, but these genes were rarely detected in other clusters (). Considering the strong heterogeneity of primary HCC, we speculate that Cluster 1 may have some unique properties.
Figure 5 Single cell analysis. (A) Cells were clustered into 23 types via Uniform Manifold Approximation and Projection (UMAP) plot dimensionality reduction algorithm, each color represents a unique cluster. (B) 6 cell types were identified with its unique gene marker in UMAP dimensionality reduction analysis. (C) Bubble plot demonstrating each cell type and its gene marker. The bubble color represents the average expression and the bubble size represents the percent expression. (D) Bubble plot demonstrating expression of the hub genes in C1_2 (the upper part) and C1_9 (the lower part). The bubble color represents the average expression and the bubble size represents the percent expression. (E) Hepatocyte are distinguished from all other cells based on UMAP dimensionality reduction analysis. (F) UMAP dimensionality reduction analysis demonstrating the tissue origin of hepatocytes. Red for the adjacent liver, blue for the tumor. (G) Bubble plot demonstrating expression of the hub genes in C1_2 in 1824 hepatocytes. The bubble color represents the average expression and the bubble size represents the percent expression. (H) Heatmap demonstrating the feature genes of each cell cluster. (I) tSNE demonstrating the degree of differentiation of each hepatocyte cluster assessed by CytoTRACE. (J) Box plot showing the differentiation score of each hepatocyte cluster. (K) Up-regulated HALLMARK pathways in Cluster 1. Different gene sets are represented by lines of different colors, and up-regulated genes are located on the left approaching the origin of the coordinates, while the down-regulated genes are on the right of the x-axis. Only gene sets with NOM p < 0.01 and FDR q < 0.06 were considered significant. The top 5 gene sets are displayed in the plot. (L and M) UMAP (L) and violin (M) plots showing the expression of NPC feature in 1824 hepatocytes, respectively. For UMAP, each point corresponds to a hepatocyte and is color-coded to reflect density. (N) Box plot showing the difference in tumor stemness measured by mRNAsi between the two NPC subtypes of TCGA-LIHC. (O and P) Correlation between TPX2 (O), NPC (P) levels and mRNAsi (TCGA-LIHC, Spearman method). (Q) Monocle 3 pseudotime analysis for 1824 hepatocytes. (R) Cell cycle phase projected onto the UMAP. Approximately, 0.5p is associated with the beginning of S phase, p with the beginning of G2M phase, 1.5p with the middle of M phase, and 1.75p-0.25p with G1/G0 phase. (S) Bar chart on the left showing the relative percentage of cells in different phases across different cell clusters. The x axis represents the proportion of cells in different phases, while the y axis represents the identified six clusters. Bar chart on the right showing the relative number of cells in each cluster. (T) Circle plot showing the potential ligand-receptor pairs between cluster 1/other cluster hepatocytes and other type cells (predicted by CellphoneDB). **P < 0.01.
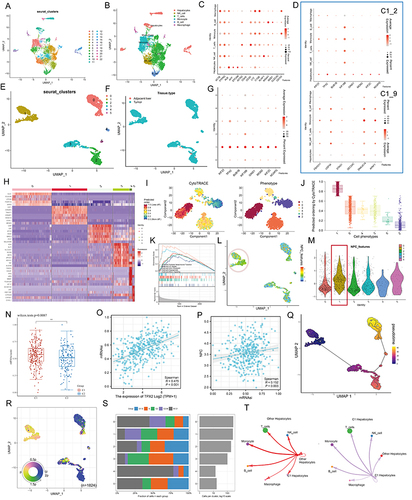
By comparing gene expression profiles (), we found that Cluster 1 is a new cell subpopulation with different molecular characteristics compared to Cluster 0/ Cluster 2/ Cluster 3/ Cluster 4/ Cluster 5. The former highly expresses CST1, CRABP1/2, TWIST1, HOXA10, UCHL1, which have been reported to be closely associated with tumor cell stemness characteristics. This result seems to imply that Cluster 1 is a subpopulation of tumor cells in a stem cell state and with stem cell characteristics. To verify this inference, we performed CytoTRACE analysis on all malignant hepatocytes and found that the CytoTRACE score of C1 was significantly higher than other clusters, indicating that C1 was in the undifferentiated stage ( and ). To further decipher the molecular function characteristics of C1, we performed GSEA. Compared with Cluster 0/ Cluster 2/ Cluster 3/ Cluster 4/ Cluster 5, Cluster 1 was enriched for signaling pathways such as epithelial mesenchymal transition, E2F targets, G2m checkpoint, Angiogenesis, and Mtorc1 signaling (). It is well established that, EMT can lead to the acquisition of a cancer stem cell (CSC) phenotype that is associated with undifferentiated cancer cell-related behavior.Citation46,Citation47 Notably, we found that ALB, a classical tumor suppressor,Citation48 was barely expressed in Cluster 1, while Ki67, a classical indicator of tumor proliferation,Citation49 was highly expressed in Cluster 1 (Figure S6A). More interestingly, we analyzed the metabolic profile of each cluster, where Cluster 1 had a significant hypometabolic profile, indicating a quiescent state (Figure S6B). At the bulk data level, a close correlation between the hub genes and NPC members has been demonstrated, so we next examined the association between the two in single-cell data. UMAP and violin plots indicated that NPC members featured by NPC related genes are upregulated in Cluster 1 ( and , Pink circles and red boxes, respectively). It has been shown that TPX2 interacts with lamina-associated polypeptide 2 (LAP2) to control nucleus assembly, suggesting a potential link between the former and NPC.Citation50 In our data, TPX2 had the largest degree value, so we focused on TPX2. Our calculations showed that the levels of either TPX2 (R = 0.475, P < 0.001) or NPC (defined by the average expression level of 30 NPC members, R = 0.152, P = 0.003) were positively correlated with the stemness index (mRNAsi), indicating the important role of both in the CSC phenotype ( and ).
Next, we performed cell trajectory analysis using Monocle3 to further explore the potential transition between different malignant hepatocyte types. The pseudotime trajectory axis shows that Cluster 1 can transdifferentiate to Cluster 2 and then to Cluster 0 (). The pseudotime dynamic expression trends of specific representative genes are shown in Figure S7. We also determined the cell cycle phase each cell was in based on tricycle analysis toolkit (), and interestingly, Cluster 1 contained the highest proportion of G2M stage cells (), and the HPA data also indicated that the hub genes in C1_2 were highly expressed at the G2 stage (Figure S8; left, protein level; right, RNA level). Finally, using CellChat, we found strong interactions between both Cluster 1 and other clusters with immune cells (). These results indicate that there is a strong relationship among C1_2, NPC and tumor stem cells.
TPX2 Can Alter the Proliferation Behavior and Stemness Characteristic of Tumor Cells by Regulating the Level of NPC
Here, we sought to confirm the functional link between TPX2 and NPC in vitro. Multiplex immunofluorescence results based on HEL and Rh30 cells showed that TPX2 was mainly located in the nucleus (, data from HPA database). Considering that TPX2 has been widely shown to be a key factor in mitosis and spindle assembly, we calculated and found a high correlation between TPX2 and the proliferative index Ki67 at the transcriptomic level (; TCGA, R = 0.920, P < 0.001; ICGC, R = 0.894, P < 0.001), and subsequently confirmed this result at the protein level in a small cohort (, n = 40, R = 0.325, P = 0.041). The word cloud analysis shows that NUP98 and NUP153 are the high-frequency objects of NPC-related studies in recent years (), so we choose these two for the next experiments. We selected HuH-7 and Li-7 cell lines as the next experimental vectors based on the CCLE data and Western blot results ( and Figure S9).
Figure 6 TPX2 can alter the proliferation behavior and stemness characteristic of tumor cells by regulating the level of NPC. (A) Multiplex immunofluorescence demonstrating the subcellular distribution of TPX2 protein in cell line sections (HPA database). (B) Correlation analysis of the TPX2 expression levels with MKI67 based on TCGA, ICGC datasets and our own samples. Matched HCC tissue sections of adjacent slides were displayed to prove the correlation of TPX2 and Ki-67 expression. The correlation analysis was based on immunohistochemical H-score (n = 40) (Magnification: ×400, scale bars = 50 μm; Spearman correlation coefficient). All the IHC scores were repeated three times using a double-blind method. Statistical analysis All experiments were repeated at least three times, independently. (C) The word cloud (left) and histogram (right) show the frequency of NPC members in PUBMED over the past five years. (D) TPX2 expression in different HCC cell lines based on the Cancer Cell Line Encyclopedia (CCLE). See also Figure S8. (E and F) Cell proliferation and Clone formation in HCC cell (HuH-7 and Li-7) transfected with the NC, sh-TPX2, oe-TPX2, oe-TPX2+si-NUP98, oe-TPX2+si-NUP153 constructs (Magnification: ×1). All experiments were repeated at least three times, independently. (G) Single staining technique by TUNEL, and DAPI staining in the Li-7 and HuH-7 cells. Representative images of TUNEL staining; red cells indicate TUNEL‐positive cells. All experiments were repeated at least three times, independently (Magnification: ×400, scale bars = 20 μm). (H and I) Sphere-forming assay of cells (magnification, × 100, scale bars = 100 μm). All experiments were repeated at least three times, independently. (J) Immunofluorescence analysis reveals colocalization of NUP98, NUP153 and TPX2 in HCC tissue. All experiments were repeated at least three times, independently (Magnification: ×400, scale bars = 20 μm). **P < 0.01, ***P < 0.001, ****P < 0.0001.
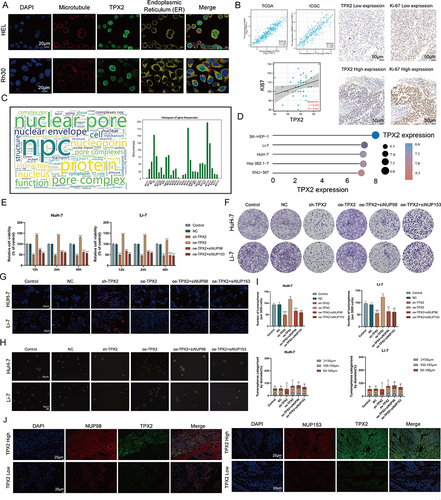
Figure 7 Clinical significance of NPCScore. (A and B) The violin plots show the NPCScore in 2 different NPC subtypes. The line in the box represents the mean value (A) based on TCGA-LIHC; (B) based on ICGC). (C and D) The Kaplan-Meier curve shows a significant difference in the survival rate between high and low NPCScore groups. (C) TCGA-LIHC, logrank test, n = 374; (D) ICGC, logrank test, n = 240). (E and F) The Sankey diagram shows the correlation between NPCScore and HCC Clinicopathological classifications (E) based on TCGA-LIHC; (F) based on ICGC). (G) The bubble chart shows the correlation between the NPCScore and the level of immune cell infiltration. The color indicates the P-value. The bubble size indicates the degree of correlation; with larger bubbles indicating a stronger correlation. (H) The chart shows the correlation between the NPCScore and TME score. Purple cube indicates a positive correlation, green cube indicates a negative correlation, and color depth and cube size represent the strength of the correlation. The darker color indicates a larger volume and a higher positive correlation. (I) Image representing the pathological HE staining variation between the high and low NPCScore groups (Magnification, ×100, scale bars = 100 μm; Magnification, ×400, scale bars = 20 μm). (J) The distribution of OS in the TCGA (left) and ICGC (right) cohort. (K) The predictive value of the NPCScore was evaluated using time-dependent Receiver operating characteristic (ROC) curve analysis within 1 and 3 years.
Overexpression of TPX2 promotes cell proliferation, clone formation and inhibits apoptosis in HCC cells, and this effect can be attenuated by si-NPC98/153 (). Similar phenomena was also observed in sphere-forming experiments ( and ), suggesting that TPX2 is able to regulate tumor stemness via NPC. Finally, we confirmed on clinical samples that the levels of TPX2 were upregulated in regions with high expression of NUP98 and NUP153 (). The results indicate that TPX2 can alter the proliferation behavior and stemness characteristic of tumor cells by regulating the level of NPC.
Clinical Value of NPCScore
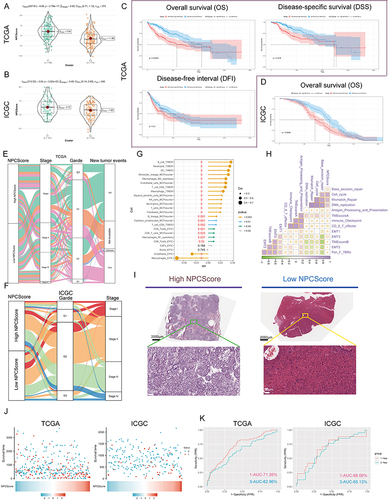
The above results suggested that NPC level was closely related to the clinical characteristics and tumor proliferation capacity of HCC patients. To be able to quantify the activity of NPCs, we developed a scoring model called NPCScore based on the level of NPC membership. By comparing the NPCScore levels between the two clusters, we found that the NPCScore was higher in C1 than in C2 based on TCGA-LIHC (, P = 2.79e-17) and ICGC (, P = 2.62e-03). We then assigned HCC patients to the high NPCScore and low NPCScore groups based on median NPCScre levels and compared survival differences between the two groups. Log rank test indicated that NPCScore was an unfavorable prognostic factor for HCC patients, including OS (TCGA, P = 0.0023; ICGC, P = 0.0064) and DSS (TCGA, P = 0.018) ( and ). Further analysis showed that the high NPCScore group had more poorly differentiated types, and consistent results were obtained in TCGA () and ICGC (). In TCGA-LIHC data, NPCScore was positively correlated with the infiltration level of most immune cells, but negatively correlated with endothelial cells (EPIC) and macrophages (EPIC) (). More notably, NPCScore was significantly and positively correlated with three cell proliferation signals, including “Cell_cycle”, “Mismatch_repair”, and “DNA_replication” (). This further reinforces the understanding that NPC level positively regulates cell division. Histopathological sections confirmed that the high NPCScore group showed high proportion of nuclear atypia (), which may be due to the out-of-control mitosis. Finally, we divided the HCC cases into high-risk and low-risk groups based on the median of NPCScore. showed the distribution of OS-related prediction models for patients in the TCGA (left) and ICGC (right) datasets. showed the Receiving Operating Characteristics (ROC) curves of the 1-year and 3-year OS-related predictive signals with AUCs of 0.7126 and 0.6296 in TCGA-LIHC and 0.6806 and 0.6513 in ICGC.
Discussion
The nuclear pore complex, a multiprotein channel located in a fusion pore between the outer nuclear membrane (ONM) and the inner membrane (INM) of the nuclear membrane (NE), not only acts as a cellular channel to transport molecules across the nuclear membrane into the genome, but also performs a variety of non-transport related functions.Citation51–54 The structure and number of NPCs are tightly regulated throughout the cell cycle, and there is solid evidence that alterations in NPCs are strongly associated with malignant transformation and tumor progression.Citation14,Citation55,Citation56 An important function of the NPCs is the export of mRNA, which means that it acts as a regulatory step allowing only specific mRNAs to enter the cytoplasm to control their translation into proteins subsequently involved in the cellular signaling cascade.Citation57,Citation58
It is clear that in any case cell proliferation is dependent on NPC assembly.Citation59 The work of Schuller et al confirmed that purification of the nuclear membrane affects NPC structure, which demonstrates the remarkable plasticity of NPCs, implying that the cellular environment has a considerable influence on the dimensions and structure of NPCs.Citation60 Given the high molecular level heterogeneity of tumors, it is tempting to think that differential NPC level could be one of the potential factors involved in heterogeneity, especially with respect to cell proliferation and death.Citation61,Citation62 Under this hypothesis, we pooled 30 NPC members and defined 2 types of NPC subtypes with different clinical outcomes and pathological characteristics in HCC based on their expression profiles. Early evidence suggests that structural and functional changes in NPC are required for a specific immune response,Citation63 and our results suggest that immune activity is significantly higher in C1 than in C2. Notably, C1 is predominantly characterized by high levels of NPC, suggesting that overexpression of NPC could actively modulate the immune response in TME.
We noted that biological signals including “mismatch_repair”, “DNA_replication”, and “cell_cycle” are highly activated in C1. It is known that NPCs-based substance delivery is significantly activated when cells are in a rapid proliferation phase, so we speculate that the essential features of C1 may be reflected in more “gates” being opened. To further examine the potential biological significance of NPCs, we obtained genes that were significantly differentially expressed in C1 and C2, and GSEA showed that they were closely associated with DNA replication. We then constructed the MEGENA network and identified the 2 largest gene modules, where C1_2 is mainly involved in cell division related biological signalling and C1_9 is mainly involved in cell adhesion related pathway. All hub genes in C1_2 are strongly associated with poor prognosis in HCC patients and are significantly upregulated in HCC tissues, implying that C1_2 is the main mechanism linking NPC to HCC pathogenesis. Among them, the kinesin family, which plays a role in intracellular transport of chromosomes along microtubules during mitosis and is responsible for positioning of different cellular components to specific sites, has now been shown to be associated with poor prognosis in a variety of cancers.Citation64–67 In addition to this, TPX2, a key factor in mitosis and spindle assembly, and BUB1B, part of the mitotic checkpoint complex, as well as NCAPG, an oncogene capable of regulating DNA location on the chromosome, have been abundantly reported to be positively associated with S-phase cell cycle arrest, proliferation and migration in several tumors.Citation68–72 In conclusion, this partial result suggested that the poor prognosis of C1 may be due to the highly active NPCs triggering the malignant proliferation of tumor cells.
Single-cell analysis showed that the hub genes were restrictedly expressed in tumor stem cells and that levels of NPC were significantly higher in tumor stem cells than in other tumor cell populations. Based on available reports and our results, we focused on TPX2 in HCC. Stem cell index (mRNAsi) analysis based on mRNA expression showed that TPX2 was significantly associated with the stem cell features of tumors. It has been shown that NUP98 can form a complex with the transcription factor P65 to regulate the transcription of homologous recombination pathway genes to maintain Glioblastoma stem cells (GSCs) proliferation and tumorigenesis.Citation73 We subsequently demonstrated experimentally that TPX2 regulates the proliferation and apoptosis of HCC cells through an NPC-dependent pathway and enhances the tumor stemness of HCC. These results further deepen the understanding of the relationship between NPCs and tumor malignant phenotypes.
The above results suggested that NPCs had an important regulatory role in tumor cell proliferation and have potential stratification value, so it is necessary to classify the expression of NPCs members in tumor patients. For this purpose, a scoring system, NPCScore, was developed to measure the level of NPC in HCC patients. Survival analysis and prognostic models confirmed that the NPCScore can be used to effectively assess prognosis. Interestingly, NPCScore was positively correlated with immune activity, which we speculate may be due to the immune response caused by highly active tumor cell proliferation. Previous studies have demonstrated that blocking the synthesis of NPCs selectively causes cancer cell death, stops tumor growth and induces tumor regression, suggesting great promise for NPCs in chemotherapy.Citation14,Citation74 Our study showed that NPCScore is highly positively correlated with cell cycle, DNA replication, and mismatch repair, and that the levels of NPCs members are negatively correlated with the IC50 of most chemotherapeutic drugs, thus NPCScore can effectively guide the use of chemotherapeutic drugs. NPCScore can be used to determine the proliferative phenotype of HCC patients and to predict the prognosis of patients and the potentially suitable chemotherapy modality.
We acknowledge some of the limitations of this study, particularly in terms of insufficient sample size, and that further collection of additional clinical samples for protein sequencing is necessary to enhance the validation of the stratification of NPCs in HCC patients. In addition, although NPCs continue to be a hot topic in biology, research in oncology is still insufficient, and there is a particular lack of clinical translation-related results. Now that the protein structure of NPCs has been progressively characterized, more combined basic and clinical studies are needed to advance NPCs to the stage of clinical application and drug development, which would benefit patients tremendously, especially in the prevention of chemotherapy resistance.
Ethics and Sample Collection
The study was approved by Zhangjiagang TCM Hospital Affiliated to Nanjing University of Chinese Medicine, Ethics and Research Committee (approval number: 2022-03-14) and was conducted in accordance with the Declaration of Helsinki. Every patient was asked for signed informed consent.
Disclosure
The authors declare no conflicts of interest in this work.
Acknowledgments
We thank the TCGA and ICGC databases for permitting the authors to use the data.
Data Sharing Statement
We declare that all the data in this article are authentic, valid, and available for use on reasonable request. All the data supporting this study are available from the corresponding author Prof. Yong-hua Zhang ([email protected]).
Additional information
Funding
References
- Piñero F, Dirchwolf M, Pessôa MG. Biomarkers in hepatocellular carcinoma: diagnosis, prognosis and treatment response assessment. Cells. 2020;9:6. doi:10.3390/cells9061370
- Schafer DF, Sorrell MF. Hepatocellular carcinoma. Lancet. 1999;353(9160):1253–1257. doi:10.1016/S0140-6736(98)09148-X
- Johnston MP, Khakoo SI. Immunotherapy for hepatocellular carcinoma: current and future. World J Gastroenterol. 2019;25(24):2977–2989. doi:10.3748/wjg.v25.i24.2977
- Sangro B, Sarobe P, Hervás-Stubbs S, et al. Advances in immunotherapy for hepatocellular carcinoma. Nat Rev Gastroenterol Hepatol. 2021;18(8):525–543. doi:10.1038/s41575-021-00438-0
- Ikeda M, Morizane C, Ueno M, et al. Chemotherapy for hepatocellular carcinoma: current status and future perspectives. Jpn J Clin Oncol. 2018;48(2):103–114. doi:10.1093/jjco/hyx180
- Gong J, Chuang J, Cho M, et al. Molecular targets, pathways, and therapeutic implications for hepatocellular carcinoma. Int J Mol Sci. 2020;21(15):5232. doi:10.3390/ijms21155232
- Hu C, Xin Z, Sun X, et al. Activation of ACLY by SEC63 deploys metabolic reprogramming to facilitate hepatocellular carcinoma metastasis upon endoplasmic reticulum stress. J Exp Clin Cancer Res. 2023;42(1):108. doi:10.1186/s13046-023-02656-7
- Sumner MC, Brickner J. The nuclear pore complex as a transcription regulator. Cold Spring Harb Perspect Biol. 2022;14(1):a039438. doi:10.1101/cshperspect.a039438
- Akey CW, Singh D, Ouch C, et al. Comprehensive structure and functional adaptations of the yeast nuclear pore complex. Cell. 2022;185(2):361–378.e25. doi:10.1016/j.cell.2021.12.015
- Fernandez-Martinez J, Rout MP. Nuclear pore complex biogenesis. Curr Opin Cell Biol. 2009;21(4):603–612. doi:10.1016/j.ceb.2009.05.001
- Antonin W, Ellenberg J, Dultz E. Nuclear pore complex assembly through the cell cycle: regulation and membrane organization. FEBS Lett. 2008;582(14):2004–2016. doi:10.1016/j.febslet.2008.02.067
- Imamoto N, Funakoshi T. Nuclear pore dynamics during the cell cycle. Curr Opin Cell Biol. 2012;24(4):453–459. doi:10.1016/j.ceb.2012.06.004
- Wente SR, Rout MP. The nuclear pore complex and nuclear transport. Cold Spring Harb Perspect Biol. 2010;2(10):a000562. doi:10.1101/cshperspect.a000562
- Sakuma S, Raices M, Borlido J, et al. Inhibition of nuclear pore complex formation selectively induces cancer cell death. Cancer Discov. 2021;11(1):176–193. doi:10.1158/2159-8290.CD-20-0581
- Lin DH, Hoelz A. The structure of the nuclear pore complex (An Update). Annu Rev Biochem. 2019;88:725–783. doi:10.1146/annurev-biochem-062917-011901
- Hampoelz B, Andres-Pons A, Kastritis P, et al. Structure and assembly of the nuclear pore complex. Annu Rev Biophys. 2019;48:515–536. doi:10.1146/annurev-biophys-052118-115308
- Wang Z, Jensen MA, Zenklusen JC. A practical guide to the cancer genome atlas (TCGA). Methods Mol Biol. 2016;1418:111–141.
- Zhang J, Baran J, Cros A, et al. International cancer genome consortium data portal--a one-stop shop for cancer genomics data. Database. 2011;2011:bar026. doi:10.1093/database/bar026
- Sun Y, Wu L, Zhong Y, et al. Single-cell landscape of the ecosystem in early-relapse hepatocellular carcinoma. Cell. 2021;184(2):404–421.e16. doi:10.1016/j.cell.2020.11.041
- Ji Z, Vokes SA, Dang CV, et al. Turning publicly available gene expression data into discoveries using gene set context analysis. Nucleic Acids Res. 2016;44(1):e8. doi:10.1093/nar/gkv873
- Wilkerson MD, Hayes DN. ConsensusClusterPlus: a class discovery tool with confidence assessments and item tracking. Bioinformatics. 2010;26(12):1572–1573. doi:10.1093/bioinformatics/btq170
- Ritchie ME, Phipson B, Wu D, et al. limma powers differential expression analyses for RNA-sequencing and microarray studies. Nucleic Acids Res. 2015;43(7):e47. doi:10.1093/nar/gkv007
- Zeng D, Ye Z, Shen R, et al. IOBR: multi-omics immuno-oncology biological research to decode tumor microenvironment and signatures. Front Immunol. 2021;12:687975. doi:10.3389/fimmu.2021.687975
- Collaborators. Gene ontology consortium: going forward. Nucleic Acids Res. 2015;43:D1049–56. doi:10.1093/nar/gku1179
- Kanehisa M, Goto S. KEGG: Kyoto encyclopedia of genes and genomes. Nucleic Acids Res. 2000;28(1):27–30. doi:10.1093/nar/28.1.27
- Zhou Y, Zhou B, Pache L, et al. Metascape provides a biologist-oriented resource for the analysis of systems-level datasets. Nat Commun. 2019;10(1):1523. doi:10.1038/s41467-019-09234-6
- Subramanian A, Kuehn H, Gould J, et al. GSEA-P: a desktop application for gene set enrichment analysis. Bioinformatics. 2007;23(23):3251–3253. doi:10.1093/bioinformatics/btm369
- Gong J, Li R, Chen Y, et al. HCC subtypes based on the activity changes of immunologic and hallmark gene sets in tumor and nontumor tissues. Brief Bioinform. 2021;22(5). doi:10.1093/bib/bbaa427
- Yang W, Soares J, Greninger P, et al. Genomics of drug sensitivity in cancer (GDSC): a resource for therapeutic biomarker discovery in cancer cells. Nucleic Acids Res. 2013;41:D955–61. doi:10.1093/nar/gks1111
- Li T, Fan J, Wang B, et al. TIMER: a web server for comprehensive analysis of tumor-infiltrating immune cells. Cancer Res. 2017;77(21):e108–e110. doi:10.1158/0008-5472.CAN-17-0307
- Plattner C, Finotello F, Rieder D. Deconvoluting tumor-infiltrating immune cells from RNA-seq data using quanTIseq. Methods Enzymol. 2020;636:261–285.
- Aran D. Cell-type enrichment analysis of bulk transcriptomes using xCell. Methods Mol Biol. 2020;2120:263–276.
- Zheng H, Liu H, Ge Y, et al. Integrated single-cell and bulk RNA sequencing analysis identifies a cancer associated fibroblast-related signature for predicting prognosis and therapeutic responses in colorectal cancer. Cancer Cell Int. 2021;21(1):552. doi:10.1186/s12935-021-02252-9
- Zhang MY, Huo C, Liu J-Y, et al. Identification of a five autophagy subtype-related gene expression pattern for improving the prognosis of lung adenocarcinoma. Front Cell Dev Biol. 2021;9:756911. doi:10.3389/fcell.2021.756911
- Ding C, Shan Z, Li M, et al. Characterization of the fatty acid metabolism in colorectal cancer to guide clinical therapy. Mol Ther Oncolytics. 2021;20:532–544. doi:10.1016/j.omto.2021.02.010
- Wang Y, Yi N, Hu Y, et al. Molecular signatures and networks of cardiomyocyte differentiation in humans and mice. Mol Ther Nucleic Acids. 2020;21:696–711. doi:10.1016/j.omtn.2020.07.011
- Shannon P, Markiel A, Ozier O, et al. Cytoscape: a software environment for integrated models of biomolecular interaction networks. Genome Res. 2003;13(11):2498–2504. doi:10.1101/gr.1239303
- Liang JY, Wang D-S, Lin H-C, et al. A novel ferroptosis-related gene signature for overall survival prediction in patients with hepatocellular carcinoma. Int J Biol Sci. 2020;16(13):2430–2441. doi:10.7150/ijbs.45050
- Clough E, Barrett T. The gene expression omnibus database. Methods Mol Biol. 2016;1418:93–110.
- Ionkina AA, Balderrama-Gutierrez G, Ibanez KJ, et al. Transcriptome analysis of heterogeneity in mouse model of metastatic breast cancer. Breast Cancer Res. 2021;23(1):93. doi:10.1186/s13058-021-01468-x
- Huo L, Jiao Li J, Chen L, et al. Single-cell multi-omics sequencing: application trends, COVID-19, data analysis issues and prospects. Brief Bioinform. 2021;22(6). doi:10.1093/bib/bbab229
- Yao J, Yang J, Yang Z, et al. FBXW11 contributes to stem-cell-like features and liver metastasis through regulating HIC1-mediated SIRT1 transcription in colorectal cancer. Cell Death Dis. 2021;12(10):930. doi:10.1038/s41419-021-04185-7
- Magaki S, Hojat SA, Wei B, So A, Yong WH. An introduction to the performance of immunohistochemistry. Methods Mol Biol. 2019;1897:289–298.
- Im K, Mareninov S, Diaz MF, et al. An introduction to performing immunofluorescence staining. Methods Mol Biol. 2019;1897:299–311.
- Yang Y, Xiao M, Song Y, et al. H-score of 11β-hydroxylase and aldosterone synthase in the histopathological diagnosis of adrenocortical tumors. Endocrine. 2019;65(3):683–691. doi:10.1007/s12020-019-02022-8
- Babaei G, Aziz SG, Jaghi NZZ. EMT, cancer stem cells and autophagy; The three main axes of metastasis. Bio Pharmaco. 2021;133:110909. doi:10.1016/j.biopha.2020.110909
- Zhou P, Li B, Liu F, et al. The epithelial to mesenchymal transition (EMT) and cancer stem cells: implication for treatment resistance in pancreatic cancer. Mol Cancer. 2017;16(1):52. doi:10.1186/s12943-017-0624-9
- Lei J, Wang Y, Guo X, et al. Low preoperative serum ALB level is independently associated with poor overall survival in endometrial cancer patients. Future Oncol. 2020;16(8):307–316. doi:10.2217/fon-2019-0732
- Juríková M, Danihel Ľ, Polák Š, et al. Ki67, PCNA, and MCM proteins: markers of proliferation in the diagnosis of breast cancer. Acta Histochem. 2016;118(5):544–552. doi:10.1016/j.acthis.2016.05.002
- O’Brien LL, Wiese C. TPX2 is required for postmitotic nuclear assembly in cell-free Xenopus laevis egg extracts. J Cell Biol. 2006;173(5):685–694. doi:10.1083/jcb.200512107
- Beck M, Hurt E. The nuclear pore complex: understanding its function through structural insight. Nat Rev Mol Cell Biol. 2017;18(2):73–89. doi:10.1038/nrm.2016.147
- Grossman E, Medalia O, Zwerger M. Functional architecture of the nuclear pore complex. Annu Rev Biophys. 2012;41:557–584. doi:10.1146/annurev-biophys-050511-102328
- Sun J, Shi Y, Yildirim E. The nuclear pore complex in cell type-specific chromatin structure and gene regulation. Trends Genet. 2019;35(8):579–588. doi:10.1016/j.tig.2019.05.006
- Raices M, D’Angelo MA. Nuclear pore complexes and regulation of gene expression. Curr Opin Cell Biol. 2017;46:26–32. doi:10.1016/j.ceb.2016.12.006
- Makhnevych T, Lusk CP, Anderson AM, et al. Cell cycle regulated transport controlled by alterations in the nuclear pore complex. Cell. 2003;115(7):813–823. doi:10.1016/S0092-8674(03)00986-3
- Amin R, Shukla A, Zhu JJ, et al. Nuclear pore protein NUP210 depletion suppresses metastasis through heterochromatin-mediated disruption of tumor cell mechanical response. Nat Commun. 2021;12(1):7216. doi:10.1038/s41467-021-27451-w
- Lautier O, Penzo A, Rouvière JO, et al. Co-translational assembly and localized translation of nucleoporins in nuclear pore complex biogenesis. Mol Cell. 2021;81(11):2417–2427.e5. doi:10.1016/j.molcel.2021.03.030
- Fernandez-Martinez J, Kim SJ, Shi Y, et al. Structure and function of the nuclear pore complex cytoplasmic mRNA export platform. Cell. 2016;167(5):1215–1228.e25. doi:10.1016/j.cell.2016.10.028
- Hazawa M, Lin D-C, Kobayashi A, et al. ROCK -dependent phosphorylation of NUP 62 regulates p63 nuclear transport and squamous cell carcinoma proliferation. EMBO Rep. 2018;19(1):73–88. doi:10.15252/embr.201744523
- Schuller AP, Wojtynek M, Mankus D, et al. The cellular environment shapes the nuclear pore complex architecture. Nature. 2021;598(7882):667–671. doi:10.1038/s41586-021-03985-3
- Raices M, D’Angelo MA. Nuclear pore complex composition: a new regulator of tissue-specific and developmental functions. Nat Rev Mol Cell Biol. 2012;13(11):687–699. doi:10.1038/nrm3461
- Knockenhauer KE, Schwartz TU. The nuclear pore complex as a flexible and dynamic gate. Cell. 2016;164(6):1162–1171. doi:10.1016/j.cell.2016.01.034
- Liu S, Kwon M, Mannino M, et al. Nuclear envelope assembly defects link mitotic errors to chromothripsis. Nature. 2018;561(7724):551–555. doi:10.1038/s41586-018-0534-z
- Li TF, Zeng H-J, Shan Z, et al. Overexpression of kinesin superfamily members as prognostic biomarkers of breast cancer. Cancer Cell Int. 2020;20:123. doi:10.1186/s12935-020-01191-1
- Wu YP, Ke Z-B, Zheng W-C, et al. Kinesin family member 18B regulates the proliferation and invasion of human prostate cancer cells. Cell Death Dis. 2021;12(4):302. doi:10.1038/s41419-021-03582-2
- Gao L, Zhang W, Zhang J, et al. KIF15-mediated stabilization of AR and AR-V7 contributes to enzalutamide resistance in prostate cancer. Cancer Res. 2021;81(4):1026–1039. doi:10.1158/0008-5472.CAN-20-1965
- Yu Y, Feng YM. The role of kinesin family proteins in tumorigenesis and progression: potential biomarkers and molecular targets for cancer therapy. Cancer. 2010;116(22):5150–5160. doi:10.1002/cncr.25461
- Neumayer G, Belzil C, Gruss OJ, et al. TPX2: of spindle assembly, DNA damage response, and cancer. Cell Mol Life Sci. 2014;71(16):3027–3047. doi:10.1007/s00018-014-1582-7
- Jiao CY, Feng QC, Li CX, et al. BUB1B promotes extrahepatic cholangiocarcinoma progression via JNK/c-Jun pathways. Cell Death Dis. 2021;12(1):63. doi:10.1038/s41419-020-03234-x
- Qiu J, Zhang S, Wang P, et al. BUB1B promotes hepatocellular carcinoma progression via activation of the mTORC1 signaling pathway. Cancer Med. 2020;9(21):8159–8172. doi:10.1002/cam4.3411
- Gong C, Ai J, Fan Y, et al. NCAPG promotes the proliferation of hepatocellular carcinoma through PI3K/AKT signaling. Onco Targets Ther. 2019;12:8537–8552. doi:10.2147/OTT.S217916
- Xiao C, Gong J, Jie Y, et al. NCAPG is a promising therapeutic target across different tumor types. Front Pharmacol. 2020;11:387. doi:10.3389/fphar.2020.00387
- Yang K, Ci S, Zhang J, et al. Targeting nuclear pore complex and therapeutic response in glioblastoma stem cells. J Clin Oncol. 2022;40(16_suppl):e14000–e14000. doi:10.1200/JCO.2022.40.16_suppl.e14000
- Stefanello ST, Luchtefeld I, Liashkovich I, et al. Impact of the nuclear envelope on malignant transformation, motility, and survival of lung cancer cells. Adv Sci. 2021;8(22):e2102757. doi:10.1002/advs.202102757