
Abstract
Background
The aim of this study is to explore the role of acetyl-CoA acyltransferase 2 (ACAA2) in the progression of hepatocellular carcinoma (HCC).
Methods
Bulk RNA data and single-cell RNA data were acquired from The Cancer Genome Atlas and Gene Expression Omnibus. Both in vitro and in vivo studies were used to determine the effect of ACAA2 on the progression of HCC, and RNA sequencing analysis was performed to explore the mechanism.
Results
We found downregulation of ACAA2 was involved in the malignant progression of HCC. The patient with low ACAA2 level had an immunosuppressive microenvironment in the HCC and predicted to have a poor prognosis. Decreased ACAA2 facilitated HCC proliferation and metastasis by activating the nuclear factor-κB (NFκB) signaling pathway. And increased CXCL1 induced by NFκB signaling pathway might be responsible for low level of ACAA2 related immunosuppressive microenvironment. Furthermore, the expression of ACAA2 was also detected in immune cells. The expression of ACAA2 in CD4+TCF7+T, CD4+FOXP3+T, CD8+GZMK+T, and CD8+KLRD1+T cells was inversely correlated with the composition of CD8+PDCD1+T cells in HCC. This effect might be due to the CCL5-CCRs and HLA-E-KLRCs ligand-receptor networks.
Conclusion
In a conclusion, downregulated ACAA2 promoted the progression of hepatocellular carcinoma and might be participated in the formation of immunosuppressive microenvironment. ACAA2 could be served as a favorable indicator for the prognosis of HCC and an ideal biomarker for immunotherapy.
Introduction
Hepatocellular carcinoma (HCC) remains a global challenge, accounting for 90% of liver malignancies.Citation1 Owing to late diagnosis and limited treatment, the overall survival (OS) rate of HCC is unsatisfactory, and HCC ranks third in cancer-related deaths worldwide.Citation2 Until 2017, only tyrosine kinase inhibitors (TKIs) were used for treating advanced-stage HCC.Citation3 In the past few years, immune checkpoint blockades (ICBs) have exhibited remarkable effects during cancer therapy and have become a first-line option for patients with advanced HCC who fail TKIs, based on the last version of the National Comprehensive Cancer Network (NCCN Guidelines Version 1.2022 Hepatocellular Carcinoma). ICBs are monoclonal antibodies that block the interaction between checkpoint proteins and their ligands to improve the immune response in HCC.Citation4 The objective remission rates of ICBs in HCC are 15–20% (including 1–5% complete responses) in a cohort of patients with HCC treated with a single agent.Citation5 Responders to ICBs can gain durable benefits and prolong survival.Citation5 In addition, approximately 20% of patients receiving pembrolizumab remained free from disease progression for more than a year compared to less than 7% of controls.Citation6
Metabolism reprogramming has thought to play key role in the progression of HCC.Citation7,Citation8 Recent studies have also revealed that oncogene-induced metabolic reprogramming in tumor cells can affect the tumor microenvironment to limit immune responses and present barriers to immunotherapy.Citation9 The poor vascular condition and demand for uncontrolled proliferation forces tumor cells to compete with immune cells for the necessary nutrients.Citation10 Little is known about the link between the metabolic features of tumor cells and immunotherapy.
In this study, we aimed to explore underlying metabolic biomarkers and their biological functions in HCC. Acetyl-CoA acyltransferase 2 (ACAA2), which decreases during HCC initiation, was identified as a gene of interest.Citation11 ACAA2 is involved in mitochondrial fatty acid elongation and degradation by catalyzing the last step of the respective β-oxidation pathway.Citation12 Decreased ACAA2 is essential for the development of hepatic steatosis by diminishing hepatic fatty acid β-oxidation.Citation13 Besides, upregulated ACAA2 could also diminish the hepatotoxicity induced by acetaminophen, indicating the liver protect effect of ACAA2.Citation14 However, there is fewer studies to demonstrate the role of ACAA2 in the HCC.
In the present study, we aimed to investigate the role of ACAA2 in HCC progression and subsequently, we evaluated its potential role in the tumor microenvironment.
Materials and Methods
Datasets and Cell Lines
Data from The Cancer Genome Atlas (TCGA) and Gene Expression Omnibus (GEO) were acquired using the SangerBox platform (http://vip.sangerbox.com/). Mutant-allele tumor heterogeneity (MATH) and stemness scores were obtained from the SangerBox platform. All the cell lines were purchased from Shanghai Cell Bank of the Chinese Academy of Sciences. All cell lines were cultured in Dulbecco’s modified Eagle medium (DMEM) supplemented with 10% fetal bovine serum (FBS) and 1% antibiotics (100 U/mL penicillin and 100 µg/mL streptomycin). All the cell lines were cultured at 37 °C in a 5% CO2 incubator.
Determination of Immune Cell Infiltration Levels and Immune Related Functional Scores
Immune cell infiltration level was obtained from the tumor and immune system interaction database (TISIDB), an integrated repository portal for tumor-immune system interactions.Citation15 Tumor immune dysfunction and exclusion (TIDE) was generated as previously described.Citation16,Citation17 Single-cell RNA analysis was performed using the GSE125449 and GSE140228 datasets. The cell types were identified using tumor immune single-cell hub (TISCH) (http://tisch.comp-genomics.org/home/) and the scTIME portal (http://sctime.sklehabc.com/unicellular/home).
Lentivirus, Stable Cell Line Construction, and Quantitative Real-Time PCR (qPCR)
The lentiviral vector system (LV) and empty vector was purchased from the GeneChem Corporation (Shanghai, China). Stable cell lines expressing the target gene or negative control were selected by adding 0.5 μg/mL puromycin into the medium. Total RNA was extracted and quantified using an RNA purification kit (Thermo Fisher, US) according to the manufacturer’s protocol. Quantitative real-time PCR was performed using the SYBR green power master mix (Promega, Madison, WI, USA). Primers used for the qRT-PCR experiments are listed:
F: 5′ - CTGCTCCGAGGTGTGTTTGTA-3′,
R: 5′ - GGCAGCAAATTCAGACAAGTCA-3′ for ACAA2;
F: 5′ - CTCGAGGCCCCTGGGGCAGAAGCCTC -3′,
R: 5′- GATATCGGGGCTCAGCAGGCGGGTCT -3′ for CXCL1;
F: 5′-AGAAGGCTGGGGCTCATTTG-3′,
R: 5′-AGGGGCCATCCACAGTCTTC-3′ for GAPDH.
Cell Proliferation and Cell Cycle Assay
For cell proliferation, cells were seeded in 96-well plates at 2×10³ cells per well, and cell viability was measured using a cell counting kit-8 (CCK-8) assay (Dojindo Molecular Technologies, Inc., Japan) at different time points. For cell cycle tests, 4×10⁴ cells were stained according to the protocol of the Cycle TESTTM PLUS DNA reagent kit (BD Biosciences San Jose, CA) and analyzed using flow cytometry (Beckman Coulter FC500).
Migration and Invasion
The migration and invasion of HCC cells were determined using Transwell assays. Chambers with or without precoated Matrigel were placed in a 24-well plate. DMEM supplemented with 10% FBS was added to the lower chamber. Cells (5×10⁴) suspended in 100 µL of FBS-free DMEM were seeded in the upper chamber and cultured for 24 h.
Western Blot
Cells were lysed in radioimmunoprecipitation assay buffer containing protease and phosphatase inhibitors. The samples were separated using SDS–PAGE and transferred to polyvinylidene fluoride membranes. After blocking with 5% skimmed milk at room temperature for 1 h, the membranes were incubated with primary antibodies overnight. The membranes were then incubated with the secondary antibodies for 1 h at room temperature, and the bands were detected using an enhanced chemiluminescence kit. The primary antibodies used in this study were ACAA2 (ab128929, ABCAM), pNFKB (3033, Cell Signaling Technology), and NFKB (8242, Cell Signaling Technology).
In vivo Tumor Growth
All experimental protocols involving animals were approved by the Animal Ethics Committee of the First Affiliated Hospital of the Harbin Medical University (2019049). Four–six-week-old male BALB/c nude mice were purchased from Shanghai Animal Centre (Shanghai, China). Flank subcutaneous xenografts were established by subcutaneous injection of 1×10⁶ cells suspended in 100 μL of phosphate-buffered saline. After 6 weeks, tumor growth was monitored using bioluminescence signals. For the liver orthotopic xenograft implantation model, subcutaneous tumors were dissected into 1 mm3 sections and then implanted into the liver parenchyma. Tumor growth was monitored using bioluminescence signals, and the mice were sacrificed after 6 weeks.
Statistical Analysis
The Student’s t-test was used for comparisons between the two groups. Pearson’s correlation analysis was used to determine the linear relationship between the two groups. Multivariate analysis was performed using the Cox regression model. Kaplan Meier curves were used to compare survival, and the Log rank test was used to compare survival between the different groups. The threshold was defined as P <0.05.
Results
Downregulated ACAA2 Was Associated with HCC Progression
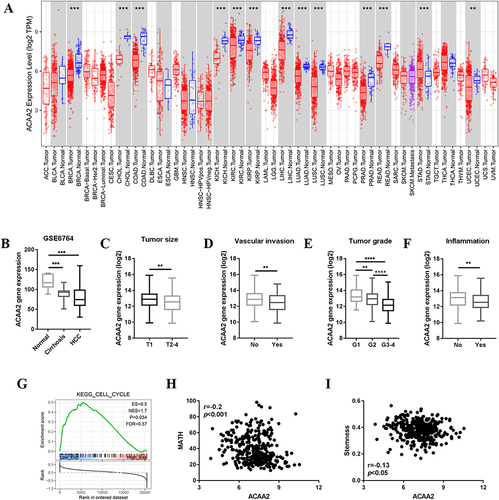
ACAA2 was frequently downregulated in different tumor tissues, including HCC (). Furthermore, ACAA2 gradually decreased during HCC initiation (). Patients with lower levels of ACAA2 were predicted to have a larger tumor size, more vascular invasion, higher tumor grade, and higher inflammation levels (). Gene set enrichment analysis (GSEA) results revealed that the cell cycle-related gene set was enriched in patients with low levels of ACAA2 (). The MATH value was used to determine HCC heterogeneity. The expression of ACAA2 was negatively associated with MATH, implying that the heterogeneity of HCC gradually increased as ACAA2 decreased (). The level of stemness of HCC was determined by RNA-based stemness scores. The results showed that the gene expression of ACAA2 was negatively associated with the stemness level of HCC (). The above results showed that downregulation of ACAA2 was involved in the malignant progression of HCC.
Figure 1 Downregulated ACAA2 was associated with HCC progression. (A) Gene expression of ACAA2 in different tumor types; blue: normal tissues; red: tumor tissues; (B) Gene expression of ACAA2 in different disease stages, data derived from GSE6764; (C–F) Compared gene expression of ACAA2 between different groups, data derived from TCGA-LIHC dataset; (G) GSEA data revealed the correlation between gene expression of ACAA2 and cell cycle; (H) The correlation between the expression of ACAA2 and MATH score; (I) The correlation between the expression of ACAA2 and stemness. **p<0.01; ***p<0.001; ****p<0.0001.
ACAA2 Served as a Biomarker for Immunotherapy
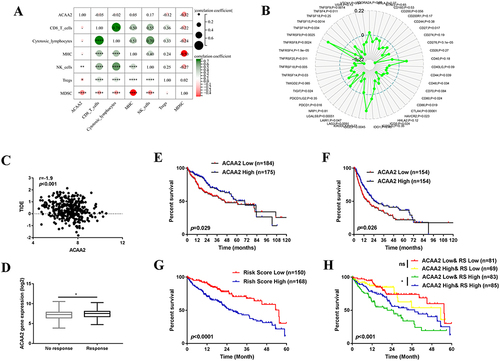
We then investigated the association between ACAA2 and the tumor microenvironment (TME). We found that ACAA2 was positively correlated with the infiltration of natural killer (NK) cells in HCC tissues but was inversely associated with regulatory T cells (Tregs) and myeloid-derived suppressor cells (MDSCs)(). In addition, ACAA2 was negatively correlated with immune checkpoints such as PDCD1, CTLA4, TIGHT, and LAG3 (). These results demonstrate that a low level of ACAA2 is accompanied by an immunosuppressive microenvironment. A TIDE score was generated to assess the response of the tumor to immunotherapy. Linear regression analysis revealed a reverse correlation between the expression of ACAA2 and TIDE score (). Moreover, patients with lower ACAA2 levels were predicted to have a poor response to ICBs, based on TIDE scores (). Patients with lower levels of ACAA2 were predicted to have shorter overall survival (OS) time and disease-free survival (DFS) time (). Immune checkpoints that were significantly correlated with ACAA2 were filtered. The risk scores of the ACAA2 related immune checkpoints were generated using a stepwise multivariate Cox regression analysis. The patient with a high-risk score was predicted to have a poor prognosis (). The combined effect of ACAA2 and risk score was generated using Kaplan-Meier curves. In the low-risk score group, the expression of ACAA2 did not influence the survival time, whereas in the high-risk score group, patients with low ACAA2 expression had a shorter OS (). The above data suggest that patients with low levels of ACAA2 had a low response to ICBs, and ACAA2 could be a biomarker for immunotherapy.
Figure 2 ACAA2 served as a biomarker for immunotherapy. (A) The correlation between ACAA2 and immune cell types and MHC; (B) Correlation between ACAA2 and immune check points; (C) Correlation between ACAA2 and TIDE score; (D) Compared the expression of ACAA2 between different groups; (E) Kaplan-Meier curves were used to determine the overall survival between different groups; (F) Kaplan-Meier curves were used to determine the disease-free survival between different groups; (G) Kaplan-Meier curves were used to determine the prognostic value of risk score; (H) Kaplan-Meier curves were used to determine the combine effect of ACAA2 and risk score on the prognosis of HCC; *p<0.05; **p<0.01; ****p<0.0001.
Downregulated ACAA2 Promoted Proliferation and Metastasis of HCC
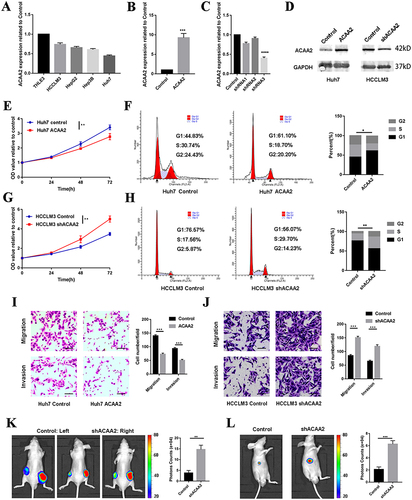
To determine the effect of ACAA2 on HCC, its mRNA expression levels were evaluated in normal (THLE-3) and different HCC cell lines. The HCC cell lines exhibited a relatively lower expression of ACAA2 compared with that noted for THLE-3 (). Subsequently, a stably transfected cell line was established by overexpressing ACAA2 in Huh7 cells, which had a relatively lower expression of ACAA2. In addition, silencing of ACAA2 was performed in the HCCLM3 cell line, which exhibited relatively higher expression of ACAA2. The efficiency of LV transfection was assessed using real-time PCR and Western blotting, and Lv-shRNA-3 (59%) was selected as the best candidate for silencing ACAA2 expression (). Elevated ACAA2 suppressed proliferation and induced cell cycle arrest in Huh7 cells ( and ). Knockdown of ACAA2 accelerated proliferation and promoted the cell cycle process in the HCCLM3 cell line ( and ). Overexpression of ACAA2 inhibited the migration and invasion ability of Huh7 cells, and decreased ACAA2 facilitated the migration and invasion of the HCCLM3 cell line ( and ). The in vivo results were consistent with those of in vitro studies. ACAA2 knockdown resulted in larger tumor volumes in the subcutaneous tumor model (, Supplementary Figure 1). Decreased ACAA2 levels also promoted tumor growth in the xenograft model (). These results demonstrated that downregulation of ACAA2 promotes the proliferation and metastasis of HCC.
Figure 3 Downregulated ACAA2 promoted proliferation and metastasis of HCC. (A) Gene expression of ACAA2 in different cell lines; (B and C) Gene expression of ACAA2 in the indicated cell lines; (D) The protein expression of ACAA2 was examined by Western blot in the indicated cell lines; (E and G) CCK8 assays was used to determine the proliferation of the indicated cell lines and the value of OD450 was related to control; (F and H) Representative images for cell cycle assays in indicated cell lines in the left panel, and statistical analysis in the right panel. (I and J) The migration and invasion abilities of the indicated cell lines were detected by Transwell assays in the left panel, and the statistical analysis was placed in the right panel. Bar=50µm (K) Representative images of subcutaneous tumors derived from indicated cell lines in left panel; the statistical analysis of bioluminescence signal in the right panel; (L) Representative images of liver xenograft derived from indicated cell lines in left panel; the statistical analysis of bioluminescence signal in the right panel. Five mice were used for each group *p<0.05; **p<0.01; ***p<0.001; ****p<0.0001.
Downregulated ACAA2 Facilitated HCC Progression via the NF-κB Signaling Pathway
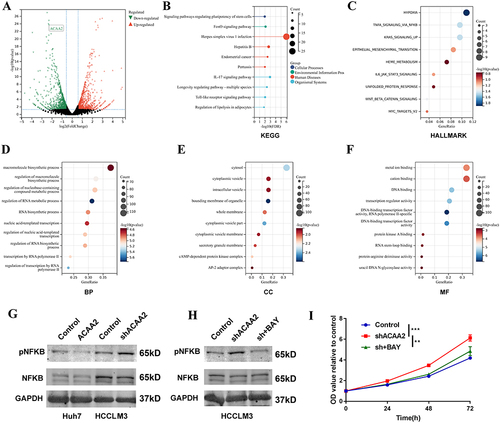
To further explore the mechanism by which of downregulated ACAA2 promoting HCC, an mRNA sequencing analysis was performed. Differentially expressed genes (|fold change| > 2, p < 0.05) were filtered and enriched in the signaling pathway (). KEGG enrichment analysis revealed that dysregulated signaling pathways induced by ACAA2 knockdown were majorly related to human diseases and organismal systems (). Hallmark enrichment analysis showed that downregulation of ACAA2 increased the adaptation of HCC to hypoxia and promoted epithelial mesenchymal transition (). In addition, diminished ACAA2 could activate the NF-κB signaling pathway (). GO enrichment analysis suggested that reduced ACAA2 promoted the biosynthesis of macromolecules and RNA, intracellular delivery, and transcription (). Activation of the NF-κB signaling pathway was examined using Western blotting. The results showed that elevated ACAA2 decreased the expression of pNFκB, whereas decreased ACAA2 increased the level of pNFκB (). The expression variation of ACAA2 had no effect on total NFκB (). BAY 11–7082 was used to inhibit NF-κB signaling. The activation of the NF-κB signaling pathway by downregulating ACAA2 was significantly suppressed by 5 μM BAY 11–7082 (). Blocking the NF-κB signaling pathway attenuated the proliferation induced by ACAA2 knockdown (). These results revealed that downregulation of ACAA2 facilitated HCC progression via the NF-κB signaling pathway.
Figure 4 Downregulated ACAA2 facilitated HCC progression via the NF-κB signaling pathway. (A) Volcano plot exhibited the gene expression altered after ACAA2 knockdown; (B) Different expression genes were enriched in KEGG pathways; (C) Different expression genes were enriched in Hallmark pathways; (D–F) Different expression genes were enriched in GO pathway; (G and H) The protein expression of pNKFB and NFKB were examined by Western blot in the indicated cell lines. 7.5µM BAY11-7082 was used to inhibit the NFKB signaling pathway; (I) CCK8 assays was used to determine the proliferation of the indicated cell lines and the value of OD450 was related to control; **p<0.01; ***p<0.001.
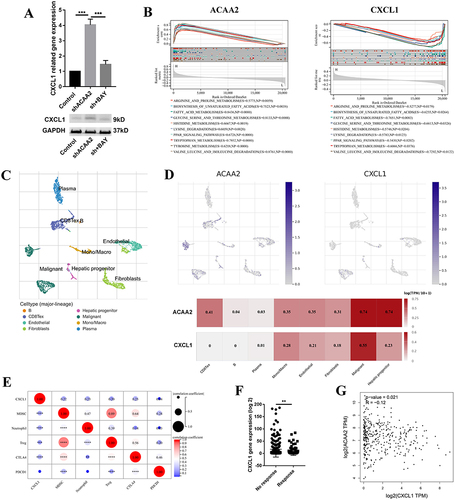
CXCL1 Contributed to the Low Level of ACAA2 Related Immune Suppression Microenvironment
Downregulation of ACAA2 increased the expression of CXCL1 via the NF-κB signaling pathway (). CXCL1, a secreted growth factor, plays a key role in tumor microenvironment modification. The GSEA results demonstrated that ACAA2 and CXCL1 were inversely involved in several metabolic signaling pathways in HCC (). Single-cell RNA (scRNA) analysis was performed using GSE125449. The cell types were identified using TISCH (). Both ACAA2 and CXCL1 were highly expressed in malignant cells (). The ACAA2–CXCL1 axis demonstrated that metabolic reprogramming of tumor cells could modify the tumor microenvironment in a paracrine manner. High level of CXCL1 in HCC tissues were positively correlated with the infiltration of MDSCs, neutrophils, and Tregs as well as the expression of CTLA4, but not PDCD1 (). The patient with a high CXCL1 level showed a poor response to immunotherapy (). Linear regression analysis revealed a reverse correlation between ACAA2 and CXCL1 expression in HCC (). These results suggest that CXCL1 is responsible for the low level of ACAA2 related immune suppression microenvironment.
Figure 5 CXCL1 contributed to the low level of ACAA2 related immune suppression microenvironment. (A) Gene expression of CXCL1 in the indicated cell lines in the upper panel; protein expression of CXCL1 in the indicated cell lines in the lower panel; (B) The top 10 common signaling pathways that both ACAA2 and CXCL1 were involved in; (C) The cell types were identified; single-cell RNA (scRNA) data was derived from GSE125449; (D) The expression of ACAA2 and CXCL1 in different cell types; (E) The correlation between ACAA2 and immune cell types and immune check points; (F) Compared the expression of ACAA2 in different groups; (G) Linear regression analysis was used to determine the relationship between ACAA2 and CXCL1 in HCC; data was derived from TCGA-LIHC. **p<0.01; ***p<0.001; ****p<0.0001.
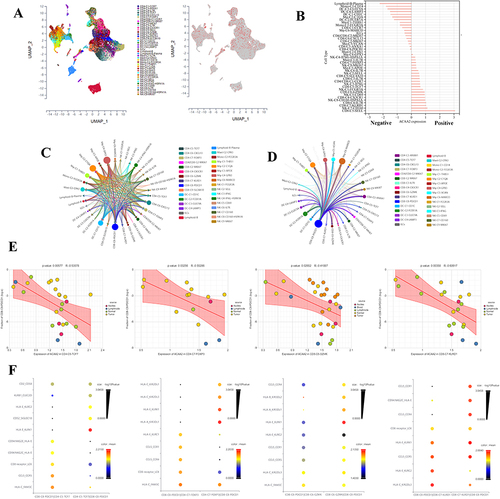
Exploring the Role of ACAA2 in the Immune Cells
The scRNA data were derived from GSE140228, and the cell types were identified using the scTIME portal. We found that ACAA2 was also gently expressed in the immune cells (). Basing on the expression of ACAA2, the immune cell types were divided into ACAA2 positive group and ACAA2 negative group (). CD8+PDCD1+T cells belonged to the ACAA2 negative group (). A ligand-receptor (LR) network among the immune cell types was generated, and 28 cell types interacted with CD8+PDCD1+T cells including 12 ACAA2 positive cell types ( and ). Among these cell types, the expression of ACAA2 in CD4+TCF7+T, CD4+FOXP3+T, CD8+GZMK+T, and CD8+KLRD1+T cells was strongly negatively correlated with the composition of CD8+PDCD1+T cells (). The top 10 LR pairs are shown (). All four cell types existed CCL5–CCRs and HLA-E-KLRCs LR pairs with CD8+PDCD1+ T cells. These results suggested that ACAA2 in immune cells decreased the composition of CD8+PDCD1+T cells by affecting the LR network. The lack of ACAA2 receded the antitumor immune response and increased resistance to immunotherapy.
Figure 6 Exploring the role of ACAA2 in the immune cells. (A) The cell types were identified; single-cell RNA (scRNA) data was derived from GSE140228; (B) The expression of ACAA2 in different cell types; (C) Ligand-receptor networks among the cell types; (D) Ligand-receptor networks between CD8-C8-PDCD1 cell type and other cell types; (E) The correlation between the expression of ACAA2 in the four cell types and composition of CD8-CD-PDCD1 cell type in HCC; (F) The top 10 ligand-receptor networks for cell types.
Discussion
Immunotherapy is the first-line treatment for advanced HCC.Citation18 Immunotherapy is associated with improved OS compared with chemotherapy in advanced HCC. The combined efficacy and safety of immunotherapy and antiangiogenic therapy for unresectable HCC have been confirmed in multiple studies.Citation19 IFNα and anti-PD1 cotreatment as a novel combination strategy for HCC has also been suggested.Citation20 A recent study demonstrated that perioperative camrelizumab plus apatinib displays promising efficacy and manageable toxicity in patients with resectable HCC.Citation21 However, the benefits of immunotherapy are limited in certain patients. Therefore, identifying an effective biomarker is essential for immunotherapy.
Metabolic reprogramming as a hallmark of cancer can limit immune responses and present barriers to cancer therapy, and growing evidence suggests promising indications for targeting metabolism to improve the antitumor microenvironment.Citation22 Tumor-associated macrophages promote tumor progression and resistance to immunotherapy by affecting the metabolic profile of the TME.Citation23 Reshaping lipid metabolism could inhibit effector T cell senescence induced by tumor cells and Tregs, and enhance tumor immunotherapy.Citation24 Dysregulated metabolism in HCC tissues is manifested mainly by decreased gene expression.Citation25 Lack of key regulators of metabolism can satisfy the demand for uncontrolled proliferation of tumor cells, and excess metabolites also participate in the creation of an immunosuppressive microenvironment.Citation25,Citation26 Therefore, metabolic regulators may serve as ideal biomarkers for immunotherapy.
In the present study, we found that ACAA2 is downregulated during HCC development. Decreased ACAA2 levels are accompanied by an increased immunosuppressive tumor microenvironment. Knockdown of ACAA2 in tumor cells promotes progression of HCC malignancy. The lack of ACAA2 elevated the expression of CXCL1 via the NF-κB signaling pathway. CXCL1 promotes tumor progression and induces immune suppression by activating different signaling pathways.Citation27–29 GSEA revealed that ACAA2 and CXCL1 were inversely involved in several metabolic pathways. Our results demonstrate that, in addition to acquiring nutrients and increasing metabolites, metabolic reprogramming of cancer cells could modulate the TME in a paracrine manner. However, the key mechanism for ACAA2 regulating NF-κB signaling pathway is still unclear. ACAA2 is involved in lipid metabolism. Lipid metabolism not only provides the energetic needs of the cells but also provides the raw material for signaling molecular for many oncogenic signaling pathways.Citation30 Downregulated ACAA2 could impede the lipid metabolism and lead to the accumulation of intermediate metabolites, which might mediate decreased ACAA2 inducing the activation of NF-κB signaling pathway.
ACAA2 is also expressed in immune cells. The expression of ACAA2 in immune cells was negatively correlated with the composition of CD8+ T cells with PDCD1 positive in the tumor microenvironment. This effect may be mediated by CCL5–CCRs and the HLA-E–KLRCs LR network. A mouse experiment reported that CCL5 expression could restore immune surveillance in HCC.Citation31 These results suggest that loss of ACAA2 facilitates the immune suppression microenvironment in a dual manner. Based on the TIDE scores, we found that the expression of ACAA2 was higher in the patient response to immunotherapy group than in the no response group.
Conclusion
In a conclusion, downregulated ACAA2 promotes the progression of hepatocellular carcinoma and participates in the formation of immunosuppressive microenvironment. We thought that ACAA2 could be an ideal biomarker for prognosis and immunotherapy of HCC.
Institutional Review Board Statement
All experiments were approved by the Ethics Committee of the first affiliated hospital of Harbin Medical University. The welfare of the laboratory animals was directed by the following guidelines: Regulations for the management of laboratory animals by State Science and Technology Commission of China, Guidance on the good treatment of laboratory animals by Ministry of Science and Technology of China, and Regulations of Heilongjiang Province on the management of laboratory animals by the Government of Heilongjiang Province.
Author Contributions
All authors made a significant contribution to the work reported, whether that is in the conception, study design, execution, acquisition of data, analysis and interpretation, or in all these areas; took part in drafting, revising or critically reviewing the article; gave final approval of the version to be published; have agreed on the journal to which the article has been submitted; and agree to be accountable for all aspects of the work.
Disclosure
The authors declare that they have no competing interests to disclose.
Acknowledgments
We thank for the technical supports of Shanghai Biotechnology Corporation.
Data Sharing Statement
The datasets presented in this study can be found in online datasets. The names of the datasets can be found in the article material. The datasets used and analyzed during the current study are available from the corresponding author on reasonable request.
Additional information
Funding
References
- Benson AB, D’Angelica MI, Abbott DE, et al. Hepatobiliary cancers, version 2.2021, NCCN clinical practice guidelines in oncology. J Natl Compr Canc Netw. 2021;19(5):541–565. doi:10.6004/jnccn.2021.0022
- Sung H, Ferlay J, Siegel RL, et al. Global cancer statistics 2020: GLOBOCAN estimates of incidence and mortality worldwide for 36 cancers in 185 countries. CA Cancer J Clin. 2021;71(3):209–249. doi:10.3322/caac.21660
- Sangro B, Sarobe P, Hervas-Stubbs S, Melero I. Advances in immunotherapy for hepatocellular carcinoma. Nat Rev Gastroenterol Hepatol. 2021;18(8):525–543. doi:10.1038/s41575-021-00438-0
- Chen L, Flies DB. Molecular mechanisms of T cell co-stimulation and co-inhibition. Nat Rev Immunol. 2013;13(4):227–242. doi:10.1038/nri3405
- El-Khoueiry AB, Sangro B, Yau T, et al. Nivolumab in patients with advanced hepatocellular carcinoma (CheckMate 040): an open-label, non-comparative, Phase 1/2 dose escalation and expansion trial. Lancet. 2017;389(10088):2492–2502. doi:10.1016/S0140-6736(17)31046-2
- Finn RS, Ryoo BY, Merle P, et al. Pembrolizumab as second-line therapy in patients with advanced hepatocellular carcinoma in KEYNOTE-240: a randomized, double-blind, Phase III trial. J Clin Oncol. 2020;38(3):193–202. doi:10.1200/JCO.19.01307
- Chen M, Zhang C, Liu W, et al. Long noncoding RNA LINC01234 promotes hepatocellular carcinoma progression through orchestrating aspartate metabolic reprogramming. Mol Ther. 2022;30(6):2354–2369. doi:10.1016/j.ymthe.2022.02.020
- Hu C, Xin Z, Sun X, et al. Activation of ACLY by SEC63 deploys metabolic reprogramming to facilitate hepatocellular carcinoma metastasis upon endoplasmic reticulum stress. J Exp Clin Cancer Res. 2023;42(1):108. doi:10.1186/s13046-023-02656-7
- Bader JE, Voss K, Rathmell JC. Targeting metabolism to improve the tumor microenvironment for cancer immunotherapy. Mol Cell. 2020;78(6):1019–1033. doi:10.1016/j.molcel.2020.05.034
- DeBerardinis RJ, Chandel NS. Fundamentals of cancer metabolism. Sci Adv. 2016;2(5):e1600200. doi:10.1126/sciadv.1600200
- Kodama T, Bard-Chapeau EA, Newberg JY, et al. Two-step forward genetic screen in mice identifies ral GTPase-activating proteins as suppressors of hepatocellular carcinoma. Gastroenterology. 2016;151(2):324–337.e12. doi:10.1053/j.gastro.2016.04.040
- Miltiadou D, Hager-Theodorides AL, Symeou S, et al. Variants in the 3’ untranslated region of the ovine acetyl-coenzyme A acyltransferase 2 gene are associated with dairy traits and exhibit differential allelic expression. J Dairy Sci. 2017;100(8):6285–6297. doi:10.3168/jds.2016-12326
- Agarwal N, Iyer D, Gabbi C, et al. HIV-1 viral protein R (Vpr) induces fatty liver in mice via LXRalpha and PPARalpha dysregulation: implications for HIV-specific pathogenesis of NAFLD. Sci Rep. 2017;7(1):13362. doi:10.1038/s41598-017-13835-w
- Lei X, Xu Q, Li C, et al. Egr1 confers protection against Acetaminophen-induced hepatotoxicity via transcriptional upregulating of Acaa2. Int J Biol Sci. 2022;18(9):3800–3817. doi:10.7150/ijbs.71781
- Ru B, Wong CN, Tong Y, et al. TISIDB: an integrated repository portal for tumor-immune system interactions. Bioinformatics. 2019;35(20):4200–4202. doi:10.1093/bioinformatics/btz210
- Lu X, Jiang L, Zhang L, et al. Immune signature-based subtypes of cervical squamous cell carcinoma tightly associated with human papillomavirus type 16 expression, molecular features, and clinical outcome. Neoplasia. 2019;21(6):591–601. doi:10.1016/j.neo.2019.04.003
- Jiang P, Gu S, Pan D, et al. Signatures of T cell dysfunction and exclusion predict cancer immunotherapy response. Nat Med. 2018;24(10):1550–1558. doi:10.1038/s41591-018-0136-1
- Cabibbo G, Reig M, Celsa C, et al. First-line immune checkpoint inhibitor-based sequential therapies for advanced hepatocellular carcinoma: rationale for future trials. Liver Cancer. 2022;11(1):75–84. doi:10.1159/000520278
- Sparchez Z, Radu P, Bartos A, et al. Combined treatments in hepatocellular carcinoma: time to put them in the guidelines? World J Gastrointest Oncol. 2021;13(12):1896–1918. doi:10.4251/wjgo.v13.i12.1896
- Hu B, Yu M, Ma X, et al. Interferon-A potentiates anti-PD-1 efficacy by remodeling glucose metabolism in the hepatocellular carcinoma microenvironment. Cancer Discov. 2022;12(7):1718–1741. doi:10.1158/2159-8290.CD-21-1022
- Xia Y, Tang W, Qian X, et al. Efficacy and safety of camrelizumab plus apatinib during the perioperative period in resectable hepatocellular carcinoma: a single-arm, open label, Phase II clinical trial. J Immunother Cancer. 2022;10(4):e004656. doi:10.1136/jitc-2022-004656
- Petitprez F, Meylan M, de Reynies A, Sautes-Fridman C, Fridman WH. The tumor microenvironment in the response to immune checkpoint blockade therapies. Front Immunol. 2020;11:784. doi:10.3389/fimmu.2020.00784
- Vitale I, Manic G, Coussens LM, Kroemer G, Galluzzi L. Macrophages and metabolism in the tumor microenvironment. Cell Metab. 2019;30(1):36–50. doi:10.1016/j.cmet.2019.06.001
- Liu X, Hartman CL, Li L, et al. Reprogramming lipid metabolism prevents effector T cell senescence and enhances tumor immunotherapy. Sci Transl Med. 2021;13(587). doi:10.1126/scitranslmed.aaz6314
- Gao Q, Zhu H, Dong L, et al. Integrated proteogenomic characterization of HBV-related hepatocellular carcinoma. Cell. 2019;179(2):561–577 e522. doi:10.1016/j.cell.2019.08.052
- Sun R, Zhang Z, Bao R, et al. Loss of SIRT5 promotes bile acid-induced immunosuppressive microenvironment and hepatocarcinogenesis. J Hepatol. 2022;77(2):453–466. doi:10.1016/j.jhep.2022.02.030
- Wang N, Liu W, Zheng Y, et al. CXCL1 derived from tumor-associated macrophages promotes breast cancer metastasis via activating NF-kappaB/SOX4 signaling. Cell Death Dis. 2018;9(9):880. doi:10.1038/s41419-018-0876-3
- Ogawa R, Yamamoto T, Hirai H, et al. Loss of SMAD4 promotes colorectal cancer progression by recruiting tumor-associated neutrophils via the CXCL1/8-CXCR2 axis. Clin Cancer Res. 2019;25(9):2887–2899. doi:10.1158/1078-0432.CCR-18-3684
- Liu ZY, Zheng M, Li YM, et al. RIP3 promotes colitis-associated colorectal cancer by controlling tumor cell proliferation and CXCL1-induced immune suppression. Theranostics. 2019;9(12):3659–3673. doi:10.7150/thno.32126
- Alannan M, Fayyad-Kazan H, Trézéguet V, et al. Targeting lipid metabolism in liver cancer. Biochemistry. 2020;59(41):3951–3964. doi:10.1021/acs.biochem.0c00477
- de Galarreta M R, Bresnahan E, Molina-Sanchez P, et al. Beta-catenin activation promotes immune escape and resistance to anti-PD-1 therapy in hepatocellular carcinoma. Cancer Discov. 2019;9(8):1124–1141. doi:10.1158/2159-8290.CD-19-0074