
Abstract
Background
Studies have demonstrated that propionate metabolism-related genes (PMRGs) are associated with cancer progression. PMRGs are not known to be involved in Hepatocellular carcinoma (HCC).
Methods
In this study, The Cancer Genome Atlas (TCGA) and Gene Expression Omnibus (GEO) databases were accessed for HCC-related transcriptome data and clinical information. First, DE-PMRGs were derived by intersecting PMRGs and DEGs between HCC tissues and normal controls. The clusterProfiler R package was then used to enrich DE-PMRGs. In addition, biomarkers of HCC were identified, and a prognostic model was developed. Using functional analysis and tumor microenvironment analysis, new insights were obtained into HCC. The expression of biomarkers was validated using quantitative real-time polymerase chain reaction (qRT-PCR).
Results
132 DE-PMRGs were obtained by intersecting 3690 DEGs and 291 PMRGs. Steroid and organic acid metabolism were associated with these genes. For the construction of the risk model for HCC samples, five biomarkers were identified, including Acyl-CoA dehydrogenase short chain (ACADS), CYP19A1, formiminotransferase cyclodeaminase (FTCD), glucose-6-phosphate dehydrogenase (G6PD), and glutamic-oxaloacetic transaminase (GOT2). ACADS, FTCD, and GOT2 were positive factors, whereas CYP19A1 and G6PD were negative. HCC patients with AUC greater than 0.6 were predicted to survive 1/2/3/4/5 years, indicating decent efficiency of the model. The probability of 1/3/5-survival for HCC was also predicted by the nomogram using the risk score, pathologic T stage, and cancer status. Moreover, functional enrichment analysis revealed the high-risk genes were associated with invasion and epithelial-mesenchymal transition. Significantly, immune cell infiltration and immune checkpoint expression were linked to HCC development.
Conclusion
This study identified five biomarkers of propionate metabolism that can predict HCC prognosis. This finding may provide a deeper understanding of PMRG function in HCC.
Introduction
Hepatocellular carcinoma (HCC) accounts for 75–85% of liver cancer cases.Citation1 While immune and targeted drug therapy are the first-line treatments for HCC, they are not suitable for all patients owing to the different biological characteristics of tumors.Citation2 Even though the above treatments have greatly improved survival rates, advanced HCC still has a poor prognosis. In current practice, it is widely used to predict the prognosis of HCC using the Barcelona Clinic Liver Cancer (BCLC) classification.Citation3 However, some patients with similar tumor stages exhibit different outcomes, suggesting that the staging system is still lacking. Therefore, exploring new biomarkers for HCC patients and constructing a risk model to aid in the diagnosis and prognosis of HCC are of significant importance.
Propionate metabolism differs across species.Citation4 Propionate growth triggers fatty acid breakdown, boosting three β-oxidation enzymes. Increased amino acid and protein degradation enzymes indicate their role in supporting propionate metabolism.Citation5 Recent research has revealed that propionate metabolism dysfunction is a significant factor in cancer and also represents a valuable potential target in the treatment of metastatic cancer.Citation6 There were several health benefits of propionic fermentation in colon, which include the prevention of fat deposition, lowering cholesterol, reducing inflammation, and preventing cancer development.Citation7 Propionate metabolism imbalance heightens metastasis in breast and lung cancers via ERK2-activated SP1/EGR1 switch, downregulating methylmalonyl-CoA epimerase (MCEE). MCEE loss weakens propionate-driven anaplerosis, causing intracellular and intratumoral methylmalonic acid (MMA) buildup. MMA, a propionate metabolism byproduct, enhances cancer cell invasiveness, exacerbating metastasis.Citation6 Besides inhibiting colon cancer cell proliferation and inducing apoptosis, propionate could act as an inhibitor of proliferation of HCC by activating the GPR43 signaling pathway.Citation8–10 Despite this, the role of the propionate metabolism-related genes (PMRGs) in the pathogenesis of HCC remains uncertain.
We constructed a novel prognostic model for HCC based on five prognostic biomarkers (ACADS, CYP19A1, FTCD, G6PD, and GOT2) that were identified in this study, in which the coefficient of ACADS, FTCD, and GOT2 were negative and that of the other were positive. The biomarkers were acquired by univariate Cox analysis and at least absolute contraction and choice of operator (lasso) analysis. Next, univariate and multivariate Cox analyses were performed to select the independent predictor to construct the nomogram. Additionally, we focused on the function and the tumor microenvironment (TME) of different risk groups. Our findings may prove useful in identifying potential targets for the clinical diagnosis of HCC and in understanding the mechanisms whereby PMRGs play a role in the development of HCC.
Materials and Methods
Data Extraction
The RNA sequencing data, survival, and clinical information of HCC patients were downloaded from TCGA database (https://portal.gdc.cancer.gov) and GEO database (http://www.ncbi.nlm.nih.gov/geo), respectively. The former contains 371 HCC and 50 normal control (HC) samples, and 365 HCC samples have both survival and clinical information. The GES14520 dataset (GPL3921, https://www.ncbi.nlm.nih.gov/search/all/?term=GES14520) contains 225 HCC and 220 HC samples, and 221 HCC samples have survival information. Furthermore, a total of 291 PMRGs (relevance score > 10) were retrieved from the GeneCards database (https://www.genecards.org; Supplementary Table 1) with “propionate metabolism” as the key work.
Functional Analysis of Differentially Expressed PMRGs (DE-PMRGs) of HCC
First, the differentially expressed genes (DEGs) between 371 HCC and 50 HC samples were compared using the “limma” R package (version 3.48.3) (|log2FC| > 1, adj.p value < 0.05).Citation11 Then, DE-PMRGs were obtained by intersecting the DEGs and 291 PMRGs using “venn”. Furthermore, Gene ontology (GO) and Kyoto Encyclopedia of Genes and Genomes (KEGG) enrichment analyses of DE-PMRGs were conducted using the “clusterProfiler” R package (version 4.0.2) (count ≥ 1, adj.p value < 0.05).Citation12
Construction of the Survival Risk Model of HCC
In this study, 365 HCC samples from TCGA database were collected for constructing the survival risk model. The survival risk model was constructed using biomarkers obtained through univariate cox analysis and least absolute shrinkage and selection operator (LASSO) analysis. The univariate cox analysis was implemented by “survival” packageCitation13 (version 3.2–13) and the results was displayed by “forestplot” packageCitation14 (version 2.0.1). Furthermore, “glmnet” packageCitation15 (version 4.1–3) was used to implemented LASSO regression analysis. The predict.coxph function in survival package was used in calculating the risk score, as follows: Riskscore = β1X1 + β2X2 +. + βnXn. β refers to the regression coefficient of the prognostic gene, and X represents the expression of the gene. The HCC patients were divided into the high- and low-risk groups on the basis of the median risk value.
To predict the accuracy of the survival risk model, the Kaplan–Meier (KM) curve and receiver operating characteristic (ROC) curve were analyzed between these two groups. In addition, 221 HCC samples from GSE14520 were collected and used as the validation dataset to verify this survival risk model. The risk curve of high- and low-risk groups and the expression heatmap of biomarkers were plotted by “ggplot2” package (version 3.3.5).Citation16 The KM curve and ROC curve were painted by “survminer” package (version 0.4.9)Citation17 and “survivalROC” package (version 1.0.3),Citation18 respectively.
Independent Prognostic Analysis and Clinical Correlation Analysis
The Wilcoxon test was used to compare the correlation between the risk score and different clinical characteristics (age, stage, grade, cancer status, gender, pathologic stage M, N, and T). Then, the significant prognostic factors explored by univariate and multivariate Cox analyses were used to construct the nomogram. Afterward, the calibration curves, decision curve analysis (DCA), and ROC curves of the above model and prognostic factors were constructed to verify the validity of the nomogram.
Functional Analysis
On the one hand, the gene set enrichment analysis (GSEA) was performed to study the function of genes in different risk groups using the “clusterProfiler” R package (version 4.0.2) and the “org.Hs.eg.db” R package (version 3.13.0) (|NES| > 1, NOM P < 0.05, q < 0.25). Next, 86 invasion-related genes were obtained from cancerSEA database,Citation19 1184 epithelial–mesenchymal transition (EMT)-related genes were obtained from dbEMT2 database,Citation20 and 47 angiogenesis-related genes obtained from MSigDB database.Citation21 The invasion score, angiogenesis score, and EMT score of each sample were calculated using the “ssGSEA” algorithm in “GSVA” packageCitation22 based on the expression of above genes. These three scores and the mRNAsi score were compared in these two risk groups. The mRNAsi stemness index of patients in the TCGA-LIHC cohort was collected from the Annex of the published literature.Citation23
TME Analysis
TME is a critical part of the tumor tissue.Citation24 During this study, the relative percent of 22 immune cells in the samples was calculated by CIBERSORTCitation25 algorithm (http://CIBERSORT.stanford.edu/). The score of 22 immune cells and 47 immune checkpointsCitation26 were compared between different risk groups by Wilcoxon test. Moreover, the immunophenscore (IPS), tumor immune dysfunction and exclusion (TIDE), and ESTIMATE (Estimation of STromal and Immune cells in MAlignant Tumor tissues using Expression data) analyses in different risk groups were calculated for assessing the tumor purity and the response to the immunotherapy. The IPS score of HCC patients was collected from The Cancer Immunome Atlas (TCIA) database (https://tcia.at/home). The score of TIDE prediction, dysfunction prediction, and exclusion prediction was retrieved from the TIDE online database (http://tide.dfci.harvard.edu/). In addition, the immune score, ESTIMATE score, stromal score, and tumor purity of samples in the high- and low-risk groups were calculated via ESTIMATE algorithm based on the expression of biomarkers.
Expression Verification of Biomarkers
The expression of each biomarker was verified in both TCGA database and GSE14520. After that, the expression of biomarkers was validated by using a quantitative real-time polymerase chain reaction (qRT-PCR). Ten pairs of HCC tumor and adjacent tissue samples were committed by the patients and the Ethics Committee of Huaihe Hospital (Supplementary Table 2). Total RNA was extracted using TRIzol (Thermo Fisher, Shanghai, CN), and mRNA was reverse-transcribed into cDNA using SureScript-First-strand-cDNA-synthesis-kit (Servicebio, WuHan, CN). The qRT-PCR reaction system was made up of 3ul of cDNA, 5ul of 2xUniversal Blue SYBR Green qPCR Master Mix and 1ul of each upstream and downstream primers. Finally, the reactions were performed on a CFX96 real-time quantitative fluorescence PCR instrument. The amplification reactions were programmed with pre-denaturation at 95 °C for 1 min, followed by 40 cycles, each cycle consisting of 95 °C for 20s, 55 °C for 20s, and 72 °C for 30s. The relative expression of genes was calculated by the 2−ΔΔCt method using Gapdh as the internal reference gene. The primer sequences were listed in .
Table 1 The Primer Sequences for qRT-PCR Validation of Biomarkers
Results
A Total of 132 DE-PMRGs Were Associated with Steroid and Organic Acid Metabolic Processes
There were 3690 DEGs (1627 up-regulated and 2063 down-regulated) between 371 HCC and 50 HC samples (). Then, 132 DE-PMRGs were obtained by intersecting 3690 DEGs and 291 PMRGs (, Supplementary Table 3).
Figure 1 The differentially expressed propionate metabolism-related genes (DE-PMRGs) and functional enrichment analysis. (A) 3690 differentially expressed genes (DEGs) between liver Hepatocellular carcinoma (LIHC) and normal control (NC) samples. (B) The venn diagram of 132 DE-PMRGs. (C and D) The Gene Ontology (GO) functions (C) and Kyoto Encyclopedia of Genes and Genomes (KEGG) pathways (D) enriched by 132 DE-PMRGs. BP, biological progress; CC, cellular component; MF, molecular function.
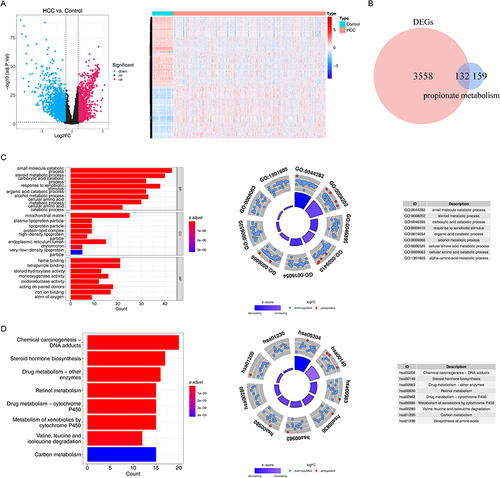
These 132 DE-PMRGs were enriched to 867 Gene Ontology (GO) functions with respect to function, encompassing steroid metabolism, carboxylic acid, organic acid, cellular amino acid metabolism, etc. Additionally, these DE-PMRGs were linked to 49 KEGG pathways, including those for steroid hormone production, retinol metabolism, the breakdown of valine, leucine, and isoleucine, carbon metabolism, and others ( and ).
Five Biomarkers Were Used for Constructing the Survival Risk and Prognostic Models of HCC
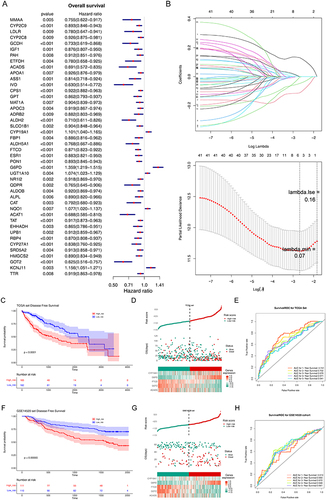
In this study, five biomarkers, namely, ACADS, CYP19A1, FTCD, G6PD, and GOT2 were identified. Among them, ACADS, FTCD, and GOT2 were positive factors (hazard ratio < 1), while CYP19A1 and G6PD were negative factors (hazard ratio > 1) ( and ). The coefficient of biomarkers was shown in . Next, the risk score was calculated, and the KM curve and risk curve indicated that the survival between the two risk groups differed significantly (p < 0.0001) ( and ). It was determined that the survival risk model could be used as a prognostic model if the area under the ROC curve (AUC value) of 1–5 years was greater than 0.6 (). Moreover, the results of KM curve, risk curve, and ROC curve in the validation dataset (GSE14520) were consistent with those of the training dataset ().
Table 2 The Coefficient of the Biomarkers
Figure 2 Construction and validation of prognostic model for LIHC. (A) The forest diagram of 44 biomarkers obtained by univariate cox analysis (p < 0.01). (B) The coefficients of biomarkers and the error plot for cross-validation in the least absolute shrinkage and selection operator (LASSO) analysis. The different colored lines in the graphic above represent different genes. (C) Kaplan-Meier plot of patients in a low- or high-risk group (p < 0.0001), and the number of patients in different risk groups. (D) Up: The risk score of each patient with LIHC. Medium: The patient survival based on the risk score. Down: The heat map of the 5 biomarkers in the high- and low-risk group. (E) Receiver operating characteristic (ROC) curves for the predictive value of the prognostic model for different years. AUC: area under the curve. (F–H) Validation of the prognostic model in GSE14520 dataset. (F) Kaplan-Meier plot of patients in a low- or high-risk group (p = 0.00065), and the number of patients in different risk groups. (G) Up: The risk score of each patient with LIHC. Medium: The patient survival based on the risk score. Down: The heat map of the 5 biomarkers in the high- and low-risk group. (H) ROC curves for the predictive value of the prognostic model for different years.
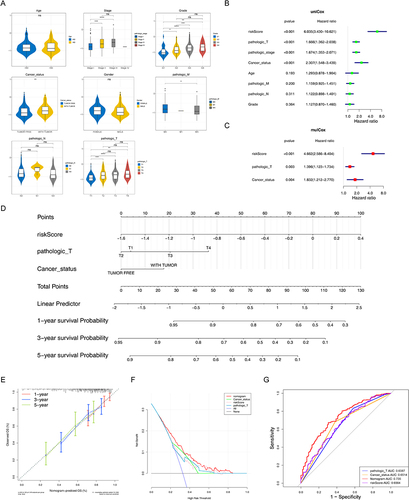
In addition, the risk scores were considerably different between stages I and II, stages I and III, grades 1 and 2, grades 1 and 3, grades 1 and 4, grades 2 and 3, tumor free and with tumor, pathologic M0 and MX, pathologic T1 and T2, pathologic T1 and T3, and pathologic T1 and T4 (p < 0.05) (). Three factors, namely, pathologic T, cancer status, and risk score were negatively associated with patient survival ( and ). The nomogram with these three prognostic factors was constructed, and the slopes of survival probability in calibration curve were close to 1, which indicated that the prediction model could be used as an effective model ( and ). In addition, the benefit rate and the AUC value of the nomogram model were higher than others, and the AUC value of these three prognostic factors were higher than 0.6 ( and ). All these results suggested that the nomogram model had accurate predictive ability for HCC, and the prediction accuracy of the nomogram model was higher than that of the single factor.
Figure 3 Independent prognostic analysis and clinical correlation analysis. (A) Comparison of risk scores among different sub-types for different clinical factors. ns, not significant; *p<0.05; ** p<0.01; ***p<0.001; ****p<0.0001. (B and C) Three independent prognostic factors obtained by univariate (B) and multivariate (C) COX regression analyses. (D) The nomogram was constructed based on three independent prognostic factors to predict the probability of 1/3/5-year survival. (E and F) The calibration curve (E) and decision curve analysis (DCA) curve (F) of the nomogram. (G) ROC curves of the nomogram and independent prognostic factors.
The Genes in High-Risk Groups Were Associated with the Functions of Invasion and EMT
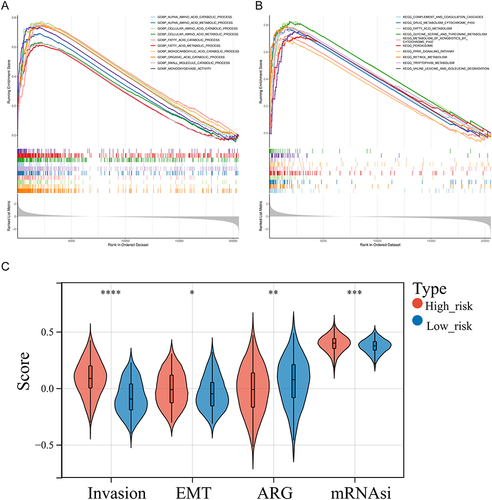
The GSEA results demonstrated that the functions of alpha amino acid, fatty acid catabolic and metabolic process, monocarboxylic acid, organic acid catabolic process, and others and the pathways, including complement and coagulation cascades, fatty acid metabolism, glycine serine and threonine metabolism and degradation, PPAR signaling pathway, and others were significantly highly enriched in the high-risk groups (p < 0.05) ( and , Supplementary Table 4). In addition, the invasion score, angiogenesis score, EMT score, and mRNAsi score were significantly different between these two risk groups. In detail, the invasion score, EMT score, and mRNAsi score were higher in high-risk groups (p < 0.05) (). According to these results, genes associated with invasion and EMT functions were significantly more prevalent in high-risk groups.
Figure 4 Gene set enrichment analysis (GSEA) of high-risk groups. (A and B) The GO terms (A) and KEGG pathways significantly enriched in the high-risk group. (C) Discrepancies of invasion score, angiogenesis score, mesenchymal transition (EMT) score, and mRNAsi score between high- and low-risk groups. *p < 0.05, **p < 0.01, ***p < 0.001; ****p<0.0001.
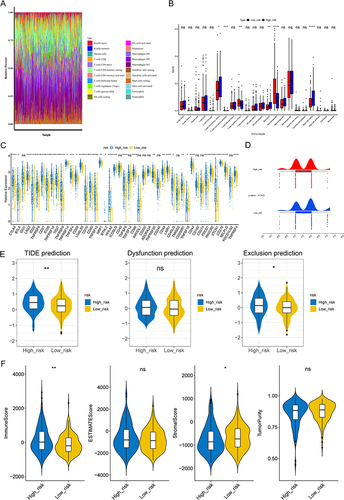
The Response to Immunotherapy Was Worse, and the Level of Immune Escape Were Higher in High-Risk Groups
There were six significantly different immune cells and 36 significantly different immune checkpoints in different risk groups. There was a significant increase in the expressions of activated memory CD4 T cells, regulatory T cells (Tregs), and macrophages M0 in high-risk groups (p < 0.05). However, there was a significant decrease in the expression of resting memory CD4 T cells, monocytes, and resting mast cells in high-risk groups ( and ). Additionally, all 36 immune checkpoints, with the exception of IDO2 and ICOSLG, were highly expressed in high-risk groups (p < 0.05) (). It is worth noting that the IPS score was lower, whereas the TIDE score was higher in high-risk groups ( and ). Based on these findings, high-risk groups experienced higher levels of immune escape as well as poorer responses to immunotherapy. Moreover, the stromal score and immune score were higher in high-risk groups, which indicated a lower tumor purity in these groups ().
Figure 5 Analysis of immune infiltration and immunotherapy between high- and low-risk groups. (A) The proportion of 22 immune cells in LIHC samples. (B) Discrepancies of immune cells between high- and low-risk groups. ns, not significant; *p<0.05; ** p<0.01; ***p<0.001; ****p<0.0001. (C) Comparison of 47 immune checkpoints expression between high- and low-risk groups. ns, not significant; *p<0.05; ** p<0.01; ***p<0.001; ****p<0.0001. (D and E) The discrepancies of immunophenscore (IPS) (D) and tumor immune dysfunction and exclusion (TIDE) score (E) between high- and low-risk groups. ns, not significant; *p<0.05; ** p<0.01. (F) Comparison of immune score, ESTIMATE score, stromal score, and tumor purity between high- and low-risk groups. *p < 0.05, **p < 0.01.
Expression Verification of Biomarkers
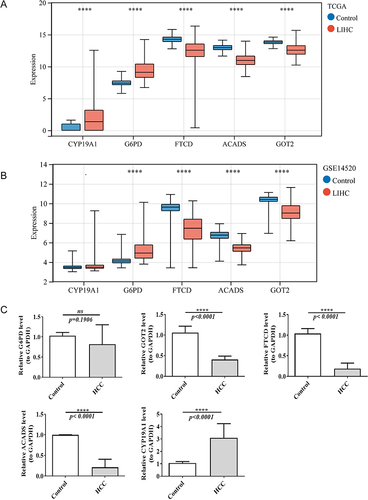
The expressions of ACADS, FTCD, and GOT2 were significantly lower, while the expressions of CYP19A1 and G6PD were significantly higher in HCC groups of TCGA database (p < 0.05). Furthermore, the expression trends of these biomarkers in GSE14520 were consistent with TCGA database ( and ). Besides, the qRT-PCR results also showed that ACADS, FTCD, and GOT2 were extremely significantly lowly expressed, while CYP19A1 was extremely significantly highly expressed in HCC samples (p < 0.001). These results were consistent with the results of our previous analyses in both TCGA-HCC dataset and GSE14520 ().
Figure 6 The expression of five biomarkers in LIHC and normal samples in TCGA dataset (A) and GSE14520 dataset (B). ****p<0.0001. (C) The mRNA expression of biomarkers in normal and HCC samples by real-time reverse transcription PCR (qRT-PCR). ns, not significant; ****p<0.0001.
Discussion
HCC treatment strategies vary from the stage of the disease and the underlying conditions, and patients with similar disease phenotypes might have different molecular etiologies, which could lead to the uniqueness of treatment responses. The categorization of patients according to their molecular characteristics would be beneficial to the construction of the most accurate treatment predicting models.Citation27 Nevertheless, in-depth studies have enhanced our understanding of the role of propionate metabolism in cancer progression.Citation28–30
In this study, we found out 132 DE-PMRGs associated with steroid and organic acid metabolic process. KangCitation31 also pointed out that the DEGs in HCC mainly included steroid metabolic process, which is consistent with our study. DengCitation32 proposed a new approach to HCC from the standpoint of the glycolysis and cholesterol synthesis axis and predicted its prognosis. In addition, our study also pointed out that these 132 DE-PMRGs were associated with the degradation of valine, leucine, and isoleucine, and carbon metabolism. The catabolism of amino acids is primarily carried out in the liver, and the amino acid metabolism starts from the tricarboxylic acid cycle and glycolytic pathway. Additionally, cancer cells are characterized by an enhanced glycolysis rate.Citation33 WangCitation34 also noted that DEGs between high- and low-risk HCC patients played a key role in cell metabolism, especially organic acids, inorganic acids, and lipid metabolism, which is consistent with our study.
ACADS, CYP19A1, FTCD, G6PD, and GOT2 were screened and identified as biomarkers of HCC. Based on the expression heatmap of biomarkers, it is evident that CYP19A1 and G6PD exhibit higher expression levels in the high-risk group, whereas ACADS, FTCD, and GOT2 show elevated expression in the low-risk group. This observation aligns with the univariate Cox analysis where CYP19A1 and G6PD exhibit hazard ratios (HR) greater than 1, while ACADS, FTCD, and GOT2 consistently display HR values less than 1. In conclusion, CYP19A1 and G6PD are considered risk factors within the context of Hepatocellular Carcinoma (HCC), whereas ACADS, FTCD, and GOT2 are regarded as protective factors.ACADS could be considered a biomarker of HCC, and it was associated with methylation and might be associated with proliferation and metastasis.Citation35 Polymorphisms in CYP19A1 were associated with HCC and promoted prostate stem cell proliferation and metastatic homing.Citation36 As a tumor suppressor gene, FTCD plays a key role in the pathogenesis and progression of HCC in tumor tissues.Citation37 Inhibition of ferroptosis by G6PD was associated with increased proliferation, migration, and invasion of HCC cells.Citation38 Research has demonstrated that GOT2 expression is down-regulated in HCC tissues, and GOT2 knockdown promotes proliferation, migration, and invasion in HCC cells.Citation39 In summary, this study has identified five biomarkers through bioinformatics methods that may be associated with the occurrence and progression of Hepatocellular Carcinoma (HCC). These findings hold the potential to offer novel targets for improving the prognosis and treatment of HCC patients. Naturally, we will continue to monitor the roles of these genes within HCC and further delve into their underlying mechanisms.Immune infiltration results in a weakened tumor immunity, EMT, stromal cell alterations, tumor angiogenesis, and metabolic changes in TME. As a result of these changes, the tumor proliferates, invades, and metastasizes, evading the immune system and resisting treatment.Citation40–43 An immune cell infiltrating a tumor could influence the microenvironment, and its presence is indicative of the success of immunotherapy. TIDE and ESTIMATE are two computational tools used to predict and infer immune response and potential response to immunotherapy. According to previous studies,Citation44 T/B cells were detected in HCC tissue, whereas immune negative regulatory cells from high-risk cohorts were found infiltrating significantly. The high- and low-risk groups exhibited differences in the expressions of 36 immune checkpoints based on a comprehensive analysis of 47 immune checkpoints. A higher level of tumor immune evasion was observed in the high-risk population, which indicated a more adverse outcome. In the following analyses, we found that the cohort that was at a heightened risk had higher TIDE scores, stromal scores, ARG scores, invasion scores, EMT scores, and mRNAsi scores. The high-risk group exhibited a greater degree of immune scores, which indicated a greater level of immune cell infiltration. A significant association has been established between elevated IS and a longer PFS and OS following HCC.Citation45 PD-1 (programmed cell death protein 1) is an immune checkpoint that plays a role in down-regulating the immune system by preventing the activation of T cells. CD8+ T cells are a type of immune cell that can kill cancer cells. It has been shown that a high fraction of PD-1 hi CD8+ T cells in TME is positively associated with treatment response and patient survival in cases of cancer treated with PD-1 blockade.Citation46 A poor prognosis has been demonstrated in HCC patients who have PD1Hi or TIM3+ PD1Hi CD8+ T cells. Based on preclinical HCC models, a personalized neoantigen vaccine combined with PD-1 blockade increased the infiltration of CD8+ memory T cells.Citation47 According to our hypothesis, increased tumor immune attenuation might result from propionate-mediated modifications in the phenotype of immune cells. Additionally, propionate promoted a higher expression of immune checkpoints, modified the transition of tumor epithelial mesenchymal cells, triggered changes in stromal cells, and stimulated tumor angiogenesis. These results suggested that tumors are more invasive and less responsive to treatment in the high-risk group. Nevertheless, the presence of significant T/B cell infiltration and elevated IP scores indicate a greater possibility for the collaborative amplification of antitumor treatment approaches of high-risk HCC patients compared with patients with minimal lymphoid immune cell infiltration. Future research might be able to address the findings of this study.
Several limitations should be considered in this study. TCGA and GSE14520 revealed that most cases did not have a B-related hepatitis history. Studies of this type may exclude patients with hepatitis B-related HCC from other areas with distinct genetic phenotypes and clinical characteristics, making them susceptible to bias. Although these five genes have been annotated through computational approaches, further research is required to elucidate the mechanisms whereby these genes contribute to the development of HCC.
Conclusion
Based on the TCGA and GEO databases, we have identified a gene signature associated with the metabolism of propionate that could be used to classify the prognosis of HCC patients. It might be possible to use this method for the management of HCC patients as well as for individualized treatment planning.
Abbreviations
HCC, Hepatocellular carcinoma; BCLC, Barcelona Clinic Liver Cancer; PMRG, Propionate Metabolism Related Genes; DE-PMRGs, differentially expressed PMRGs; TMS, Tumor Microenvironment; TCGA, The Cancer Genome Atlas; GEO, Gene Expression Omnibus; LASSO, Least Absolute Shrinkage and Selection Operator; ROC, Receiver Operating Characteristic; DCA, Decision Curve Analysis; ROC, Receiver Operating Characteristic; GSEA, Gene Set Enrichment Analysis; EMT, Epithelial–Mesenchymal Transition; IPS, Immunophenoscore; TIDS, Tumor Immune Dysfunction and Exclusion; ESTIMATE, Estimation of STromal and Immune cells in MAlignant Tumor tissues using Expression data; qRT-PCR, quantitative Real-Time Polymerase Chain Reaction; ACADS, Acyl-CoA Dehydrogenase Short Chain; FTCD, Formimidoyltransferase Cyclodeaminase; GOT2, glutamic-oxaloacetic transaminase 2; CYP19A1, cytochrome P450 family 19 subfamily A member 1; G6PD, glucose-6-phosphate dehydrogenase.
Patient Consent Statement
We adhere to the 1964 《 Declaration of Helsinki 》 and subsequent amendments or similar ethical standards. And we confirm that all clinical data contained in this study have been anonymous or confidential.
Disclosure
The authors of this manuscript declare no relationships with any companies whose products or services may be related to the article’s subject matter.
Acknowledgments
We thank Home for Researchers editorial team (www.home-for-researchers.com) for language editing service. We want to thank the whole study team at 3 Hospitals (Huaihe Hospital of Henan University, Henan Cancer Hospital and General Hospital of CPLA) for their continuous support.
Additional information
Funding
References
- Sung H, Ferlay J, Siegel RL, et al. Global cancer statistics 2020: GLOBOCAN estimates of incidence and mortality worldwide for 36 cancers in 185 countries. CA Cancer J Clin. 2021;71(3):209–249. doi:10.3322/caac.21660
- Vogel A, Meyer T, Sapisochin G, Salem R, Saborowski A. Hepatocellular carcinoma. Lancet. 2022;400(10360):1345–1362.
- Reig M, Forner A, Rimola J, et al. BCLC strategy for prognosis prediction and treatment recommendation: the 2022 update. J Hepatol. 2022;76(3):681–693. doi:10.1016/j.jhep.2021.11.018
- Halarnkar PP, Blomquist GJ. Comparative aspects of propionate metabolism. Comp Biochem Physiol B. 1989;92(2):227–231.
- Santos LPA, Assuncao LDP, Lima PS, et al. Propionate metabolism in a human pathogenic fungus: proteomic and biochemical analyses. IMA Fungus. 2020;11:9. doi:10.1186/s43008-020-00029-9
- Gomes AP, Ilter D, Low V, et al. Altered propionate metabolism contributes to tumour progression and aggressiveness. Nat Metab. 2022;4(4):435–443. doi:10.1038/s42255-022-00553-5
- Westerholm M, Calusinska M, Dolfing J. Syntrophic propionate-oxidizing bacteria in methanogenic systems. FEMS Microbiol Rev. 2022;46(2). doi:10.1093/femsre/fuab057
- Mima K, Nishihara R, Qian ZR, et al. Fusobacterium nucleatum in colorectal carcinoma tissue and patient prognosis. Gut. 2016;65(12):1973–1980. doi:10.1136/gutjnl-2015-310101
- Yoshida H, Ishii M, Akagawa M. Propionate suppresses hepatic gluconeogenesis via GPR43/AMPK signaling pathway. Arch Biochem Biophys. 2019;672:108057. doi:10.1016/j.abb.2019.07.022
- Lu X, Qiao S, Peng C, et al. Bornlisy attenuates colitis-associated colorectal cancer via inhibiting GPR43-mediated glycolysis. Front Nutr. 2021;8:706382. doi:10.3389/fnut.2021.706382
- Ritchie ME, Phipson B, Wu D, et al. limma powers differential expression analyses for RNA-sequencing and microarray studies. Nucleic Acids Res. 2015;43(7):e47. doi:10.1093/nar/gkv007
- Wu T, Hu E, Xu S, et al. ClusterProfiler 4.0: a universal enrichment tool for interpreting omics data. Innovation. 2021;2(3):100141. doi:10.1016/j.xinn.2021.100141
- Therneau TM, Grambsch PM. Modeling Survival Data: Extending the Cox Model. New York: Springer; 2000.
- Gordon M, Lumley T. Advanced forest plot using ‘grid’ graphics [R package forestplot version 1.10.1]; 2020.:
- Engebretsen S, Bohlin J. Statistical predictions with glmnet. Clin Epigenetics. 2019;11(1):123. doi:10.1186/s13148-019-0730-1
- Tang S, Jing H, Huang Z, et al. Identification of key candidate genes in neuropathic pain by integrated bioinformatic analysis. J Cell Biochem. 2020;121(2):1635–1648. doi:10.1002/jcb.29398
- Alboukadel Kassambara MK. Survminer: drawing survival curves using ‘ggplot2’. R package version 0.4.9. Available from: https://CRAN.R-project.org/package=survminer. Accessed September 29, 2023.
- Saha-Chaudhuri PJ. Survivalroc: time-dependent ROC curve estimation from censored survival data. R package version 1.0.3. Available from: https://CRAN.R-project.org/package=survivalROC. Accessed September 29, 2023.
- Liang L, Li J, Yu J, et al. Establishment and validation of a novel invasion-related gene signature for predicting the prognosis of ovarian cancer. Cancer Cell Int. 2022;22(1):118. doi:10.1186/s12935-022-02502-4
- Kong W, Mao Z, Han C, et al. A novel epithelial-mesenchymal transition gene signature correlated with prognosis, and immune infiltration in hepatocellular carcinoma. Front Pharmacol. 2022;13:863750. doi:10.3389/fphar.2022.863750
- Tao D, Wang Y, Zhang X, et al. Identification of angiogenesis-related prognostic biomarkers associated with immune cell infiltration in breast cancer. Front Cell Dev Biol. 2022;10:853324. doi:10.3389/fcell.2022.853324
- Hanzelmann S, Castelo R, Guinney J. GSVA: gene set variation analysis for microarray and RNA-seq data. BMC Bioinform. 2013;14:7. doi:10.1186/1471-2105-14-7
- Malta TM, Sokolov A, Gentles AJ, et al. Machine learning identifies stemness features associated with oncogenic dedifferentiation. Cell. 2018;173(2):338–354 e15. doi:10.1016/j.cell.2018.03.034
- Barriga V, Kuol N, Nurgali K, Apostolopoulos V. The complex interaction between the tumor micro-environment and immune checkpoints in breast cancer. Cancers. 2019;11(8):Aug. doi:10.3390/cancers11081205
- Wang J, Kang Z, Liu Y, Li Z, Liu Y, Liu J. Identification of immune cell infiltration and diagnostic biomarkers in unstable atherosclerotic plaques by integrated bioinformatics analysis and machine learning. Front Immunol. 2022;13:956078. doi:10.3389/fimmu.2022.956078
- Li S, Dong C, Chen J, Gao X, Xie X, Zhang X. Identification of an immune checkpoint gene signature that accurately predicts prognosis and immunotherapy response in endometrial carcinoma. Aging. 2021;13(12):16696–16712. doi:10.18632/aging.203189
- Chidambaranathan-Reghupaty S, Fisher PB, Sarkar D. Hepatocellular carcinoma (HCC): epidemiology, etiology and molecular classification. Adv Cancer Res. 2021;149:1–61. doi:10.1016/bs.acr.2020.10.001
- Sun J, Ding J, Shen Q, et al. Decreased propionyl-CoA metabolism facilitates metabolic reprogramming and promotes Hepatocellular carcinoma. J Hepatol. 2023;78(3):627–642. doi:10.1016/j.jhep.2022.11.017
- Abdalkareem Jasim S, Jade Catalan Opulencia M, Alexis Ramirez-Coronel A, et al. The emerging role of microbiota-derived short-chain fatty acids in immunometabolism. Int Immunopharmacol. 2022;110:108983. doi:10.1016/j.intimp.2022.108983
- Liu P, Wang Y, Yang G, et al. The role of short-chain fatty acids in intestinal barrier function, inflammation, oxidative stress, and colonic carcinogenesis. Pharmacol Res. 2021;165:105420. doi:10.1016/j.phrs.2021.105420
- Kang X, Bai L, Qi X, Wang J. Screening and identification of key genes between liver Hepatocellular carcinoma (LIHC) and cholangiocarcinoma (CHOL) by bioinformatic analysis. Medicine. 2020;99(50):e23563. doi:10.1097/MD.0000000000023563
- Deng W, Zhu P, Xu H, Hou X, Chen W. Classification and prognostic characteristics of hepatocellular carcinoma based on glycolysis cholesterol synthesis axis. J Oncol. 2022;2022:2014625. doi:10.1155/2022/2014625
- Lee YK, Lim JJ, Jeoun UW, et al. Lactate-mediated mitoribosomal defects impair mitochondrial oxidative phosphorylation and promote hepatoma cell invasiveness. J Biol Chem. 2017;292(49):20208–20217. doi:10.1074/jbc.M117.809012
- Wang X, Li Y, Shi Y, et al. Comprehensive analysis to identify the neurotransmitter receptor-related genes as prognostic and therapeutic biomarkers in Hepatocellular carcinoma. Front Cell Dev Biol. 2022;10:887076. doi:10.3389/fcell.2022.887076
- Aeffner F, Zarella MD, Buchbinder N, et al. Introduction to digital image analysis in whole-slide imaging: a white paper from the digital pathology association. J Pathol Inform. 2019;10:9. doi:10.4103/jpi.jpi_82_18
- Hong L, Zhou Y, Xie X, et al. A stemness-based eleven-gene signature correlates with the clinical outcome of Hepatocellular carcinoma. BMC Cancer. 2021;21(1):716. doi:10.1186/s12885-021-08351-0
- Chen J, Chen Z, Huang Z, Yu H, Li Y, Huang W. Formiminotransferase cyclodeaminase suppresses hepatocellular carcinoma by modulating cell apoptosis, DNA damage, and phosphatidylinositol 3-kinases (PI3K)/Akt signaling pathway. Med Sci Monit. 2019;25:4474–4484. doi:10.12659/MSM.916202
- Cao F, Luo A, Yang C. G6PD inhibits ferroptosis in Hepatocellular carcinoma by targeting cytochrome P450 oxidoreductase. Cell Signal. 2021;87:110098. doi:10.1016/j.cellsig.2021.110098
- Li Y, Li B, Xu Y, et al. GOT2 silencing promotes reprogramming of glutamine metabolism and sensitizes Hepatocellular carcinoma to glutaminase inhibitors. Cancer Res. 2022;82(18):3223–3235. doi:10.1158/0008-5472.CAN-22-0042
- Bergers G, Fendt SM. The metabolism of cancer cells during metastasis. Nat Rev Cancer. 2021;21(3):162–180. doi:10.1038/s41568-020-00320-2
- Xue R, Zhang Q, Cao Q, et al. Liver tumour immune microenvironment subtypes and neutrophil heterogeneity. Nature. 2022;612(7938):141–147. doi:10.1038/s41586-022-05400-x
- Hanahan D. Hallmarks of cancer: new dimensions. Cancer Discov. 2022;12(1):31–46. doi:10.1158/2159-8290.CD-21-1059
- Li X, Ramadori P, Pfister D, Seehawer M, Zender L, Heikenwalder M. The immunological and metabolic landscape in primary and metastatic liver cancer. Nat Rev Cancer. 2021;21(9):541–557. doi:10.1038/s41568-021-00383-9
- Zheng C, Zheng L, Yoo JK, et al. Landscape of infiltrating T cells in liver cancer revealed by single-cell sequencing. Cell. 2017;169(7):1342–1356 e16. doi:10.1016/j.cell.2017.05.035
- Sun C, Xu J, Song J, et al. The predictive value of centre tumour CD8(+) T cells in patients with Hepatocellular carcinoma: comparison with immunoscore. Oncotarget. 2015;6(34):35602–35615. doi:10.18632/oncotarget.5801
- Yang Z, Deng Y, Cheng J, Wei S, Luo H, Liu L. Tumor-infiltrating PD-1(hi)CD8(+)-T-cell signature as an effective biomarker for immune checkpoint inhibitor therapy response across multiple cancers. Front Oncol. 2021;11:695006. doi:10.3389/fonc.2021.695006
- Chen H, Li Z, Qiu L, et al. Personalized neoantigen vaccine combined with PD-1 blockade increases CD8(+) tissue-resident memory T-cell infiltration in preclinical Hepatocellular carcinoma models. J Immunother Cancer. 2022;10(9):Sep. doi:10.1136/jitc-2021-004389