
Abstract
Purpose
To develop and compare various machine learning (ML) classifiers that employ radiomics extracted from contrast-enhanced magnetic resonance imaging (CEMRI) for diagnosing pathological differentiation of hepatocellular carcinoma (HCC), and validate the performance of the best model.
Methods
A total of 251 patients with HCCs (n = 262) were assigned to a training (n = 200) cohort and a validation (n = 62) cohort. A collection of 5502 radiomics signatures were extracted from the CEMRI images for each HCC nodule. To reduce redundancy and dimensionality, Spearman rank correlation, minimum redundancy maximum relevance (mRMR), and the least absolute shrinkage and selection operator (LASSO) approach were employed. Eight ML classifiers were trained to obtain the best radiomics model. The performance of each model was evaluated based on the area under the receiver operating characteristic curve (AUC). The radiomics model was integrated with liver imaging reporting and data system (LI-RADS) features to design a combined model.
Results
The eXtreme Gradient Boosting (XGBoost)-based radiomics model outperformed other ML classifiers in evaluating pHCC, achieving an AUC of 1.00 and accuracy of 1.00 in the training cohort. The LI-RADS model demonstrated an AUC value of 0.77 and 0.82 in the training and validation cohorts. The combined model exhibited best performance in both the training and validation cohorts, with AUCs of 1.00 and 0.86 for evaluating HCC differentiation, respectively.
Conclusion
CEMRI radiomics integrating LI-RADS features demonstrated excellent performance in evaluating HCC differentiation, suggesting an optimal clinical decision tool for individualized diagnosis of HCC differentiation.
Introduction
Hepatocellular carcinoma (HCC) accounts for approximately 75–85% of all primary liver malignancies, ranking it as the sixth most common cancer worldwide and a major cause of cancer-related mortality.Citation1,Citation2 Poor tumor differentiation is a well-established prognostic factor associated with higher rates of postoperative recurrence (up to 50–70%) and worse survival outcomes in patients undergoing curative therapy for HCC.Citation3,Citation4 Liver biopsy is currently served as the gold standard for preoperative diagnosis of HCC differentiation, but it is accompanied by several complications including invasiveness and potential sampling bias.Citation5 Consequently, there is an urgent requirement for accurate and noninvasive methods to predict HCC differentiation.
Radiomics enables a comprehensive evaluation of intratumoral heterogeneity on a millimeter scale by extracting numerous quantitative signatures, thereby demonstrating significant capability in assessing the biological characteristics of HCC.Citation6 Contrast-enhanced magnetic resonance imaging (CEMRI) has proven to be crucial in noninvasive HCC characterization, offering excellent soft-tissue resolution and better representation of the actual heterogeneity of HCC compared to other imaging modalities.Citation7,Citation8 Therefore, it is possible to speculate that a CEMRI-based radiomics model might enhance the accuracy of HCC differentiation. Furthermore, machine learning (ML) algorithms provide an artificial intelligence approach to automatically establish more effective decision-making models using radiomics features. Various ML classifiers have recently been applied to assist clinicians for treatment planning and prognosis assessment in cancer patients.Citation9 However, the use of ML classifiers for CEMRI-based radiomics in evaluating HCC differentiation has yet to be explored and compared.
The Liver Imaging Reporting and Data System (LI-RADS) offers a comprehensive framework for evaluating key features associated with HCC, which has promising value in diagnosing HCC, predicting microvascular invasion, and assessing treatment response.Citation10 Therefore, one of the aims of our study was to identify MRI LI-RADS features that could potentially serve as indicators of HCC differentiation. However, as far as we know, there is a scarcity of developed models that combine ML-based CEMRI radiomics with LI-RADS features for evaluating HCC differentiation.
The purpose of this study was to establish and compare the performance of CEMRI-based radiomics model using different ML classifiers for predicting HCC differentiation and to validate the most effective model. Furthermore, an investigation was conducted to explore a combined model that incorporated both radiomics and LI-RADS features.
Materials and Methods
Patients Selection
This study received approval from the Institutional Ethics Committee of third affiliated hospital of Soochow University and informed consent was not required from the included participants (2022-CL027-01). A retrospective analysis was conducted on a total of 273 consecutive patients who underwent preoperative MRI examinations between January 2017 and May 2023 and were subsequently diagnosed with HCC after surgery. Patients who met any of the following criteria were excluded: 1) HCC-related therapies, such as radiofrequency ablation or transarterial chemoembolization, prior to MRI scanning (n = 6); 2) Patients with incomplete MRI examinations, or poor MRI image quality due to breathing motion artifacts, were deemed incompatible with radiomics analysis (n = 7); 3) Differentiation reports were not included (n = 9). In total, 251 patients were ultimately included and randomly assigned to either the training or validation cohort in chronological order, while maintaining a ratio of 8:2.
Pathological Differentiation Analysis
The liver specimens were stained with hematoxylin and eosin (HE) staining to determine HCC differentiation by an experienced pathologist who was unaware of the preoperative findings. According to the 2019 WHO classification,Citation11 the differentiation was classified into well differentiated, moderately differentiated, and poorly differentiated HCC (pHCC). For HCC nodules that exhibited multiple types of differentiation, the final diagnosis was based on the most predominant differentiation observed in the tumor tissue. Specifically, we classified both well differentiated and moderately differentiated HCC as non-poorly differentiated HCC (npHCC).
MRI Protocol and Features Interpretation
The 3.0-T MRI scanner, Magnetom Verio (Siemens Healthineers, Germany), was utilized for imaging. The following sequences were performed: 1) in-phase and out-phase T1-weighted imaging (T1WI); 2) T2-weighted imaging (T2WI); 3) diffusion-weighted imaging (DWI) in echo planar imaging with a b value of 0 and 800 s/mm2; 4) DCE-MRI: a total of 0.2 mL/kg of Gd-DTPA (Magnevist, Bayer, Germany) was injected at a rate of 1 mL/s for bolus tracking. 3D volumetric interpolated breath-hold examination (VIBE) techniques were employed to acquire images in the arterial phase (AP, 25~35 s), portal venous phase (PVP, 60~70 s), and delayed phase (DP, 180 s). The entire DCE-MRI scan lasted for approximately 3~4 minutes. Detailed information on the sequences and parameters can be found in Table S1.
According to the LI-RADS criteria (Version 2018),Citation10 MRI features were interpreted by two radiologists with seven and twelve years of experience in liver imaging, respectively. Both radiologists were blinded to the pathological results, and any inconsistencies were resolved by consensus. The following features were collected: (a) major features: nonrim arterial-phase hyperenhancement (NAPHE), nonperipheral washout, enhancing capsule; (b) nodule-in-nodule, mosaic architecture, blood products or higher fat content in HCC, nonenhancing capsule, which are particular auxiliary features of HCC; (c) auxiliary features favoring malignancy but not HCC in specific, mild-to-moderate T2 hyperintensity, delayed phase hypointensity, iron sparing in the tumor, corona enhancement; (d) baseline features: HCC number, size, margin, shape.
Imaging Preprocessing and Radiomics Signatures Extraction
Before region of interest (ROI) delineation, N4 bias correction, resampling at a voxel spacing of 1*1*1 mm3, and grayscale normalization are sequentially performed to eliminate the inhomogeneity of magnetic field intensity, compensate for voxel spatial differences, and maintain grayscale consistency, respectively. Then, all preprocessed CEMRI (AP, PVP, DP) images were imported into ITK-SNAP software (version 3.8.0). Radiologist 1 manually delineated the tumor boundary on each consecutive transverse slice of the images, and a 3D-ROI was automatically generated. During the 3D-ROI segmentation process, it was important to ensure that the entire tumor volume was encompassed while excluding any perfusion disorders or noticeable satellite lesions. Additionally, 30 HCC lesions were randomly selected for both Radiologist 1 and Radiologist 2 to delineate the ROI again.
The Pyradiomics package (Version 2.1.2) was utilized to extract a set of radiomics signatures, including (a) first-order (n = 360), shape (n = 14), (b) gray-level cooccurrence matrix (GLCM) (n = 440), (c) gray-level dependence matrix (GLDM) (n = 280), (d) gray level run length matrix (GLRLM) features (n = 320), (e) gray-level size zone matrix (GLSZM) (n = 320), (f) neighboring gray tone difference matrix (NGTDM) (n = 100). Consequently, a total of 5502 signatures were obtained from each HCC nodule, as 1834 signatures were extracted from each CEMRI sequence. To reduce interference among the radiomics dimensions, all extracted signatures were normalized using the Z-score approach.
Radiomics Model Development and Machine Learning Classifiers
A three-step procedure was sequentially implemented to identify optical signatures. First, the Spearman rank correlation was used to exclude signatures with a correlation coefficient higher than 0.9, thus reducing redundancy. Second, a tenfold cross-validation was employed with the least absolute shrinkage and selection operator (LASSO) approach for identifying the most accurate signatures with nonzero coefficients, determined by an optimal penalty parameter (λ) based on the minimum criteria. Third, the maximum relevance minimum redundancy (mRMR) approach was utilized to reduce dimensionality by maximizing the correlation between retained signatures.
By calculating and combining selected optical signatures with different algorithms, the logistic regression (LR), support vector machine (SVM), K-nearest neighbor (KNN), random forest (RF), ExtraTrees, eXtreme Gradient Boosting (XGBoost), light gradient boosting machine (LightGBM) and multilayer perceptron (MLP) classifiers were applied to develop eight risk stratification models for evaluating pHCC. To identify the best-performing ML model, the diagnostic ability of each model in evaluating pHCC was compared. After selecting the best model, the optical signatures were weighted and combined based on their respective coefficients to diagnose pHCC using the chosen classifier, contributing to the establishment of a robust radiomics model. The model was trained using the training cohort statistics and tested on the validation cohort.
Combined Model Development and Verification
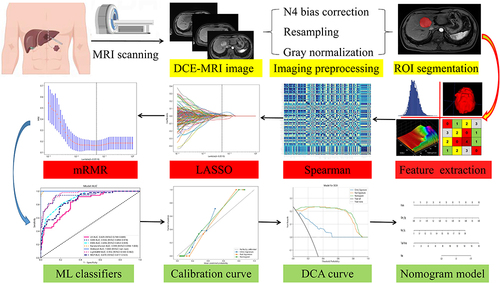
The significant MRI LI-RADS features, decided by intra-group statistical comparison, along with the radiomics signatures, were combined to develop a nomogram model. To assess the net clinical benefits and goodness-of-fit of the nomogram model in predicting pHCC, a decision curve analysis (DCA) and calibration curve with the Hosmer‒Lemeshow test were performed. In the DCA curve, the red solid line represents the performance of the nomogram, the efficacy of the nomogram model is considered better when the red line is closer to the diagonal dashed line. Additionally, the nomogram model demonstrated improved net clinical benefits for evaluating pHCC when the nomogram model curve was higher than either the “treat all” or “treat none” across a full range of reasonable threshold probabilities. The detailed flowchart, illustrating the process from DEC-MRI scanning to nomogram model development, is shown in .
Figure 1 Detailed flowchart from DCE-MRI scanning to nomogram model development.
Statistical Analysis
Statistical analyses were performed with R software (version 4.0). Categorical data are listed as the percentage or median (interquartile range) after normality test with the Shapiro–Wilk method, and continuous variables are presented as the mean ± standard deviation (SD). Intraclass correlation coefficient (ICC) was used to analyze inter- and intra-reader variability. Mann‒Whitney U or chi-square (χ2) tests were used to detect differences between pHCC and npHCC. The diagnostic performance for predicting pHCC was evaluated using a receiver operating characteristic (ROC) curve, sensitivity, specificity, accuracy, and area under the ROC curve (AUC). In addition, the Delong method was adopted to compare the differences in AUC values produced by the various models. In each of the tests, statistical significance was achieved when the two-tailed P value <0.05.
Results
Patient Characteristics and Pathological Differentiation
There were 251 patients (male/female: 201/50, aged 62.6±10.4 years) with 262 HCCs (eleven patients presented two HCCs), confirmed by pathology results who underwent preoperative MRI examination and were included and randomly classified into a training cohort (201 patients and 210 HCCs) and a validation cohort (50 patients and 52 HCCs). Among the included 262 HCCs, 50 (23.8%) and 160 (76.2%) were diagnosed as pHCC and npHCC in the training cohort, they were 12 (23.1%) and 40 (76.9%) in the validation cohort, respectively. The training and validation cohorts were comparable in terms of age, sex, etiology, alpha-fetoprotein (AFP), alanine aminotransferase (ALT), aspartate aminotransferase (AST), total bilirubin (TB), prothrombin time (PT), Child-Pugh grade, performance status (PS), Barcelona clinical liver cancer (BCLC) stage, HCC number and differentiation. The detailed baseline characteristics are shown in .
Table 1 Baseline Characteristics of Included Patients Diagnosed with HCC
Radiomics Signatures Selection
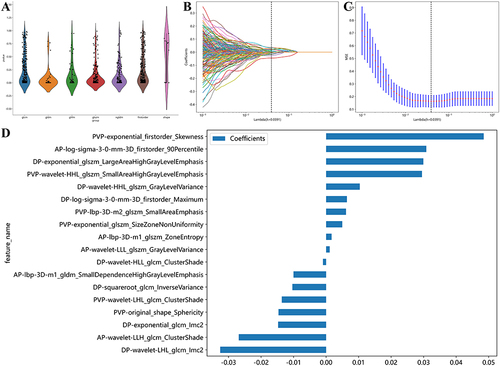
The inter- and intrareader variability for radiomics signatures was 0.88 (95% CI: 0.81–0.93) and 0.91 (95% CI: 0.84–0.95), respectively. After removing redundant radiomic parameters with Spearman correlation coefficients greater than 0.90 (), a total of 305, 313, and 318 signatures were retained from AP, PVP, and DP, respectively. Upon applying mRMR () and the LASSO approach () for further dimension reduction and redundancy removal, a total of eighteen highly robust signatures () were selected and retained to train the ML classifier models (Table S2).
Figure 2 The distribution plot of retained radiomics signatures after Spearman rank correlation (A). Using the LASSO method with tenfold cross-validation based on the minimum binomial deviation, the most valuable signatures with nonzero coefficients were identified (B). At lambda (λ) = 0.0391, eighteen signatures identified by mRMR method were demonstrated (C). The weighted importance of the selected eighteen signatures (D).
Comparison of Various ML Classifiers Models
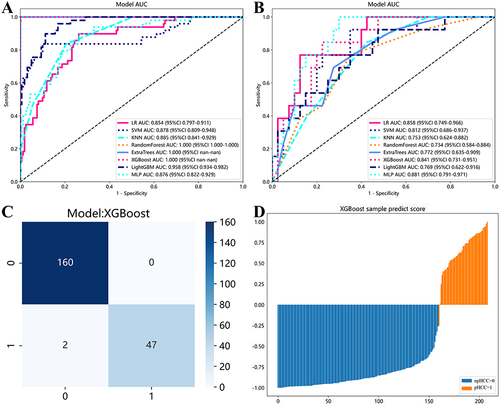
The AUCs of different ML classifiers in diagnosing pHCC ranged from 0.85 to 1.00 in the training cohort and from 0.73 to 0.88 in the validation cohort. Among the eight ML classifiers, the XGBoost model achieved the highest AUC (1.00) and accuracy (1.00), followed by Extratrees (AUC = 1.00, accuracy = 1.00), RF (AUC = 1.00, accuracy = 0.995), LightGBM (AUC = 0.96, accuracy = 0.86), SVM (AUC = 0.88, accuracy = 0.88), KNN (AUC = 0.89, accuracy = 0.80), MLP (AUC = 0.88, accuracy = 0.76), and LR (AUC = 0.85, accuracy = 0.78). The detailed information of various ML classifiers for diagnosing pHCC is provided in and illustrated in .
Table 2 Various Machine Learning Classifiers for Diagnosing pHCC
Figure 3 The ROC curve of eight machine learning classifiers in diagnosing HCC differentiation in the training (A) and validation (B) cohorts. The confusion matrix (C) and sample prediction histogram (D) of XGBoost classifier in evaluating HCC differentiation.
MRI LI-RADS Features Model
As presented in , larger tumor size, nonsmooth margin, mosaic architecture, intratumoral blood products, and corona enhancement were identified as significant risk factors associated with pHCC. The LI-RADS model, which combines these five significant MRI features, demonstrated an accuracy of 0.72, sensitivity of 0.69, specificity of 0.73, and an AUC value of 0.77 (95% CI: 0.70–0.83) in the training cohort. In the validation cohort, the corresponding values were 0.68, 0.92, 0.60, and 0.82 (95% CI: 0.70–0.94).
Table 3 MRI Features of Each HCC Nodule
Combined Model Establishment and Verification
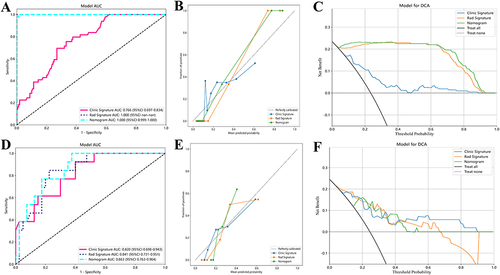
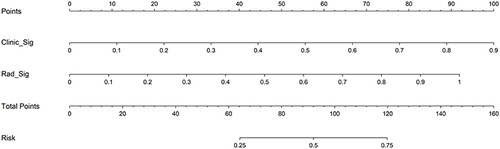
The nomogram model that incorporated XGBoost-based Rad-signatures and significant MRI LI-RADS features demonstrated an AUCs value of 1.00 (95% CI: 0.99–1.00) and 0.86 (95% CI: 0.76–0.96), for evaluating pHCC in the training and validation cohorts, respectively, shown in ( and ). The calibration curves indicated that three models (Radiomics, LI-RADS, nomogram) presented good agreement in both training and validation cohorts ( and ). Furthermore, the DCA results suggested that the nomogram model curve was higher than either “treat all” (pHCC, solid black line) or “treat none” (npHCC, virtual black line) across a full range of reasonable threshold probabilities, suggesting that the nomogram model has improved clinical benefits in individualized clinical decision-making for HCC differentiation ( and ).
Figure 4 The ROC curve, calibration curve, and DCA curve of three models in evaluating HCC differentiation in the training (A–C) and validation (D–F) cohorts, respectively. The radiomics model presented higher diagnostic accuracy, better goodness-of-fit and improved net clinical benefits in the training cohort.
Comparison of Diagnostic Ability Among Different Models
The radiomics model demonstrated a significantly higher AUC compared to the LI-RADS model’s: 1.00 vs 0.77 (P<0.05) in the training cohort, 0.79 vs 0.68 (P<0.05) in the validation cohort, indicating the improved discriminative ability of radiomics model in diagnosing pHCC. Furthermore, the nomogram model () demonstrated superior performance, with AUCs of 1.00 and 0.86, respectively, indicating the stronger ability of the nomogram model in the prediction of HCC differentiation.
Figure 5 The nomogram model for diagnosing HCC differentiation.
Discussion
To identify the most effective and noninvasive approach for predicting HCC differentiation, we established and validated a CEMRI-based radiomics model with various ML classifiers. Our study concluded that the CEMRI-radiomics model, specifically when utilizing the XGBoost classifier, exhibited excellent diagnostic ability with an AUC of 1.00 in diagnosing pHCC. More meaningfully, the nomogram model, which incorporated significant LI-RADS features and XGBoost-based signatures, demonstrated the best performance in both the training and validation cohorts, with high goodness-of-fit and improved net benefits in diagnosing pHCC.
The majority of HCC cases are typically diagnosed at an advanced stage with a poor prognosis, consequently, this diminishes the viability of surgical resection as the primary treatment option for HCC. To improve the prognosis and effectiveness monitoring of HCC, clinical studies have explored programmed death-1 (PD-1) inhibitors with antiangiogenic therapy through TACE,Citation12 as well as the combination of radiotherapy with sorafenib.Citation13 These studies have shown promising therapeutic outcomes in cases of unresectable HCC, providing valuable guidance for selecting the most effective treatment approach for HCC in the future. Moreover, an increasing number of studies have been conducted to select more accurate biomarkers for predicting treatment response and survival prognosis in HCC patients by developing a nomogram model. For instance, both alkaline phosphatase (ALP)Citation14 and albumin-bilirubin (ALBI)Citation12 nomogram model demonstrated good performance for predicting survival rate for HCC. Similarly, Li et alCitation15 introduced an aspartate amino-transferase lymphocyte rate (ASR score) nomogram model, which presented valuable performance to predict the prognosis of HCC treated with TACE or TACE combined with systemic therapy. In this study, the nomogram model that combining CEMRI-based radiomics with LI-RADS features provides an optimal clinical decision approach for individualized clinical diagnosis of HCC differentiation, indicating the potential value of nomogram model.
By applying ML algorithms and statistical analysis to the extracted radiomics features, it becomes develop to create predictive models that capture the underlying characteristics and heterogeneity of tumors at a microscopic level. These radiomics models have the potential to differentiate hepatocellular carcinoma (HCC) from other liver lesions, evaluate tumor stage and progression, predict treatment response, and even provide prognostic information.Citation6,Citation16 Recently, several radiomics studies have been performed using hepatobiliary phase (HBP) to predict HCC differentiation. However, these studies demonstrated relatively lower AUC values,Citation17–19 ranging from 0.61 to 0.83, partly because only HBP-based radiomics was not sufficiently accurate in characterizing HCC heterogeneity. Moreover, both Brancato et alCitation20 and Yang et alCitation21 developed CEMRI-based radiomics models for predicting HCC, but the inclusion of a relatively limited number of patients (n = 38~188) and the extraction of a restricted number of radiomics signatures (38~108 per sequence) were likely to decrease the reliability of the study findings. Furthermore, no relevant studies have yet been conducted to compare the diagnostic differences using different ML classifiers in predicting HCC differentiation.
In our study, we observed that the CEMRI-based radiomics model showed higher AUCs and accuracies compared to previous studies, indicating it was able to optimally predict HCC differentiation. We speculate that our research findings may be attributed to the following two factors: 1) A large number (n = 5502) of quantitative radiomics signatures were extracted from the CEMRI images for each HCC nodule. Then, Spearman rank correlation, LASSO, mRMR approaches were employed to select the most robust signatures for developing the radiomics model. This comprehensive selection process possibly contributed to the higher AUC. 2) Comparison of eight ML classifiers, including regression, classification, and clustering algorithms. These classifiers were used to establish the most effective radiomics model, addressing both linear and nonlinear classification problems. In contrast, most previous studies solely employed linear models, leading to lower accuracy. The inclusion of diverse ML classifiers in our study enhanced the accuracy for diagnosing HCC differentiation. Therefore, our study suggests that a larger number of extracted radiomics signatures, combined with a variety of ML classifiers, can improve the accuracy of diagnosing HCC differentiation, which is useful for advancing the current understanding of radiomics model with ML classifiers.
Shinkawa et alCitation3 discovered that tumor size is a significant predictor related to the prognosis of recurrence and survival prognosis following HCC resection. This aligns with our study’s conclusion that a larger tumor size was shown to have a significantly higher incidence of pHCC, revealing that the biological behavior may worsen into increased aggressiveness, infiltrative growth, and destruction of the peritumoral capsule with tumor size.Citation22 The presence of nonsmooth margins in tumors was characterized by extranodular growth or the multinodular type on imaging. Additionally, tumors with nonsmooth margins often exhibited destruction of the tumor capsule and invasion of adjacent liver parenchyma, thus reflecting aggressive biological behavior and providing support for our study’s conclusion that nonsmooth margin is strongly associated with pHCC, which is consistent with the findings of Huang et al.Citation23
The mosaic architecture feature in tumors reflects various characteristics such as tumor viability, fatty infiltration, hemorrhage, necrosis, or copper deposition.Citation24 It is typically composed of random compartments or internal nodules within a tumor, which differ in terms of enhancement, attenuation, intensity, shape, size, and are separated by fibrous tissues. In our study, we observed the mosaic architecture feature more frequently in pHCC, mainly because it is associated with rapid disease progression, diverse biological heterogeneities, and a higher likelihood of vascular invasion. Furthermore, we identified corona enhancement, which refers to late AP or early PVP enhancement within the drainage vessels surrounding HCC. This enhancement is attributed to the venous drainage and indicates aggressive vascular invasion and intrahepatic metastases of HCC. Consistent with these findings, Liu et alCitation25 also identified corona enhancement as a risk factor for microvascular invasion in HCC.
Furthermore, the LI-RADS model provides valuable application for assessing pHCC and has proven to be fundamental in assisting radiologists in interpreting MRI naked-eyes features associated with pHCC. However, the radiomics model yielded significant higher AUCs of 1.00 for predicting pHCC, compared to LI-RADS model. This can be attributed to three following key factors: 1) HCC differentiation was evaluated based on the heterogeneous pathologies,Citation4,Citation11 including mitotic count, tumor differentiation, and necrosis; thus, radiomics has the advantage of accurately predicting pHCC as it provides a more comprehensive assessment of tumor heterogeneity. 2) Radiomics signatures, which are not visible to the naked eye in MRI features, serve as quantitative markers for biomedical applications and present a crucial role in characterizing the microscopic behavior of HCC. 3) This study carefully selected eighteen optimal radiomics signatures and combined them to construct the most effective model using eight ML classifiers with different algorithms, this approach was instrumental in improving the diagnostic performance.
The integration of clinical and radiomics factors has led to the development of computational assisted nomogram models, which have emerged as highly effective and easy-to-understand alternatives for evidence-based management of cancer patients. In the study conducted by Xu et alCitation26, a nomogram was developed that combined serum markers and CT-based radiomics outperformed both the radiomics model alone and the clinical model, making it the superior option for predicting microvascular invasion and stratifying prognosis in HCC patients. Kong et alCitation8 found that a nomogram model integrating clinical indicators and the radiomics presented increased AUCs of 0.86 to 0.88, in predicting tumor response to HCC following TACE. In this study, our developed nomogram model outperformed both the single radiomics and LI-RADS models in evaluating pHCC, with an accuracy of 1.00 and an AUC of 1.00, suggesting its high precision and discriminatory ability. Furthermore, the decision curve analysis (DCA) curve showed improved net clinical benefits, these findings highlight the potential of our nomogram model in enhancing clinical decision-making and improving individualized diagnosis of HCC differentiation.
There were several shortcomings should be addressed in our study. 1) In this retrospective study, we excluded several suspected HCC patients without pathology, who may have been removed due to the potential threat of TACE or RFA. This patient selection criteria could introduce selection bias and undermine the reliability of our study’s conclusions. Therefore, future prospective studies with larger cohorts from multiple centers are needed to validate the clinical application of our findings. 2) Considering that radiomics signatures were merely extracted from CEMRI images, it is possible that some significant signatures from DWI or T2WI might have been overlooked, through CEMRI images were deemed more representative of the actual heterogeneity of HCC.Citation7 3) Moreover, this study only focused on exploring the relationship between HCC differentiation and the radiomics model. Therefore, future investigations examining the correlation between the radiomics model and HCC recurrence and prognosis will undoubtedly enhance the clinical applicability of our findings.
Conclusion
In summary, our study revealed that CEMRI-based radiomics, specifically with the use of the XGBoost classifier, exhibited outstanding performance in evaluating HCC differentiation. More importantly, the integration of the radiomics model with the LI-RADS model in our nomogram model contributed to an optimal clinical decision tool for the individualized diagnosis of HCC differentiation.
Abbreviations
ML, Machine learning; CEMRI, Contrast-enhanced magnetic resonance imaging; HCC, Hepatocellular carcinoma; ROC, Receiver operating characteristic curve; AUC, Area under the ROC curve; LI-RADS, liver-imaging reporting and data system; XGBoost, eXtreme Gradient Boosting; pHCC, poorly differentiated HCC; npHCC, non-poorly differentiated HCC; LASSO, least absolute shrinkage and selection operator; mRMR, maximum relevance minimum redundancy.
Data Sharing Statement
The study data may be provided by contacting the corresponding author.
Ethics Approval and Informed Consent
This retrospective study, conducted at the Third Affiliated Hospital of Soochow University, was approved by the Ethics Committee (approval number: 2022-CL027-01), in compliance with the Helsinki Declaration. Informed consent from patients was waived by the committee, considering the retrospective nature of the study and the utilization of anonymized data, while ensuring patient privacy and confidentiality. All patient data were handled in strict accordance with relevant privacy regulations, guidelines, and the principles outlined in the Declaration of Helsinki, ensuring confidentiality and anonymity throughout the study.
Disclosure
The authors report no conflicts of interest in this work.
Additional information
Funding
References
- Sung H, Ferlay J, Siegel RL, et al. Global cancer statistics 2020: GLOBOCAN estimates of incidence and mortality worldwide for 36 cancers in 185 countries. CA Cancer J Clin. 2021;71(3):209–249. doi:10.3322/caac.21660
- Forner A, Reig M, Bruix J. Hepatocellular carcinoma. Lancet Lond Engl. 2018;391(10127):1301–1314. doi:10.1016/S0140-6736(18)30010-2
- Shinkawa H, Tanaka S, Kabata D, et al. The prognostic impact of tumor differentiation on recurrence and survival after resection of hepatocellular carcinoma is dependent on tumor size. Liver Cancer. 2021;10(5):461–472. doi:10.1159/000517992
- Zhou L, Rui JA, Zhou WX, et al. Edmondson-Steiner grade: a crucial predictor of recurrence and survival in hepatocellular carcinoma without microvascular invasio. Pathol Res Pract. 2017;213(7):824–830. doi:10.1016/j.prp.2017.03.002
- Kleiner DE. Hepatocellular carcinoma: liver biopsy in the balance. Hepatology. 2018;68(1):13–15. doi:10.1002/hep.29831
- Gong XQ, Tao YY, Wu Y, et al. Progress of MRI radiomics in hepatocellular carcinoma. Front Oncol. 2021;11:698373. doi:10.3389/fonc.2021.698373
- Vietti Violi N, Lewis S, Liao J, et al. Gadoxetate-enhanced abbreviated MRI is highly accurate for hepatocellular carcinoma screening. Eur Radiol. 2020;30(11):6003–6013. doi:10.1007/s00330-020-07014-1
- Kong C, Zhao Z, Chen W, et al. Prediction of tumor response via a pretreatment MRI radiomics-based nomogram in HCC treated with TACE. Eur Radiol. 2021;31(10):7500–7511. doi:10.1007/s00330-021-07910-0
- Swanson K, Wu E, Zhang A, et al. From patterns to patients: advances in clinical machine learning for cancer diagnosis, prognosis, and treatment. Cell. 2023;186(8):1772–1791. doi:10.1016/j.cell.2023.01.035
- Moura Cunha G, Chernyak V, Fowler KJ, et al. Up-to-date role of CT/MRI LI-RADS in hepatocellular carcinoma. J Hepatocell Carcinoma. 2021;8:513–527. doi:10.2147/JHC.S268288
- Loy LM, Low HM, Choi JY, et al. Variant hepatocellular carcinoma subtypes according to the 2019 WHO classification: an imaging-focused review. Am J Roentgenol. 2022;219(2):212–223. doi:10.2214/AJR.21.26982
- Li H, Wu Z, Chen J, et al. External radiotherapy combined with sorafenib has better efficiency in unresectable hepatocellular carcinoma: a systematic review and meta-analysis. Clin Exp Med. 2023;23(5):1537–1549. doi:10.1007/s10238-022-00972-4
- Su K, Shen Q, Tong J, et al. Construction and validation of a nomogram for HBV-related hepatocellular carcinoma: a large, multicenter study. Ann Hepatol. 2023;28(4):101109. doi:10.1016/j.aohep.2023.101109
- Su K, Huang W, Xu K, et al. Evaluation of lactate dehydrogenase and alkaline phosphatase as predictive biomarkers in the prognosis of hepatocellular carcinoma and development of a new nomogram. J Hepatocell Carcinoma. 2023;10:69–79. doi:10.2147/JHC.S398632
- Li H, Su K, Jiang Y, et al. Construction and validation of TACE therapeutic efficacy by ALR score and nomogram: a large, multicenter study. J Hepatocell Carcinoma. 2023;10:1009–1017. doi:10.2147/JHC.S414926
- Castaldo A, De Lucia DR, Pontillo G, et al. State of the art in artificial intelligence and radiomics in hepatocellular carcinoma. Diagnostics. 2021;11(7):1194. doi:10.3390/diagnostics11071194
- Han YE, Cho Y, Kim MJ, et al. Hepatocellular carcinoma pathologic grade prediction using radiomics and machine learning models of gadoxetic acid-enhanced MRI: a two-center study. Abdom Radiol. 2022;48(1):244–256. doi:10.1007/s00261-022-03679-y
- Ameli S, Venkatesh BA, Shaghaghi M, et al. Role of MRI-derived radiomics features in determining degree of tumor differentiation of hepatocellular carcinoma. Diagnostics. 2022;12(10):2386. doi:10.3390/diagnostics12102386
- Mao Y, Wang J, Zhu Y, et al. Gd-EOB-DTPA-enhanced MRI radiomic features for predicting histological grade of hepatocellular carcinoma. Hepatobiliary Surg Nutr. 2022;11(1):13–24. doi:10.21037/hbsn-19-870
- Brancato V, Garbino N, Salvatore M, et al. MRI-based radiomic features help identify lesions and predict histopathological grade of hepatocellular carcinoma. Diagnostics. 2022;12(5):1085. doi:10.3390/diagnostics12051085
- Yang X, Yuan C, Zhang Y, et al. Magnetic resonance radiomics signatures for predicting poorly differentiated hepatocellular carcinoma: a SQUIRE-compliant study. Medicine. 2021;100:19..
- Usta S, Kayaalp C. Tumor diameter for hepatocellular carcinoma: why should size matter? J Gastrointest Cancer. 2020;51(4):1114–1117. doi:10.1007/s12029-020-00483-z
- Huang K, Dong Z, Cai H, et al. Imaging biomarkers for well and moderate hepatocellular carcinoma: preoperative magnetic resonance image and histopathological correlation. BMC Cancer. 2019;19(1):364. doi:10.1186/s12885-019-5574-8
- Kovac JD, Ivanovic A, Milovanovic T, et al. An overview of hepatocellular carcinoma with atypical enhancement pattern: spectrum of magnetic resonance imaging findings with pathologic correlation. Radiol Oncol. 2021;55(2):130–143. doi:10.2478/raon-2021-0004
- Liu HF, Zhang YZZ, Wang Q, et al. A nomogram model integrating LI-RADS features and radiomics based on contrast-enhanced magnetic resonance imaging for predicting microvascular invasion in hepatocellular carcinoma falling the Milan criteria. Transl Oncol. 2023;27:101597. doi:10.1016/j.tranon.2022.101597
- Xu L, Li L, Wang P, et al. Novel prognostic nomograms for hepatocellular carcinoma patients with microvascular invasion: experience from a single center. Gut Liver. 2019;13(6):669–682. doi:10.5009/gnl18489