
Abstract
Background
Systemic inflammation alters energy metabolism. A sufficient glucose level, however, is most important for erythrocytes, since erythrocytes rely on glucose as sole source of energy. Damage to erythrocytes leads to hemolysis. Both disorders of glucose metabolism and hemolysis are associated with an increased risk of death. The objective of the study was to investigate the impact of intravenous glucose on hemolysis during systemic inflammation.
Materials and methods
Systemic inflammation was accomplished in male Wistar rats by continuous lipopolysaccharide (LPS) infusion (1 mg LPS/kg and h, 300 min). Sham control group rats received Ringer’s solution. Glucose was supplied moderately (70 mg glucose/kg and h) or excessively (210 mg glucose/kg and h) during systemic inflammation. Vital parameters (eg, systemic blood pressure) as well as blood and plasma parameters (eg, concentrations of glucose, lactate and cell-free hemoglobin, and activity of lactate dehydrogenase) were measured hourly. Clot formation was analyzed by thromboelastometry.
Results
Continuous infusion of LPS led to a so-called post-aggression syndrome with disturbed electrolyte homeostasis (hypocalcemia, hyperkalemia, and hypernatremia), changes in hemodynamics (tachycardia and hypertension), and a catabolic metabolism (early hyperglycemia, late hypoglycemia, and lactate formation). It induced severe tissue injury (significant increases in plasma concentrations of transaminases and lactate dehydrogenase), alterations in blood coagulation (disturbed clot formation), and massive hemolysis. Both moderate and excessive glucose supply reduced LPS-induced increase in systemic blood pressure. Excessive but not moderate glucose supply increased blood glucose level and enhanced tissue injury. Glucose supply did not reduce LPS-induced alterations in coagulation, but significantly reduced hemolysis induced by LPS.
Conclusion
Intravenous glucose infusion can diminish LPS-related changes in hemodynamics, glucose metabolism, and, more interestingly, LPS-induced hemolysis. Since cell-free hemoglobin is known to be a predictor for patient’s survival, a reduction of hemolysis by 35% only by the addition of a small amount of glucose is another step to minimize mortality during systemic inflammation.
Introduction
Blood glucose level is tightly regulated in healthy individuals.Citation1,Citation2 In situations of critical illness (eg, trauma, burn, or systemic inflammation), however, energy metabolism and glucose homeostasis are dysregulated.Citation1–Citation6 The metabolic response to injury and sepsis is often called auto-cannibalism and includes a rapid mobilization of all substrate depots (eg, glycogen) and, accordingly, the loss of muscle mass and functional proteins, body fat, and the glucose storage.Citation3–Citation7 During systemic inflammation, higher glucose requirement is covered by both increased hepatic glycogenolysis and gluconeogenesis leading to an initial hyperglycemic state.Citation5,Citation6,Citation8 However, the glycogen depots are quickly exhausted after some time in case of higher glucose consumption. From this moment onward, glucose supply can only be achieved by an increased gluconeogenesis in the liver (temporary euglycemic phase in metabolic stress response).Citation5,Citation6,Citation8 If this possibility of endogenous glucose production is also restricted or if the glucose uptake rate exceeds the rate of glucose production – as it is the case for severe sepsis and inflammation – finally hypoglycemia occurs.Citation5,Citation6,Citation8 Clinical studies showed that hypoglycemia or hyperglycemia (defined as malglycemia) is associated with an increased risk of death.Citation9–Citation12 In situation of critical illness, glucose as energy source for the brain is replaced almost completely by ketone bodies.Citation6 Erythrocytes, however, are dependent on glucose as the sole source of energy (anaerobic glycolysis),Citation13,Citation14 even though under catabolic conditions, for a short time, the metabolism of 2,3-diphosphoglycerate to pyruvate and lactate is used for adenosine triphosphate (ATP) synthesis as well.Citation15 “Starved” erythrocytes perish and hemoglobin and other cytoplasmic components, eg, lactate dehydrogenase and potassium, are released (so-called hemolysis).Citation14 Cell-free hemoglobin and heme can contribute to organ dysfunction and death;Citation16–Citation19 the pathologic mechanisms include nitric oxide (NO) consumption and local vasoconstriction, oxidative injury to lipid membranes, activation of the transcription factor NF-κB, endothelial injury, as well as iron-driven oxidative inhibition of glucose metabolism.Citation19–Citation22 Thus, hemolysis can act as a kind of amplifier of the complex response to an infection or injuryCitation23,Citation24 and worsen the outcome in patients with sepsis or trauma.Citation16–Citation19 In contrast to other studies, glucose balance was not performed via insulin treatment,Citation9,Citation25,Citation26 but via exogenous glucose supply.Citation27–Citation29 Blood glucose level should be kept high, especially during hypoglycemia, and consequences such as hemolysis through glucose depletion in erythrocytes should be avoided.
In the present manuscript we wanted to investigate whether lipopolysaccharide (LPS)-induced hemolysis can be prevented or reduced if more glucose was present as a substrate for erythrocytes.
Materials and methods
Chemicals and Materials
LPS (from Escherichia coli, serotype 0111:B4) was purchased from Sigma-Aldrich (St. Louis, MO, USA), isoflurane from AbbVie Deutschland (Ludwigshafen, Germany), ketamine 10% from Ceva (Düsseldorf, Germany), lidocaine (Xylocaine 1%) from AstraZeneca (Wedel, Germany), medical oxygen from Air Liquide (Düsseldorf, Germany), Ringer’s solution from Fresenius Kabi (Bad Homburg, Germany), and 2.0 mL self-filling arterial samplers containing 80 IU electrolyte-balanced heparin (PICO50) from Radiometer Medical (Brønshøj, Denmark). Portex catheters (0.58 mm i.d./0.96 mm o.d.) were obtained from Smith Medical International (Grasbrunn, Germany).
Animals
Male Wistar rats (390–520 g, from Envigo, formerly Harlan Laboratories, Horst, Netherlands) received human care according to standards of the Federation of European Laboratory Animal Science Association. The experimental procedure was reviewed and approved by the local Animal Care and Use Committee with the permit number Az. 84-02.04.2013.A015 (Landesamt für Natur, Umwelt und Verbraucherschutz Nordrhein-Westfalen, Recklinghausen, Germany). Rats were kept under standardized conditions of temperature (22 ± 1°C), humidity (55 ± 5%), and 12-h/12-h light/dark cycles (06:00 a.m. light on/06:00 p.m. light off, standard time) with free access to food (ssniff-Spezialdiäten, Soest, Germany) and water.
Anesthesia, analgesia and surgical procedure
Rats were anesthetized with isoflurane and received ketamine and lidocaine for analgesia as already described.Citation30 Afterwards, catheters were inserted in femoral artery and vein and perfused with Ringer’s solution to maintain the functionality of the catheters. At the end of the experiment, animals were sacrificed by cardiac incision under deep isoflurane anesthesia.
Experimental groups
Experiments were performed with overall 40 rats. Sham control group rats received Ringer’s solution at a rate of 7 mL/kg and h over a total period of 300 min. Systemic inflammation was accomplished by continuous LPS infusion over a total period of 300 min. Glucose was supplied either moderately or excessively during systemic inflammation simultaneously with the LPS infusion. During moderate glucose supply, rats received LPS in a 1% solution of glucose/kg and h. During excessive glucose supply, rats received LPS in a 3% solution of glucose/kg and h. The following experimental groups were compared:
SHAM (sham control group): Ringer’s solution, 300 min, n = 12 rats
LPS (lipopolysaccharide group): 1 mg LPS in Ringer’s solution/kg and h, 300 min, n = 12 rats
LPS+MG (LPS moderate glucose group): 1 mg LPS/kg and h + 70 mg glucose/kg and h, 300 min, n = 8 rats
LPS+EG (LPS excessive glucose group): 1 mg LPS/kg and h + 210 mg glucose/kg and h, 300 min, n = 8 rats
Assessment of vital, blood, and plasma parameters
Systemic blood pressure, heart rates, and breathing rates were determined in 10 min intervals as already described.Citation30 Core temperature was kept constant above 37°C with an underlying heated operating table and by covering the rats with aluminum foil.
Blood samples were taken from the femoral artery catheter immediately before starting the LPS infusion (T = 0 min) and at any further hour (T = 60, 120, 180, 240, 300 min) using self-filling arterial samplers (containing 80 IU electrolyte-balanced heparin). Blood gases, acid-base parameters, hematocrit, electrolytes, as well as glucose and lactate concentrations were assessed with a blood gas analyzer equipped with additional electrodes (ABL 715; Radiometer, Københaven, Denmark). Heparinized blood plasma was obtained from the blood samples by centrifugation. Concentration of cell-free hemoglobin was measured using the spectroscopic Soret band method. Activities of lactate dehydrogenase, aminotransferases, and creatine kinase as well as creatinine concentration were determined with a fully automated clinical chemistry analyzer (Vitalab Selectra E; VWR International, Darmstadt, Germany). For each blood sampling, rats were substituted with 0.3 mL of Ringer’s solution.Citation30 At the end of the experiments (T = 300 min), final blood samples were taken in one-tenth volume of citrate (3.13%). Citrate blood plasma was used for thromboelastometry (ROTEM; TEM International, München, Germany). The kinetics of clot formation was analyzed by thromboelastometry using INTEM or EXTEM test and described in numerical parameters.Citation30
Data analysis and statistics
Experiments were performed with 12 rats per group for SHAM and LPS and 8 rats per group for LPS+MG and LPS+EG. The included number of rats was set on empirical basis. Randomization was done by lottery before the start of the study. The data are expressed as mean values ± standard error of mean, and analyses were carried out using GraphPad Prism 6 (GraphPad Prism Software Onc, San Diego, CA, USA). All data were tested for normality using the D’Agostino-Pearson omnibus normality test. For all independent variables (vital, blood, and plasma parameters), which were determined to have a Gaussian distribution, comparison among multiple groups was performed using one-way analysis of variance followed by Dunnet’s post hoc multiple comparisons test. For those that did not pass the normality test, Kruskal-Wallis test was used for the significance analysis followed by Dunn’s correction for multiple comparisons. Differences in parameters over time within each group were determined by repeated-measures one-way analysis of variance (ANOVA). An a priori alpha error P of less than 0.05 was considered statistically significant (95% confidence interval). Outliers were defined using box-and-whiskers plots.
Results
All rats, both treated and untreated with LPS, survived the whole experimental time of 300 min. Continuous infusion of LPS led to hyperthermia, tachycardia, and tachypnea (). It affected the systemic blood pressure (acute blood pressure elevation within the first hour and continually high blood pressure after approximately 140 minutes until the end of the experiments; ), the electrolyte homeostasis (hypocalcemia, hyperkalemia, and hypernatremia; ), and the energy metabolism (lactate formation and metabolic acidosis with compensatory hyperventilation, early hyperglycemia, and finally hypoglycemia; ; ). Rats treated with LPS also showed severe organ and tissue injury (significant increases in plasma concentrations of transaminases, lactate dehydrogenase, and creatine kinase; ). Furthermore, a significant increase of cell-free hemoglobin could be measured indicating massive hemolysis (; ). LPS infusion led to a significant increase of clotting time as well as a significant decrease of maximum clot firmness in comparison to SHAM ().
Table 1 Effect of moderate (MG) and excessive glucose (EG) supply on vital, blood, and plasma parametersTable Footnotea during systemic inflammation
Table 2 Effect of moderate (MG) and excessive glucose (EG) supply on parameters of thromboelastometryTable Footnotea during systemic inflammation
Figure 1 Effect of moderate (MG) and excessive glucose supply (EG) on systemic blood pressure (A) and plasma concentration of cell-free hemoglobin (B) during systemic inflammation. Lipopolysaccharide (LPS) was infused at a rate of 1 mg/kg and h over a period of 300 min to induce systemic inflammation in male Wistar rats. Glucose was supplied either moderately (LPS+MG: 1 mg LPS/kg and h + 70 mg glucose/kg and h) or excessively (LPS+EG: 1 mg LPS/kg and h + 210 mg glucose/kg and h) during systemic inflammation. Systemic blood pressure and plasma concentration of cell-free hemoglobin are shown as mean values ± standard errors of mean.
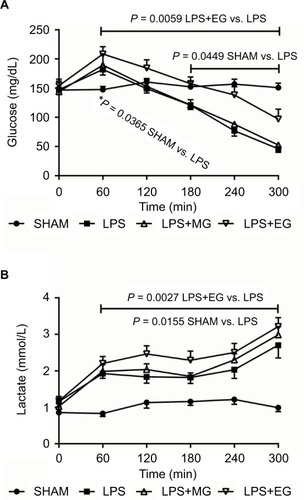
Figure 2 Effect of moderate (MG) and excessive glucose supply (EG) on plasma concentrations of glucose (A) and lactate (B) during systemic inflammation. Lipopolysaccharide (LPS) was infused at a rate of 1 mg/kg and h over a period of 300 min to induce systemic inflammation in male Wistar rats. Glucose was supplied either moderately (LPS+MG: 1 mg LPS/kg and h + 70 mg glucose/kg and h) or excessively (LPS+EG: 1 mg LPS/kg and h + 210 mg glucose/kg and h) during systemic inflammation. Plasma concentrations of glucose and lactate are shown as mean values ± standard errors of mean.
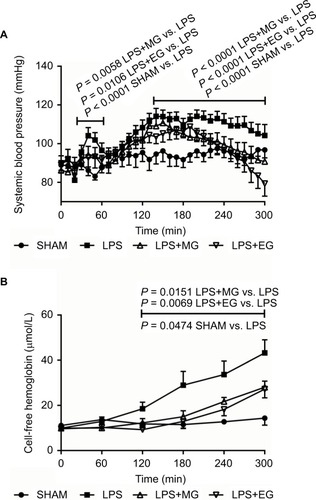
Both moderate and excessive glucose supply during systemic inflammation reduced LPS-induced increase in systemic blood pressure (). The acute blood pressure elevation within the first hour of LPS infusion as well as the later LPS-related continually high blood pressure was reduced significantly by intravenous infusion of moderate or excessive amounts of glucose. At the end of the experiments, however, a slight drop in systemic blood pressure was noticed for additional glucose supply (; ).
Glucose supply also diminished LPS-induced release of hemoglobin from erythrocytes. Hemolysis was reduced significantly 120 minutes after starting of LPS infusion till the end of experiment (; ).
Excessive but not moderate glucose supply increased significantly blood glucose level during systemic inflammation, during early hyperglycemia but even more clearly during final hypoglycemia (; ). Moderate glucose supply, however, did not change LPS-induced alterations in blood glucose level.
Additional glucose supply did not beneficially affect LPS-related functional impairment and tissue injury as indicated by increased lactate formation, electrolyte disturbances, and raised liver and renal function tests (transaminases as well as creatinine and lactate dehydrogenase). On the contrary, plasma concentrations of lactate, lactate dehydrogenase, aspartate aminotransferase, and creatinine were even aggravated, though not always significantly, following excessive glucose supply (; and ).
Additional glucose supply did not reduce LPS-induced alterations in the parameters of thromboelastometry ().
Discussion
In the present study, we demonstrated for the first time that the cross-talk between glucose and heme metabolism in LPS-mediated systemic inflammation could also be bidirectional.
The consequences of sepsis and inflammation are complex and far reaching.Citation31,Citation32 Metabolism is converted to catabolism in order to provide all substrates necessary for the immune response and healing process in sufficient quantities.Citation3–Citation7 Metabolic disorders, such as hyperglycemia or hypoglycemia, are associated with an increased risk of death.Citation9–Citation12 The experimental model of continuous LPS infusion used in the present study reflects most pathophysiological changes known from clinical severe sepsis.Citation30,Citation33,Citation34 So, continuous infusion of LPS in our model led to an early hyperglycemic pre-shock state followed by a later hypoglycemic shock state. It induced severe functional impairment and tissue injury.
In addition to metabolic and hemodynamic changes, release of cell-free hemoglobin from erythrocytes (hemolysis) often occurs during systemic inflammation and sepsis.Citation16–Citation19 In the present study, we also found massive hemolysis following infusion with LPS. There are many possible mechanisms leading to hemolysis – we recently demonstrated two: in an in vitro study, we could show that LPS as an amphiphilic molecule weakens the membrane of erythrocytes, leading to hemolysis.Citation35,Citation36 In another in vivo study, we demonstrated that diminishing of the LPS-induced disseminated intravascular coagulation is also capable of diminishing hemolysis (Brauckmann, 2017, unpublished). If the metabolism is changed to catabolism, many glucose-dependent organs can resort to other energy sources. For example, the brain uses ketone bodies as energy source when the supply of glucose is restrictedCitation6. On the other hand, erythrocytes cannot easily change their energy sources, since erythrocytes are imperatively dependent on anaerobic glycolysis.Citation13,Citation14 During hypoglycemia, as it could be the case for severe sepsis and inflammation, the erythrocytes are cut off from their energy source. “The energy-less erythrocyte is lost”; it will cease to exist and subsequent hemolysis occurs.Citation14
Wolfe and coworkers already described that infusion of glucose at a rate of 4 mg glucose/kg and min over a total time of 120 min (corresponds to 240 mg/kg and h or cumulatively 480 mg/kg) suppressed endogenous gluconeogenesis in healthy volunteers.Citation27 In septic patients, glucose infusion at a rate of 4 mg glucose/kg and min decreased hepatic glycogenolysis but not gluconeogenesis.Citation27 Endogenous glucose production in healthy man was suppressed at a rate of 120 mg glucose/kg and h in 120 min (corresponds to 2 mg glucose/kg and min).Citation28 The absolute degree of suppression was reached at a rate of 240 mg glucose/kg and h in 120 min;Citation28 at higher doses no further suppression was measurable.Citation27 Glucose overload, on the contrary, enhanced hyperglycemiaCitation7,Citation37 and increased norepinephrine release.Citation38 According to the studies of Wolfe et al and due to the fact that glucose overload is detrimental, we used in our study a low dosage (moderate glucose supply: 70 mg glucose/kg and h over a time of 300 min, cumulative: 350 mg glucose/kg) – an effect on the glucose level is not expected – and a high dosage (excessive glucose supply: 210 mg glucose/kg and h over a time of 300 min, cumulative: 1050 mg glucose/kg) – an effect on the glucose level is expected. Indeed, the excessive but not moderate glucose supply had an effect on the plasma concentration of glucose.
Surprisingly, both moderate and excessive glucose supply reduced LPS-induced hemolysis. An indirect effect of glucose as modulator in the inflammation-related activation of coagulationCitation31,Citation39 can be excluded, since neither moderate nor excessive glucose supply affected LPS-induced alterations in clot formation kinetics. Ultimately, the additional administration of low glucose seems to protect the erythrocytes from “starvation”. It has long been known that a sufficient amount of glucose has a beneficial effect on the quality of stored blood by maintaining acceptable levels of ATP and 2,3-diphosphoglycerate.Citation40–Citation42 Exposure of erythrocytes to high glucose concentrations can reduce hemolysis in vitro.Citation43,Citation44 Thus, there are many indications that moderate glucose infusion might reduce hemolysis during sepsis or inflammation. A consequential effect of diminished hemolysis, as visible in our study, might be the stabilization of the blood pressure through intravenous glucose supply over a certain period of time. Among others, one explanation could be a lack of the NO-scavenging effect through cell-free heme and hemoglobin.Citation20 However, this is rather a result of a reduced hemolysis than an increased glucose concentration. In other words, if less cell-free hemoglobin is released, in turn, less NO would also be trapped, and blood pressure would not increase in consequence of hemolysis.Citation19,Citation20 However, at this point, it cannot be excluded that glucose has a direct effect on NO level or even blood pressure.
An excessive accumulation of cell-free heme following hemolysis, moreover, can influence the glucose metabolism by iron-driven oxidative inhibition of the liver glucose-6-phosphatase – an enzyme important for endogenous glucose production via gluconeogenesis and glycogenolysis.Citation22 Thus, an unidirectional relationship that the accumulation of cell-free hemoglobin or heme affects glucose metabolism during sepsis has already been described by Weis et al.Citation22 We demonstrated that the crosstalk between glucose and heme metabolism could also be bidirectional.
In addition to the reduction of the LPS-induced hemolysis excessive glucose supply, however, might not just increase blood glucose level up to hyperglycemia but also enhance functional impairment and liver injury (increases in plasma alanine aminotransferase, aspartate aminotransferase, and lactate dehydrogenase activity). Liver damage due to large amounts of glucose, as seen in the present study, has already been described by other working groups.Citation45 An injured liver is incapable of metabolizing lactate neither back to glucose (gluconeogenesis) nor to carbon dioxide and water.Citation46,Citation47 The further increase in plasma lactate, as has been found for excessive glucose supply during systemic inflammation (), therefore just reports about an impaired liver function.
The absolute degree of hemolysis reduction was reached by moderate glucose supply; a further reduction following excessive glucose supply was not measurable. It seems that the mechanisms leading to hemolysis during sepsis and systemic inflammation are synergistic or additive. A proportion through the coagulation effect still exists, as is the proportion of the direct membrane effects. Nevertheless, a reduction of hemolysis by 35% only by the addition of a small amount of glucose is another step to minimize mortality during systemic inflammation.
Disclosure
The authors report no conflicts of interest in this work.
References
- Van CromphautSJVanhorebeekIVan den BergheGGlucose metabolism and insulin resistance in sepsisCurr Pharm Des200814191887189918691100
- GüemesMRahmanSAHussainKWhat is a normal blood glucose?Arch Dis Child2016101659657426857823
- McKechnieSWalshTMetabolic response to injury, fluid and electrolyte balance and shockGardenOJParksRWPrinciples and Practice of Surgery77th edEdinburghElsevier2018328
- WanekSWolfSEMetabolic response to injury and role of anabolic hormonesCurr Opin Clin Nutr Metab Care200710327227717414494
- HartlWHJauchKWMetabolic self-destruction in critically ill patients: origins, mechanisms and therapeutic principlesNutrition201430326126724369911
- KreymannKGWolfMDie metabolische Antwort auf Trauma und Sepsis [The metabolic response from trauma and sepsis]Intensiv-Notfbehandl2000251419 German
- MichieHRMetabolism of sepsis and multiple organ failureWorld J Surg19962044604648662135
- MaitraSRWojnarMMLangCHAlterations in tissue glucose uptake during the hyperglycemic and hypoglycemic phases of sepsisShock200013537938510807013
- FinferSLiuBChittockDRNICE-SUGAR Study InvestigatorsHypoglycemia and risk of death in critically ill patientsN Engl J Med2012367121108111822992074
- BrunnerARudigerANeurologically intact survival despite severe sepsis-induced hypoglycemia: a case reportAm J Emerg Med2011296696.e1696.e2
- HammerMJCasperCGooleyTAO’DonnelPVBoeckhMHirschIBThe contribution of malglycemia to mortality among allogeneic hematopoietic cell transplant recipientsBiol Blood Marrow Transplant200915334435119203725
- KrinsleyJSAssociation between hyperglycemia and increased hospital mortality in a heterogeneous population of critically ill patientsMayo Clin Proc200378121471147814661676
- SchieblerTHJunqueiraLCCarneiroJBlutJunqueiraLCCarneiroJHistologie – Zytologie, Histologie und mikroskopische Anatomie des Menschen [Histology - Cytology, Histology and Microscopic Anatomy of Man]4BerlinSpringer1996314 German
- van WijkRvan SolingeWWThe energy-less red blood cell is lost: erythrocyte enzyme abnormalities of glycolysisBlood2005106134034404216051738
- FeigSASegelGBShohetSBNathanDGEnergy metabolism in human erythrocytes II: effects of glucose depletionJ Clin Invest1972516154715545024046
- HartmannMde GrootHCell-free hemoglobin: a new player in sepsis pathophysiologyCrit Care Med2013418e186e189
- AdamzikMHamburgerTPetratFPetersJde GrootHHartmannMFree hemoglobin concentration in severe sepsis: methods of measurement and prediction of outcomeCritical care2012164R12522800762
- JanzDRBastaracheJAPetersonJFAssociation between cell-free hemoglobin, acetaminophen, and mortality in patients with sepsis: an observational studyCrit Care Med201341378479023314583
- JanzDRWareLBThe role of red blood cells and cell-free hemoglobin in the pathogenesis of ARDSJ Intensive Care201517320
- RotherRPBellLHillmenPGladwinMTThe clinical sequelae of intravascular hemolysis and extravascular plasma hemoglobin: a novel mechanism of human diseaseJAMA2005293131653166215811985
- WinslowRMOxygen: the poison is in the doseTransfusion201353242443722804568
- WeisSCarlosARMoitaMRMetabolic adaptation establishes disease tolerance to sepsisCell2017169712631275.e121428622511
- DutraFFBozzaMTHeme on innate immunity and inflammationFront Pharmacol2014511524904418
- LinXJMeiGPLiuYLTherapeutic effects of melatonin an heatstroke-induces multiple organ dysfunction syndrome in ratsJ Pineal Res201150443644421392091
- ElkeGKuhntERagallerMEnteral nutrition is associated with improved outcome in patients with severe sepsis. A secondary analysis of the VISEP trialMed Klin Intensivmed Notfmed2013108322323323455443
- BrunkhorstFMEngelCBloosFIntensive insulin therapy and pentastarch resuscitation in severe sepsisN Engl J Med2008358212513918184958
- ShawJHKleinSWolfeRRAssessment of alanine, urea, and glucose interrelationships in normal subjects and in patients with sepsis with stable isotopic tracersSurgery19859755575683887629
- WolfeRRAllsopJRBurkeJFGlucose metabolism in man: responses to intravenous glucose infusionMetabolism1979283210220763155
- WolfeRRO´DonnellTFJrStoneMDRichmandDABurkeJFInvestigation of factors determining the optimal glucose infusion rate in total parenteral nutritionMetabolism19802998929006774203
- LansinkMOGörlingerKHartmannMde GrootHEffenberger-NeidnichtKMelatonin does not affect disseminated intravascular coagulation but diminishes decreases in platelet count during subacute endotoxaemia in ratsThromb Res2016139384326916294
- LeviMNieuwdorpMvan der PollTStroesEMetabolic modulation of inflammation-induced activation of coagulationSemin Thromb Hemost2008341263218393140
- SzaboGRomicsLJrFrendlGLiver in sepsis and systemic inflammatory response syndromeClin Liver Dis2002641045106612516206
- BrencherLOude LansinkMEffenberger-NeidnichtKAdministration of exogenous melatonin after the onset of systemic inflammation is hardly beneficialInflammation20174051672167728620821
- LansinkMOPatykVde GrootHEffenberger-NeidnichtKMelatonin reduces changes to small intestinal microvasculature during systemic inflammationJ Surg Res201721111412528501107
- BrauckmannSEffenberger-NeidnichtKde GrootHLipopolysaccharide-induced hemolysis: evidence for direct membrane interactionsSci Rep201663550827759044
- BrauckmannSEffenberger-NeidnichtKde GrootHMechanismen der Lipopolysaccharid-induzierten Hämolyse – Hinweise für eine direkte Zellmembraninteraktion [Mechanisms of lipopolysaccharide-induced hemolysis - evidence for direct cell membrane interaction]Anästh Intensivmed201556256 German
- WatanabeYSingamsettySZouBExogenous glucose administration impairs glucose tolerance and pancreatic insulin secretion during acute sepsis in non-diabetic micePLoS One201386e6771623826335
- NordenströmJAskanaziJElwynDHNitrogen balance during total parenteral nutrition: glucose vs. fatAnn Surg1983197127336401204
- McGovernKFLascolaKMSmithSAThe effect of hyperglycemia and endotoxemia on coagulation parameters in healthy adult horsesJ Vet Intern Med201327234735323480666
- BensingerTAMetroJBeutlerEIn vitro metabolism of packed erythrocytes stored in CPD-adenineTransfusion19751521351391118878
- BeutlerERed Cell Metabolism2BaltimoreWilliams & Wilkins1996
- HegedüsEHarsányiVHollánSRThe effect of increasing glucose in CPD on the quality of stored bloodFolia Haematol Int Mag Klin Morphol Blutforsch19801076928933 German [with English abstract]6162760
- ViskupicovaJBlaskovicDGaliniakSEffect of high glucose concentrations on human erythrocytes in vitroRedox Biol2015538138726141922
- HendryEBDelayed hemolysis of human erythrocytes in solutions of glucoseJ Gen Physiol1951354605616
- VanhorebeekIEllgerBDe VosRTissue-specific glucose toxicity induces mitochondrial damage in a burn injury model of critical illnessCrit Care Med20093741355136419242345
- ParkRLactic acidosisWest J Med19801355418424
- HussmannBLendemansSde GrootHRohrigRVolume replacement with Ringer-lactate is detrimental in severe hemorrhagic shock but protective in moderate hemorrhagic shock: studies in a rat modelCrit Care2014181R524393404