
Abstract
Objective
This study aimed to analyze immune-related genes and immune cell components in the peripheral blood of patients with acute myocardial infarction (AMI).
Methods
Six datasets were obtained from the GEO repository comprising 88 healthy samples and 215 AMI samples. We performed the weighted gene co-expression analysis (WGCNA) and five machine learning (ML) methods to identify immune-related genes and construct diagnostic models. CIBERSORT algorithm was adopted for the assessment of the degree of immune infiltration. Finally, RT-PCR, immunofluorescence double and immunohistochemistry were conducted to analyze the expression level of the identification of featured immune-related genes and localization relationship in heart tissue of AMI mouse model.
Results
A total of 496 immune-related DEGs were obtained between AMI and normal samples. WGCNA finally determined the co-expression modules that showed the most significantly positively associated with AMI (r=0.41; P<0.001). Among the five ML models, XGBoost had the highest AUC (0.849) and accuracy (0.812) to discriminate patients with AMI from normal in the validation sets. Furthermore, we found that the proportion of chemokine receptor (CCR), macrophages, neutrophils, and Treg cells in the AMI groups was significantly higher than that in the normal groups. In vitro RT-PCR verification revealed that SOCS3, MMP9, and AQP9 expression increased significantly in the AMI mouse model. Among the 22 immune cells, AQP9, MMP9, and SOCS3 displayed the strongest positive correlation with neutrophils. In MI-mice, MPO stained strongly along the lateral cardiomyocytes, whereas it was weaker in sham mice. Combined immunofluorescence was observed in same parts of the cytoplasm of cardiomyocytes in myocardial infarction area, indicating co-localization of MPO with MMP9 and SOCS3 in these areas, respectively.
Conclusion
Immune-related genes and immune cells are intimately related to AMI. Constructing different ML models based on these biomarkers could be a valuable approach to diagnosing AMI in clinical practice.
Introduction
Acute myocardial infarction (AMI) is a leading cause of cardiovascular disease mortality around the world, causing a tremendous burden to global public health. In America, someone experiences a myocardial infarction approximately every 40 seconds.Citation1 Two thirds of all AMIs present no ST-elevation.Citation2 As for the cause of AMI, plaque rupture remains the most common etiology, but unique syndromes such as plaque erosion, coronary microvascular dysfunction, spontaneous coronary artery dissection, and coronary spasm related to drug use are more prevalent in this age group.Citation3 Cardiovascular disease remains the main cause of morbidity and mortality among young people worldwide, even as significant progress has been made in improving diagnosis and therapies.Citation4 At present, we face the challenges consisting of atypical and delayed presentation, nonadherence to treatment, and syndromes unique to young men. Therefore, we need to look for a potential method that is sufficiently stable and reliable to help diagnose AMI in the early stages regardless of atypical symptoms.Citation5
Numerous studies have been performed to better understand the mechanisms involved in the pathogenesis of AMI. From these, immune responses have been reported to play an important role in AMI, and require the coordinated efforts of multiple immune-related genes and various immune cells.Citation6–8 Various immune cells participate in immunomodulation after AMI, collectively working to remove necrotic tissue and rebuild the injured myocardiumCitation9 The inflammatory response plays a central role in the development of myocardial necrosis, ventricular remodeling, dysfunction, and coronary heart failure after AMI.Citation7,Citation10 For example, MMP9 expression in AMI patients has been found to be significantly higher than in controls, and there is a time-dependent relationship between plasma levels of levels of NT-proBNP and MMP-9.Citation11 Enhanced activation of cardioprotective signaling pathways by inhibiting myocardial suppressor of cytokine signaling 3 (SOCS3) expression prevented left ventricular remodeling after AMI.Citation12 In addition, studies have shown that immune cell infiltration plays an increasingly important role in the development and progression of AMI.Citation6,Citation7,Citation13 Various types of cell death have been identified in AMI, including necrosis, apoptosis, autophagy-related cell death, and pyroptosis.Citation7,Citation14 Numerous preclinical studies have shown that macrophages, mast cells, and eosinophils, which influence cardiac function after myocardial infarction (MI), are involved in the immune regulation of the infarcted heart.Citation7,Citation13 Therefore, therapies aimed at regulating the immune response after AMI are a good choice for the treatment of AMI, and are promising in reducing complications and mortality.Citation15
The roles played by immune-related genes and immune cells, as well as the associations between them in patients with AMI, have not been fully investigated. Therefore, we analyzed immune-related genes and immune cell components in peripheral blood of patients with AMI using bioinformatic strategies. In addition, machine learning is a very effective approach when dealing with high-dimensional datasets, including genomic, epigenomic, proteomic or metabolomic data sets.Citation16 Therefore, we compared five different machine learning algorithms to obtain better diagnostic efficacy and identify immune related genes in patients with AMI, which is expected to provide new potential targets for diagnosis and prognosis, and thus improve the outcome of patients with AMI.
Materials and Methods
Systematic Search of Microarray Expression Profiling Datasets
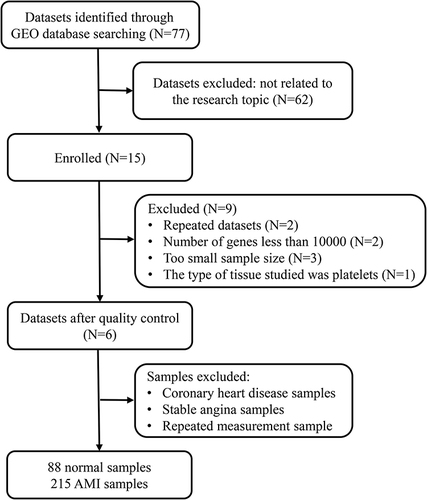
AMI-related keywords were searched in the Medical Subject Headings (MeSH) library (https://www.ncbi.nlm.nih.gov/mesh). We then conducted a systematic search in the GEO repository (https://www.ncbi.nlm.nih.gov/gds/) using the following search sentence: (((myocardial infarction) AND ((blood) OR PB)) AND Homo sapiens [Organism]) AND Expression profiling by array [Filter]. A report was included in the analysis if the following criteria were satisfied: (1) used a case-control design; (2) patients did not have any diseases other than AMI; and (3) patients were medication free. We finally obtained a total of six datasets ().
Figure 1 Data processing workflow.
Initial Data Processing and Removal of Batch Effect
We used edgeR (version 4.1.4) to process all data from gene expression profiles. Through the package “limma”,Citation16 we merged all samples and deleted those with coronary heart disease, stable angina, and repeated measurements (). Batch effects were removed by implementing the “sva” package in the R language.Citation17 Numerically larger expression values from six data sets were log2 transformed prior to cross-platform normalization. For systematic evaluations, ComBat outperforms other tools. Therefore, we chose ComBat to remove the batch effect between the two platforms.Citation17 The ComBat method was used to normalize the expression values from different batches or platforms. Principal component analysis (PCA) was then conducted to confirm whether the batch effect was removed.
Differentially Expressed Genes
The “limma” package was applied to select differentially expressed genes (DEGs) between AMI and control samples. We set the significance criteria as |logFC|>0.5 and P<0.05 and the DEGs were visualized by volcano plot.Citation18 Then we chose the top 50 up-regulated genes and 50 down-regulated genes to plot the heatmap using the “pheatmap” package.
Functional Analyses of DEGs
To further reveal the biofunction of the selected DEGs, Gene Ontology (GO) enrichment analysis including biological process (BP), cellular component (CC) and molecular function (MF) analysis was performed using the “clusterProfiler” package. The criteria were set as P<0.01, the outcome was visualized in a barplot. Moreover, GObubble and GOChord were applied with the “GOplot” package to illustrate the functional analysis data.Citation19 Likewise, Kyoto Encyclopedia of Genes and Genomes (KEGG) pathway analysis was performed by applying the “clusterProfiler” package to illustrate the enrichment of pathways in DEGs; the results were displayed in bar graph and circle graph.
Differentially Expressed Immune-Related Genes
We obtained immune-related genes identified in previous studies from two databases and merged them (https://www.immport.org/home; https://www.innatedb.ca/). We then evaluated the expression of these genes in our 303 samples. The “limma” package was then applied to select immune-related DEGs between control and AMI samples and we set the significance criteria as P <0.05. The most significantly 20 upregulated and 20 downregulated genes between the normal and AMI groups were inserted in the heat map graphically.
Weighted Gene Co‐Expression Network Analysis
Weighted gene coexpression analysis (WGCNA) was performed to identify potential functional modules that could characterize the biological function of the samples.Citation20 The minimum module size was set to 50 genes. The soft threshold for the scale-free network was determined based on the maximal R2 (power=6). The similarity of the topological overlap matrix was used to evaluate the distance between each pair of genes. Furthermore, hierarchical clustering analysis with the average method and the dynamic method was used to build the cluster tree and classify the genes into modules, respectively. Finally, we identified three functional modules. Then Spearman correlation coefficients and the corresponding p-values between two groups and functional modules were calculated by the cor function with using the Spearman method in the WGCNA package. The module most closely related to AMI was selected for further analysis. Next, we constructed a heatmap to illustrate the expression of three modules between normal and AMI samples.
Protein–Protein Interaction Network and Co-Expression Network
As mentioned above, we selected the genes from the module most closely related to AMI. We mapped a protein–protein Interaction (PPI) network including the top 20 core genes using the online mapping tool “STRING” (https://string-db.org/cgi/input.pl) and the minimum interaction distance was 0.9. Next, we performed a coexpression network analysis on these core genes using the “igraph” R package to explore the correlation intensity between these genes, and the results were plotted using a cut-off correlation coefficient of 0.4.Citation22
Functional Analyses of Three Functional Modules
As mentioned previously, GO enrichment analysis including BP, CC, and MF analysis was performed using the “clusterProfiler” package to reveal the biofunction of three modules. Meanwhile, KEGG pathway analysis was performed applying the “clusterProfiler” package to illustrate the enrichment of pathways in three modules, the results were displayed in bubble charts.
Establishment of the Machine Language Classifier
We extracted the 235 immune-related gene expression profiles from the turquoise module and performed univariate logistic regression. The data set was randomly divided into 2:1 (202:101) as the training and validation sets. The following ML algorithms, LASSO, SVM, random forest, XGBoost, and neural network, were used to build diagnostic models for gene expression data and the R package “glmnet, e1071, randomForest, caret, and neuralnet” were used.Citation21–25 ML models with default parameters, as defined in the Scikit Learn library (http://scikit-learn.org/stable/), and from ML models after hyperparameter optimization were applied. Furthermore, the AUC, accuracy, precision, recall, specificity, and F1-score were calculated from Confusion Matrices to evaluate the classification capability of each model.Citation26 Finally, the two models with the highest average AUC in validation sets were chosen without affecting the accuracy of classification efficiency. We selected the random forest and the XGBoost models and mapped the most important top 20 genes in both models, respectively, for further validation.
Immune Cell Infiltration Analysis
To calculate the scores for infiltrating immune cells and to evaluate the activity of immune-related pathways in the control and AMI samples, the CIBERSORT algorithm was used to estimate the relative proportions of 22 types of infiltrating immune cells. This algorithm was run with the default LM22 signature matrix downloaded from the CIBERSORT portal and 1000 permutations using the “CIBERSORT” R package. Only samples with CIBERSORT p-value smaller than 0.05 were included. The correlation between immune genes and immune cells was determined by Spearman correlation.
Mouse Myocardial Infarction Model
All animal experiments were approved by the Institutional Review and Ethics Board of the First Affiliated Hospital of Nanjing Medical University, Jiangsu Province Hospital, and were performed in accordance with the international ARRIVE (Animal Research: Reporting of In Vivo Experiments) guidelines for animal experiments.Citation27 Mice were anesthetized with 2% isoflurane. The heart was retrieved from a small hole in the fourth intercostal space. The descending branch of the left coronary artery was located, sutured, and ligated approximately 3-mm from its origin with 6‐0 silk thread. After ligation, the heart was returned to the chest and the muscles and skin were sutured closed. Except for ligation, the sham operation group was the same as the control group. Each group contained six mice. After 3 days, the mice were administered a high-dose of anesthesia with 2% isoflurane and specimens were collected after myocardial perfusion with normal saline. The tissue was stored in liquid nitrogen.
Quantitative RT-PCR Assessed the Expression Level of Potential Immune-Related Genes
Total RNA was isolated from mice heart tissues using Trizol and cDNA was synthesized using reverse transcription kits (Takara, Shiga, Japan) according to the manufacturer’s instructions. Quantitative reverse transcription PCR was performed using SYBR Green Mix on an ABI7900HI (Thermo Fisher Scientific). The expression of genes was normalized to that of reference genes, including 18S. The primer sequences are listed in Supplementary Table S2.
Double Immunofluorescence
Immunohistochemical Staining performed after being dewaxed of mice tissue sections. Sections permeabilized with 0.1% Triton X-100, and blocked with 10% goat serum at room temperature for 1 h. Samples were incubated with anti-rabbit SOCS3 antibody (for;1:500, ab16030, Abcam, USA), anti-rabbit MMP9 (1:500, ab76003, Abcam, Cambridge, MA, USA), anti-rabbit-AQP9 antibody (1:600, ab84828, Abcam, Cambridge, MA, USA), and anti-rabbit-MPO antibody (1:600, EPR20257, Abcam, Cambridge, MA, USA) at 4°C overnight. On the 2nd day, slides were incubated with goat anti-rabbit/rabbit FITC secondary antibody for 1h at room temperature. The nuclei were dyed by 4′,6-diamidino-2-phenylindole (DAPI) for 5min (4′,6-diamidino-2-phenylindole, Vector, ZsBio, Beijing, China). Images were obtained using Zeiss fluorescence microscope (Germany) and Nikon microscope (Nikon, Tokyo, Japan). At least five fields for each coverslip were captured. The number of cells, antigen distribution, and cellular fluorescence intensity that represented antigenicity were measured using the captured images. The image analysis was performed with ImageJ (NIH, Bethesda, MD, USA).
Results
Data Set Collection, Study Population, and Preprocessing of Data
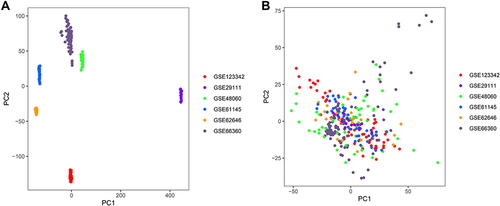
In this study, six microarray datasets from the GEO database were included for analysis: GSE29111, GSE48060, GSE61145, GSE62646, GSE66360, and GSE123342, with a sample size of 52, 52, 57, 98, 99, and 192, respectively (Supplementary Table S1). We merged all the samples and deleted the ones with coronary heart disease, stable angina, and repeated measurements. Finally, 88 healthy controls and 215 patients with AMI were included (). In addition, we removed the batch effect from different platforms and different batches between the datasets ().
Figure 2 Principal component analysis (PCA) of gene expression datasets. (A) Gene expression profiles without the removal of the batch effect. (B) Gene expression profiles with removal of batch effect.
Identification of DEGs Between Normal and AMI Samples and Functional Analyses
Gene expression levels were compared in the 88 normal and 215 AMI samples and we identified 3279 DEGs. After removing genes with low expression levels, the heatmap of the top 50 up-regulated and 50 down-regulated genes selected according to the screening criteria (|logFC|>0.5, P<0.05) are shown in Supplementary Figure S2. GO enrichment analysis was performed for the 157 DEGs selected to identify significantly enriched GO terms. GObar revealed the significantly enriched GO terms (P < 0.01). The results of the most significantly enriched GO terms were as follows: BP: neutrophil activation involved in immune response and neutrophil activation; CC: secretory granule lumen, cytoplasmic vesicle lumen, and vesicle lumen; MF: carbohydrate binding. GOChord was carried out to define the relationship between DEGs and their associated terms. We could see that DEGs were enriched into eight GO terms, and neutrophil activation was involved in the immune response, neutrophil activation, neutrophil degranulation, and neutrophil-mediated immunity contained the most DEGs (Supplementary Figure S2A and S2B). Therefore, the findings indicated that neutrophils were closely related with DEGs and may play an important role in the progression of AMI. Furthermore, through KEGG pathway analysis, we discovered that osteoclast differentiation was the most significantly enriched pathway among the DEGs (Supplementary Figure S2C and S2D).
Identification of Differentially Expressed Immune-Related Genes
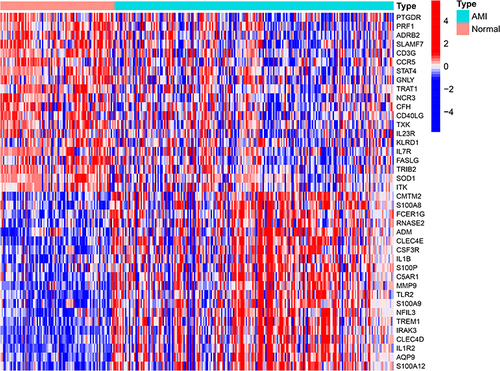
After downloading the immune-related genes from the website, we compared their expression between 88 normal and 215 AMI samples and identified 496 DEGs (all P<0.05). Among these, 167 genes were down-regulated, while 329 other genes were enriched in the AMI group. The 20 most significant upregulated (such as TLR2, IL1R2, AQP9) and downregulated (such as PTGDR, PRF1, ADRB2) genes between the normal and AMI groups were graphically illustrated in a heatmap ().
Figure 3 Heatmap showing the top 20 up-regulated and 20 down-regulated immune-related DEGs in 88 normal and 215 AMI samples.
Identification of Gene Co-Expression Modules for Differentially Expressed Immune-Related Genes
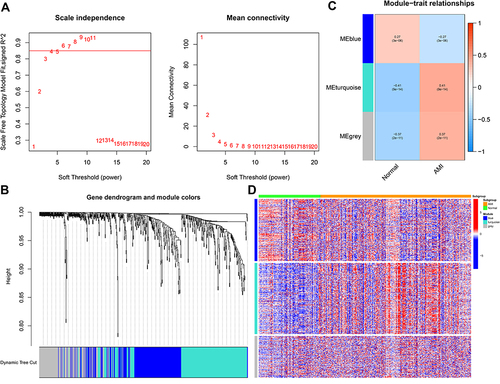
To uncover the differences in immune-related genes between the normal and AMI groups, WGCNA was conducted to identify potential functional modules. The correspondence between immune-related DEGs and groups is shown in and . We defined three modules (blue, turquoise, and grey) and each module was assigned with a unique color. Of the three modules, MEturquoise showed the most significant correlations with AMI (r=0.41; P<0.001). Furthermore, MEturquoise and MEgrey modules were positively correlated with AMI samples, while MEblue was negatively correlated with the AMI group (). In addition, from the heatmap, we detected that the expression of the turquoise module genes was significantly different between the normal and AMI groups and tended to be up-regulated in the AMI samples ().
Figure 4 Weighted gene co‐expression analysis (WGCNA) based on the immune-related DEGs. (A) Analysis of the scale-free index and mean connectivity for various soft-threshold powers. (B) Gene dendrogram obtained by average linkage hierarchical clustering. The row underneath the dendrogram shows the module assignment determined by the Dynamic Tree Cut. (C) Positive and negative correlation coefficients of the WGCNA modules between the normal and AMI groups. (D) The heatmap showed the expression of three modules between normal and AMI samples.
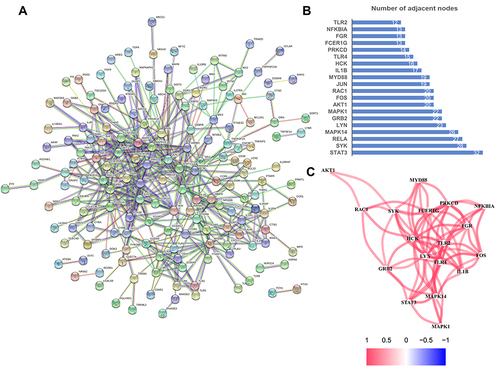
Construction of the PPI Network and the Co-Expression Network
To illustrate the association between genes in turquoise module, we constructed a corresponding PPI network (). Each node in the graph represented a gene and the connecting line connected the interacting genes in pairs. The colors of the connecting lines showed different degrees of PPI. STAT3, SYK, RELA, MAPK14, LYN, GRB2, MAPK1, AKT1, FOS, RAC1, JUN, MYD88, IL1B, HCK, TLR4, PRKCD, FCER1G, FGR, NFKBIA, and TLR2 were identified as hub genes (). Next, we drew the co-expression network diagram of the top 20 core genes in red to indicate the positive correlation and in blue to indicated a negative correlation ().
Figure 5 Maps illustrating the association between MEturquoise genes. (A) The PPI network of MEturquoise genes generated by the STRING platform. (B) Bar chart showing the top 20 hub genes. (C) The coexpression network showing correlation intensity of the top 20 hub genes and the cutoff of correlation coefficient is 0.4.
Functional Analyses of Three Functional Modules
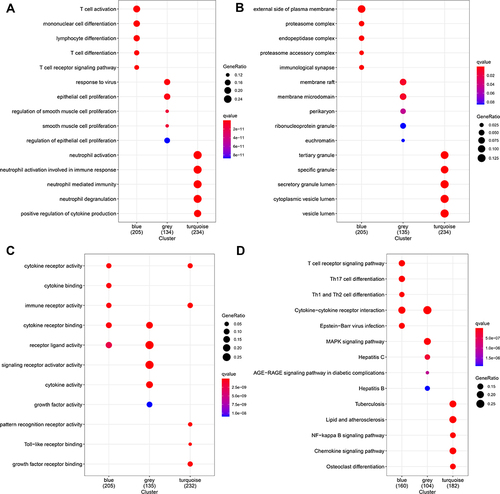
GO enrichment analysis for the three modules was performed to identify the significantly enriched GO terms (P<0.05): MEblue: BP: T cell activation; CC: external side of plasma membrane; MF: cytokine receptor activity. MEgrey BP: epithelial cell proliferation; CC: membrane raft; MF: receptor ligand activity. MEturquoise: BP: neutrophil activation; CC: secretory granule lumen, cytoplasmic vesicle lumen, and vesicle lumen; MF: immune receptor activity. (). In addition, according to P adjusted < 0.05, significantly enriched KEGG pathways were screened: T cell receptor signaling pathway, Th17 cell differentiation, cytokine-cytokine receptor interaction, lipid and atherosclerosis, and NF-kappa B signaling pathway ().
Figure 6 Functional analyses of three modules. Enrichment of cell functions evaluated by GO functional enrichment analysis of (A) biological process (BP), (B) cellular component (CC), and (C) molecular function (MF), (D) enrichment of cell function pathways evaluated by KEGG pathway enrichment analysis.
Establishment of the Diagnostic Model Based on Five ML Methods
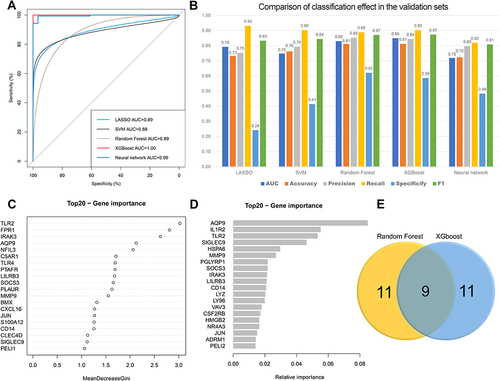
Univariate logistic regression of the 235 DEG of the turquoise module was carried out and we finally obtained 180 potential genes (P<0.01). Five ML classification methods were used for the diagnostic model. All models produced an average AUC > 0.85 in the training sets (). Among the five ML models, XGBoost had the highest AUC (0.849) and accuracy (0.812) to discriminate patients with AMI from normal in the validation sets. In addition, the random forest classifier also performed well, and the AUC and accuracy were 0.830 and 0.812 respectively (). Next, we mapped the most significant top 20 DEGs using random forest (TLR2, FPR1, IRAK3, AQP9, NFIL3, C5AR1, TLR4, PTAFR, LILRB3, SOCS3, PLAUR, MMP9, BMX, CXCL16, JUN, S100A12, CD14, CLEC4D, SIGLEC9, PELI1) and XGBoost (AQP9, IL1R2, TLR2, SIGLEC9, HSPA6, MMP9, PGLYRP1, SOCS3, IRAK3, LILRB3, CD14, LYZ, LY96, VAV3, CSF2RB, HMGB2, NR4A3, JUN, ADRM1, PELI2) for further validation ( and ). Nine overlapping genes were defined (AQP9, TLR2, SIGLEC9, MMP9, SOCS3, IRAK3, LILRB3, CD14 and JUN) in both two models ().
Figure 7 Identification of featured immune-related genes in patients with acute myocardial infarction using machine learning (ML) methods. (A) Comparison of the AUC of the models with different ML classification algorithms in the training set. (B) Comparison of diagnostic performance of machine learning models with different feature selection methods in the validation set. (C) The most important top 20 genes selected by random forest. (D) The most important top 20 genes selected by XGBoost. (E) Venn diagram showed the overlapping genes screened by two machine learning.
Identification of Immune-Related Gene Expression in the Acute Myocardium Infarction Mice Heart
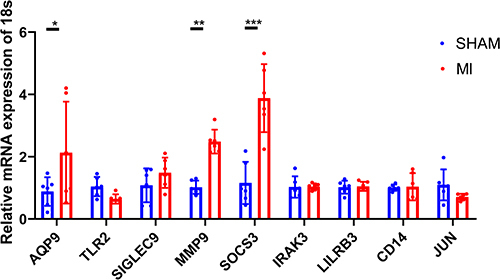
The expression of the nine overlapping genes (AQP9, TLR2, SIGLEC9, MMP9, SOCS3, IRAK3, LILRB3, CD14, and JUN) selected by two ML models were validated in the mouse myocardium. Between the sham and AMI groups, we found that the AQP9, SOCS3, and MMP9 genes had a significantly increased expression in AMI mice (P<0.001). However, other six genes had not shown any significant difference (all P > 0.05) ().
Figure 8 The expression levels of nine overlapping genes selected by two machine learning in mouse myocardial tissue analyzed by quantitative RT-PCR. *p < 0.05, **p < 0.01 and ***p < 0.001.
Immune Cell Infiltration Analysis
Applying the CIBERSORT algorithm, we investigated the proportions of immune infiltration among patients with AMI and control samples in 22 subpopulations of immune cells (Supplementary Figure S3). Weak to moderate correlations were found between different subpopulations of immune cells (Supplementary Figure S4). In addition, the proportion of neutrophils, monocytes, mast cells activated and T cells CD4 memory activated in the AMI groups was significantly higher than that in normal groups, while the proportion of B cells memory, T cells CD8, T cells CD4 naive, T cells CD4 memory resting, T cells gamma delta, and mast cells resting was lower than in normal groups ().
Figure 9 Immune cell infiltration analysis. (A) Violin plot showing the significant changes of the immune infiltration level in the patients with AMI compared to the control group. (B) Lollipop plots illustrated the correlation between AQP9 expressions and the immune cells.
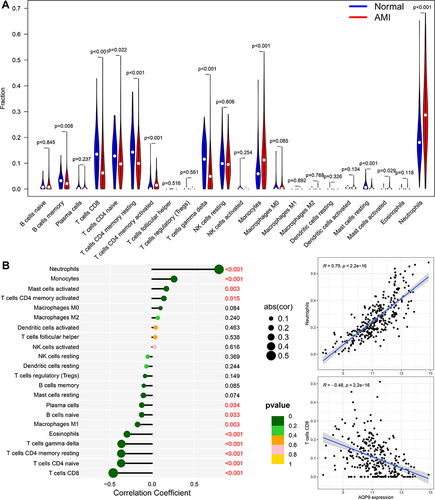
We further explored the correlation between immune-related genes (AQP9, MMP9 and SOCS3), which are highly expressed in a mouse model of acute myocardial infarction, and immune cells. The results showed that among the 22 immune cells, AQP9 displayed the strongest positive correlation with neutrophils (r = 0.79, p < 0.001) and the strongest negative correlation with T cells CD8 (r = –0.46, p < 0.001) (). MMP9 was also positively correlated with neutrophils (r = 0.63, p < 0.001) and negatively correlated with T cells CD8 (r = −0.39, p < 0.001) (Supplementary Figure S5A). In addition, SOCS3 also showed positively correlated with neutrophils (r = 0.44, p < 0.001) and negatively correlated with T cells CD8 (r = −0.31, p < 0.001) (Supplementary Figure S5B).
Expression of MPO and MMP9, SOCS3, and AQP9 in Acutely MI-Mice
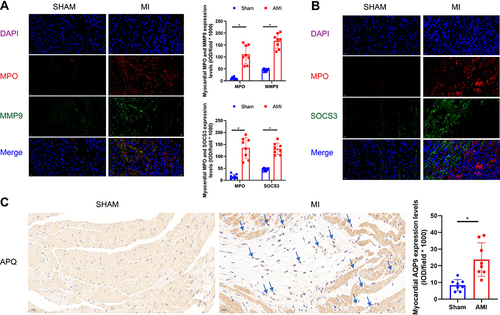
Healing from any injury requires granulocyte to remove debris and dead cells, and promote healing and repair. SOCS3, MMP9 and AQP9 proteins were significantly increased and positively correlated with neutrophil infiltration. To reveal the relationship between the distribution of MPO, SOCS3, MMP9, and AQP9 antigens in MI-mice and sham groups, we used double immunofluorescence. In MI-induced mice, MPO stained strongly along the lateral cardiomyocytes, whereas it was weaker in sham mice. Combined immunofluorescence was observed in same parts of the cytoplasm of cardiomyocytes in myocardial infarction area, indicating co-localization of MPO and MMP9, and MPO and SOCS3 in these areas, respectively ( and ). In addition, our results revealed that SOCS3 protein was localized to the extra-neutrophils and peri-cardiomyocyte, while MMP9 protein was localized to the intracellular cardiomyocyte and extra-neutrophils. In the case of sham control, no significant labeling of MPO, MMP9 and SOCS3 was found. However, the results for AQP9 failed to show fluorescent co-localization with MPO, and immunohistochemical staining also revealed high AQP9 expression consistent with area of myocardial infarction, mainly focused on the cytoplasmic stroma ().
Figure 10 Expression of MPO and MMP9, SOCS3, and AQP9 in acutely MI-mice myocardium by immunohistochemistry and immunofluorescence double staining were performed using histological sections of acute MI-associated injury, as well as the relationship between expression of individual MMP9, SOCS3, AQP9 and MPO invasion. (A) Immunofluorescence double staining with antibodies against MPO (red) and SOCS3 (green); MPO is concentrated in clusters over infarction area, and SOCS3 protein deposition over myocardial cell bodies. Hoechst 33258 dye stains the nuclei blue. Bars=20 μm. (B) Immunofluorescence double staining with antibodies against MPO (red) and MMP9 (green); MPO is concentrated in clusters over infarction area, and SOCS3 protein deposition over myocardial cell bodies. Hoechst 33258 dye stains the nuclei blue. Bars=20 μm. (C) Immunohistochemistry of AQP9 MI-mice cardiac tissues stained with anti-AQP9 antibodies showed positive staining within myocardial cytoplasm compare with sham-operation mice. Bars=20 μm. Data are expressed mean ± SD, n=4 sections per group. 400 magnifications. *P < 0.05 vs sham-operated mice.
Discussion
AMI is the most serious manifestation of coronary artery disease, leading to millions of deaths annually in both developed and developing countries.Citation28,Citation29 Despite recent achievements in reperfusion strategies and pharmacological treatment approaches, AMI remains a major problem for global health, affecting more than 7 million people worldwide every year.Citation30 A large number of immune cells participate in immunomodulation after AMI to remove necrotic tissue and repair damaged myocardium. The innate immune response comprising the inflammatory, proliferative, and maturation phases is a necessary regulator during the process.Citation31–33 Improvements in early interventions, such as reperfusion therapy and pharmacological treatment after AMI, have dramatically increased survival in recent decades. However, the process of myocardial reperfusion will paradoxically induce cardiomyocyte death and myocardial injury in itself, and is defined “myocardial reperfusion injury,” which accounts for approximately 50% of the final MI size.Citation34 Therefore, new therapies that can limit the size of the myocardial infarct, prevent adverse ventricular remodeling, and reduce eventual heart failure due to structural heart disease after AMI are urgently required.
AMI triggers a strong inflammatory response in the affected cardiac tissue. Most recently, new therapeutic tools based on immune-related intervention therapy may modulate unbalanced inflammation in damaged cardiac tissue, contributing to the resolution of this pathological condition. Currently, the results of a Phase II clinical trial involving 182 patients with non-ST-segment elevation myocardial infarction (NSTEMI) with anakinra, which is an IL-1 blocker (100 mg daily for 14 days) showed a reduction in the acute inflammatory response.Citation35 In addition, another IL-1 blocker, named canakinumab, has been reported to significantly reduce the risk of recurrent acute coronary syndromes and the need for revascularization.Citation36 As for other immune responses, in mouse models of permanent coronary ischemia and ischemia/reperfusion, it has been shown that short-term blockade of S100A9 reduces the local and systemic inflammatory response and significantly improves cardiac function.Citation37 However, all of these therapies are still in the experimental stage and none of them has been applied clinically. Therefore, we should explore the specific mechanisms underlying human AMI and try to find both a valuable and a practical method to improve the outcome of patients undergoing AMI.
In our study, we searched for the gene expression profiles of AMI samples from the GEO database and obtained 88 normal samples and 215 AMI samples. The results of the bioinformatics analysis implied that the DEGs between normal and AMI samples were mainly enriched in neutrophil activation and regulation of inflammation signaling pathways. Although differential immune-related genes were stratified into three modules (MEblue, MEturquoise and MEgrey) showing the most significant correlations with AMI samples; the expression of the genes of the turquoise module were significantly upregulated in the AMI samples. There was a close association between the genes from the turquoise module and AMI. The biofunction of three modules were significantly different. Differential gene groups and their functional enrichment should be better defined in future studies.
Apoptosis plays a major role in the pathophysiological processes following MI.Citation38 Our study found that the STAT3 was the most important upregulated gene in the MEturquoise module, and the RT-PCR analysis indicated SOCS3 expression was markedly increased in MI mice. The STAT3/SOCS3 axis influences the T-cell repertoire, with SOCS3 providing protection against autoimmune diseases by blocking Th17 development.Citation39 Previous animal studies have shown that myocardial STAT3 is a potent antiapoptotic, pro-survival signaling molecule during ischemia-reperfusion.Citation40 Furthermore, cardiac-specific deletion of SOCS3 induced sustained activation of STAT3 and reduced myocardial apoptosis that prevented ischemia and reperfusion injury in mice. Furthermore, SOCS3 is the major negative modulator of Th17 function through STAT3 activation,Citation41 and also constrains Th17 cell differentiation in T cells.Citation42
Our study showed that Th17 acts as the main activation pathway and IL-17 is the main effector of Th17 cells. IL-17 is an early promoter of T-cell-induced inflammation, which amplifies the inflammatory response by promoting the release of pro-inflammatory cytokines. After binding to the receptor, Il-17 plays its biological role through the MAP kinase pathway and the Nuclear factor kB (NFkB) pathway.Citation43 Th17 cells can secrete and produce IL-17a, IL-17f, IL-6, and tumor necrosis factor alpha (TNF-a), which collectively mobilize, recruit, and activate neutrophils.Citation44 It is well known that neutrophils are recruited into the infarcted area during the inflammatory phase, being attracted by cell debris and inflammatory signals.Citation45 IL-17 produced by Th17 cells can effectively mediate the excitatory process of neutrophil mobilization, thus effectively mediating the inflammatory response of tissues.
We performed the CIBERSORT algorithm to explore the infiltration of immune cells in the normal and AMI group. The proportion of neutrophils, monocytes, mast cells activated and T cells CD4 memory activated in the AMI groups was significantly higher than that in normal groups, while the proportion of B cells memory, T cells CD8, T cells CD4 naive, T cells CD4 memory resting, T cells gamma delta, and mast cells resting was lower than in normal groups.
Immunomodulation can be a two-edged sword. Considering repair of damaged tissue depends on timely suppression of inflammation, which is accompanied by mesenchymal activation to preserve tissue integrity. The relationship between myocardial function and structural integrity is complex, and the insufficient inhibition of inflammation in the damaged heart can lead to disastrous results, such as loss of cardiac muscle cells, inhibition of systolic function, ventricle enlargement, loss of integrity of the ventricular wall, and heart rupture of the heart.Citation46 Considering the samples in our study were within 7 days of MI and not all were obtained within 24–72 hours, we speculated that the peak systemic inflammatory reaction had overcome the compensatory mechanism. However, MMP9, an indicator of fibrosis was markedly increased in the MI mouse model. It is worth affirming that inflammation stimulates fibrosis and accelerates healing at the site of MI. From another standpoint, many immune cells and immune activity participate in the initial pro-inflammatory response to AMI and in the anti-inflammatory reparative phase following AMI. In AMI patients, both of gene expressions related to complement, natural killer cells, CD3+, CD8+ T cells, B cells and the quantity of these immune cells have been reported to decrease.Citation47 Another study indicated that CD8+ T cells might contribute to acute coronary events through their pro-inflammatory cytotoxic effects.Citation9,Citation48 In addition, neutrophils provide the first line of defense against invading microorganisms and tissue injury, and they also play an important role in the resolution of inflammation and repair.Citation49 In our study, we found that CD8+ T cells were enriched in normal samples while neutrophils were enriched in AMI samples. Therefore, we can develop new protocols targeting these immune cells to improve the outcome of patients with AMI.
Several subsets of early recruited and activated neutrophils in cardiac necrosis are closely associated with post-infarction myocardial injury.Citation50,Citation51 However, controversial results may be due to the fact that this treatment also eliminates macrophages and some systemic inflammatory molecules,Citation52,Citation53 raising major concerns about the potential induction of immunosuppression and delaying clinical trials in humans. It is important to clarify the expression of neutrophil-associated cardiomyocyte proteins. Our study explored the correlation between AQP9, MMP9 and SOCS3 and immune cells in the acute MI-mice model, which were positively correlated with neutrophils. We elucidated for the first time that immune regulation by neutrophils may be able to target AQP9, MMP9 and SOCS3 for myocardial repair, providing a theoretical basis for immune-targeted therapy for MI.
Recently, researchers have investigated new immunotherapy treatment schemes for AMI. Immune-related genes may be a good choice. For example, defects in the TLR2 or TLR4 gene in mice can prevent cardiac remodeling, effectively reducing maladaptive ventricular remodeling after AMI.Citation54 The participation of FPR1 in the inflammatory response can protect against myocardial ischemia-reperfusion injuries.Citation55 In rat cardiomyocytes, it was found that activation of FPR1 could contribute to the cardioprotective actions of Ac-ANX-A1 (2-26).Citation56 Furthermore, the study found that AQP9 could be inhibited by miR-212 overexpression by activating the PI3K/Akt signaling pathway, which results in the promotion of vascular regeneration, decreased cardiomyocyte apoptosis, and improving ventricular remodeling in rat models of AMI.Citation57 In addition, the IL1R2 gene, which controls cell metabolism, as well as the immune response induced by many cytokines, plays a key role in AMI. The study also reported that IL1R2 contributes to atherosclerosis, which is closely associated with AMI.Citation58,Citation59 In general, the DEGs TLR2, FPR1, AQP9, and IL1R2 also emerged in our study.
We used five ML methods to identify featured immune-related genes in patients with AMI. Among these five classifiers, random forest and XGBoost performed well. The TLR2 and FPR1, AQP9, and IL1R2 were the most significant top 20 genes in the random forest and the XGBoost diagnostic model, respectively. Moreover, AQP9 showed significant differences in the in vivo animal model in our study. These genes can provide a novel therapeutic target for AMI and contribute to personalized medicine, which will benefit more patients. Based on the immune-related genes closely associated with the progression of AMI, we may formulate a new diagnosis workup, estimate prognosis, and provide targeted treatment. Definitely, significant study is need before targeted therapy can be introduced for clinical application.
To date, targeted therapy for AMI is currently being evaluated in clinical trials. In this study, we comprehensively analyzed immune-related genes and immune cell components in the peripheral blood of patients with AMI using bioinformatics strategies. We used five ML methods to identify featured immune-related genes in AMI patients, among which high expression of AQP9, MMP9 and SOCS3 genes were validated in MI mouse model. Therefore, constructing ML models based on these biomarkers could be a valuable approach for diagnosing AMI in clinical practice. However, there were still some limitations in our study. First, our sample size was relatively small and we need more samples for further research. Second, we did not compare the characteristics between different groups of patients. Third, the specific usage of the diagnostic models was not elaborated. Furthermore, more clinical characteristics such as abdominal obesity or smoking should be involved to better reflect the true characteristics of AMI. Overall, our model still needs more validation in in vitro and in vivo experiments to confirm its clinical application.
Abbreviations
AMI, acute myocardial infarction; WGCNA, weighted gene co-expression analysis; ML, machine learning; LASSO, least absolute shrinkage; SVM, support vector machine; XGBoost, extreme gradient boosting; ssGSEA, single-sample gene set enrichment analysis; CCR, chemokine receptor; SOCS3, suppressor of cytokine signaling 3; DEGs, differentially expressed genes; MI, myocardial infarction; NSTEMI, non-ST-segment elevation myocardial infarction; PCA, principal component analysis; KEGG, Kyoto Encyclopedia of Genes and Genomes; PPI, protein–protein interaction; GO, Gene Ontology; BP, biological process; CC, cellular component; MF, molecular function; AUC, areas under the curve of the receiver operating characteristic (ROC).
Data Sharing Statement
The datasets presented in this study can be found in online repositories. The names of the repository/repositories and accession number(s) can be found below: https://www.ncbi.nlm.nih.gov/geo/, GSE123342; GSE29111; GSE48060; GSE61145; GSE62646; GSE66360.
Ethics Statement
The animal study was reviewed and approved by the Institutional Review and Ethics Board of the First Affiliated Hospital of Nanjing Medical University, Jiangsu Province Hospital.
Author Contributions
All authors made a significant contribution to the work reported, whether that is in the conception, study design, execution, acquisition of data, analysis and interpretation, or in all these areas; took part in drafting, revising or critically reviewing the article; gave final approval of the version to be published; have agreed on the journal to which the article has been submitted; and agree to be accountable for all aspects of the work.
Disclosure
The authors declare that the research was conducted in the absence of any commercial or financial relationships that could be construed as a potential conflict of interest.
Acknowledgments
We acknowledge GEO database for providing their platforms and contributors for uploading their meaningful datasets.
Additional information
Funding
References
- Harjola VP, Lassus J, Sionis A, et al. Clinical picture and risk prediction of short-term mortality in cardiogenic shock. Eur J Heart Fail. 2015;17(5):501–509. doi:10.1002/ejhf.260
- McManus DD, Piacentine SM, Lessard D, et al. Thirty-year (1975 to 2005) trends in the incidence rates, clinical features, treatment practices, and short-term outcomes of patients <55 years of age hospitalized with an initial acute myocardial infarction. Am J Cardiol. 2011;108(4):477–482. doi:10.1016/j.amjcard.2011.03.074
- Gulati R, Behfar A, Narula J, et al. Acute myocardial infarction in young individuals. Mayo Clin Proc. 2020;95(1):136–156. doi:10.1016/j.mayocp.2019.05.001
- Roth GA, Huffman MD, Moran AE, et al. Global and regional patterns in cardiovascular mortality from 1990 to 2013. Circulation. 2015;132(17):1667–1678. doi:10.1161/CIRCULATIONAHA.114.008720
- Abed MA, Khalil AA, Moser DK. The contribution of symptom incongruence to prehospital delay for acute myocardial infarction symptoms among Jordanian patients. Res Nurs Health. 2015;38(3):213–221. doi:10.1002/nur.21658
- Xie Y, Wang Y, Zhao L, Wang F, Fang J. Identification of potential biomarkers and immune cell infiltration in acute myocardial infarction (AMI) using bioinformatics strategy. Bioengineered. 2021;12(1):2890–2905. doi:10.1080/21655979.2021.1937906
- Kologrivova I, Shtatolkina M, Suslova T, Ryabov V. Cells of the immune system in cardiac remodeling: main players in resolution of inflammation and repair after myocardial infarction. Front Immunol. 2021;12:664457. doi:10.3389/fimmu.2021.664457
- Zhao E, Xie H, Zhang Y. Predicting diagnostic gene biomarkers associated with immune infiltration in patients with acute myocardial infarction. Front Cardiovasc Med. 2020;7:586871. doi:10.3389/fcvm.2020.586871
- Ong SB, Hernández-Reséndiz S, Crespo-Avilan GE, et al. Inflammation following acute myocardial infarction: multiple players, dynamic roles, and novel therapeutic opportunities. Pharmacol Ther. 2018;186:73–87. doi:10.1016/j.pharmthera.2018.01.001
- Ministrini S, Carbone F, Montecucco F. Updating concepts on atherosclerotic inflammation: from pathophysiology to treatment. Eur J Clin Invest. 2021;51(5):e13467. doi:10.1111/eci.13467
- Orn S, Manhenke C, Squire IB, Ng L, Anand I, Dickstein K. Plasma MMP-2, MMP-9 and N-BNP in long-term survivors following complicated myocardial infarction: relation to cardiac magnetic resonance imaging measures of left ventricular structure and function. J Card Fail. 2007;13(10):843–849. doi:10.1016/j.cardfail.2007.07.006
- Oba T, Yasukawa H, Hoshijima M, et al. Cardiac-specific deletion of SOCS-3 prevents development of left ventricular remodeling after acute myocardial infarction. J Am Coll Cardiol. 2012;59(9):838–852. doi:10.1016/j.jacc.2011.10.887
- Xu JY, Xiong YY, Lu XT, Yang YJ. Regulation of type 2 immunity in myocardial infarction. Front Immunol. 2019;10:62. doi:10.3389/fimmu.2019.00062
- Liu W, Shen J, Li Y, et al. Pyroptosis inhibition improves the symptom of acute myocardial infarction. Cell Death Dis. 2021;12(10):852. doi:10.1038/s41419-021-04143-3
- Xiong YY, Gong ZT, Tang RJ, Yang YJ. The pivotal roles of exosomes derived from endogenous immune cells and exogenous stem cells in myocardial repair after acute myocardial infarction. Theranostics. 2021;11(3):1046–1058. doi:10.7150/thno.53326
- Jukes E. Encyclopedia of machine learning and data mining (2nd edition). Reference Rev. 2018;32(7/8):3–4. doi:10.1108/RR-05-2018-0084
- Chen C, Grennan K, Badner J, et al. Removing batch effects in analysis of expression microarray data: an evaluation of six batch adjustment methods. PLoS One. 2011;6(2):e17238. doi:10.1371/journal.pone.0017238
- Li W. Volcano plots in analyzing differential expressions with mRNA microarrays. J Bioinform Comput Biol. 2012;10(6):1231003. doi:10.1142/S0219720012310038
- Walter W, Sánchez-Cabo F, Ricote M. GOplot: an R package for visually combining expression data with functional analysis. Bioinformatics. 2015;31(17):2912–2914. doi:10.1093/bioinformatics/btv300
- Langfelder P, Horvath S. WGCNA: an R package for weighted correlation network analysis. BMC Bioinform. 2008;9:559. doi:10.1186/1471-2105-9-559
- Kuhn M. Caret: classification and regression training. 2013.
- Breiman, L. Random Forests. Machine Learning 45, 5–32 (2001). 10.1023/A:1010933404324
- Dimitriadou E, Hornik K, Leisch F, Meyer D, Weingessel A. e1071: misc functions of the department of statistics (e1071). 2011.
- Friedman J, Hastie T, Tibshirani R. Regularization paths for generalized linear models via coordinate descent. J Stat Softw. 2010;33(1):1–22. doi:10.18637/jss.v033.i01
- Sorokin AA, Dmitriev VN, Toan TQ, Reznikov PS. neuralnet: training of neural networks. RJ. 2014;2:30.
- Palla TG, Tayeb S. Intelligent Mirai malware detection for IoT nodes %. J Electron. 2021;10(11):1241. doi:10.3390/electronics10111241
- Percie du Sert N, Hurst V, Ahluwalia A, et al. The ARRIVE guidelines 2.0: updated guidelines for reporting animal research. PLoS Biol. 2020;18(7):e3000410. doi:10.1371/journal.pbio.3000410
- Nichols M, Townsend N, Scarborough P, Rayner M. Cardiovascular disease in Europe 2014: epidemiological update. Eur Heart J. 2014;35(42):2950–2959. doi:10.1093/eurheartj/ehu299
- Yeh RW, Sidney S, Chandra M, Sorel M, Selby JV, Go AS. Population trends in the incidence and outcomes of acute myocardial infarction. N Engl J Med. 2010;362(23):2155–2165. doi:10.1056/NEJMoa0908610
- Reed GW, Rossi JE, Cannon CP. Acute myocardial infarction. Lancet. 2017;389(10065):197–210. doi:10.1016/S0140-6736(16)30677-8
- Visan I. Myocardial infarct inflammation. Nat Immunol. 2018;19(2):99.
- Nahrendorf M. Myeloid cell contributions to cardiovascular health and disease. Nat Med. 2018;24(6):711–720. doi:10.1038/s41591-018-0064-0
- Swirski FK, Nahrendorf M. Cardioimmunology: the immune system in cardiac homeostasis and disease. Nat Rev Immunol. 2018;18(12):733–744. doi:10.1038/s41577-018-0065-8
- Yellon DM, Hausenloy DJ. Myocardial reperfusion injury. N Engl J Med. 2007;357(11):1121–1135. doi:10.1056/NEJMra071667
- Morton AC, Rothman AM, Greenwood JP, et al. The effect of interleukin-1 receptor antagonist therapy on markers of inflammation in non-ST elevation acute coronary syndromes: the MRC-ILA Heart Study. Eur Heart J. 2015;36(6):377–384. doi:10.1093/eurheartj/ehu272
- Ridker PM, Everett BM, Thuren T, et al. Antiinflammatory therapy with canakinumab for atherosclerotic disease. N Engl J Med. 2017;377(12):1119–1131. doi:10.1056/NEJMoa1707914
- Marinković G, Grauen Larsen H, Yndigegn T, et al. Inhibition of pro-inflammatory myeloid cell responses by short-term S100A9 blockade improves cardiac function after myocardial infarction. Eur Heart J. 2019;40(32):2713–2723. doi:10.1093/eurheartj/ehz461
- Scarabelli TM, Stephanou A, Pasini E, et al. Different signaling pathways induce apoptosis in endothelial cells and cardiac myocytes during ischemia/reperfusion injury. Circ Res. 2002;90(6):745–748. doi:10.1161/01.RES.0000015224.07870.9A
- Baker BJ, Akhtar LN, Benveniste EN. SOCS1 and SOCS3 in the control of CNS immunity. Trends Immunol. 2009;30(8):392–400. doi:10.1016/j.it.2009.07.001
- Negoro S, Kunisada K, Fujio Y, et al. Activation of signal transducer and activator of transcription 3 protects cardiomyocytes from hypoxia/reoxygenation-induced oxidative stress through the upregulation of manganese superoxide dismutase. Circulation. 2001;104(9):979–981. doi:10.1161/hc3401.095947
- Yoshimura A, Naka T, Kubo M. SOCS proteins, cytokine signalling and immune regulation. Nat Rev Immunol. 2007;7(6):454–465. doi:10.1038/nri2093
- Chen Z, Laurence A, Kanno Y, et al. Selective regulatory function of Socs3 in the formation of IL-17-secreting T cells. Proc Natl Acad Sci U S A. 2006;103(21):8137–8142. doi:10.1073/pnas.0600666103
- Barin JG, Baldeviano GC, Talor MV, et al. Macrophages participate in IL-17-mediated inflammation. Eur J Immunol. 2012;42(3):726–736. doi:10.1002/eji.201141737
- Jiang T, Zhao Q, Sun H, et al. Scolopendra subspinipes mutilans L. Koch ameliorates rheumatic heart disease by affecting relative percentages of CD4(+)CD25(+)FoxP3 Treg and CD4(+)IL17 T Cells. eCAM. 2019;2019:4674190. doi:10.1155/2019/4674190
- López E, Blázquez R, Marinaro F, et al. The intrapericardial delivery of extracellular vesicles from cardiosphere-derived cells stimulates M2 polarization during the acute phase of porcine myocardial infarction. Stem Cell Rev Rep. 2020;16(3):612–625. doi:10.1007/s12015-019-09926-y
- Frangogiannis NG. The inflammatory response in myocardial injury, repair, and remodelling. Nat Rev Cardiol. 2014;11(5):255–265. doi:10.1038/nrcardio.2014.28
- Yan W, Song Y, Zhou L, et al. Immune cell repertoire and their mediators in patients with acute myocardial infarction or stable angina pectoris. Int J Med Sci. 2017;14(2):181–190. doi:10.7150/ijms.17119
- Varda-Bloom N, Leor J, Ohad DG. Cytotoxic T lymphocytes are activated following myocardial infarction and can recognize and kill healthy myocytes in vitro %. J Mol Cell Cardiol. 2000;32(12):2141–2149. doi:10.1006/jmcc.2000.1261
- Prabhu SD, Frangogiannis NG. The biological basis for cardiac repair after myocardial infarction: from inflammation to fibrosis. Circulation Research. 2016;119(1):91–112. doi:10.1161/CIRCRESAHA.116.303577
- Carbone F, Nencioni A, Mach F, Vuilleumier N, Montecucco F. Pathophysiological role of neutrophils in acute myocardial infarction. Thromb Haemost. 2013;110(3):501–514. doi:10.1160/TH13-03-0211
- Ma Y, Yabluchanskiy A, Iyer RP, et al. Temporal neutrophil polarization following myocardial infarction. Cardiovasc Res. 2016;110(1):51–61. doi:10.1093/cvr/cvw024
- Braunersreuther V, Montecucco F, Pelli G, et al. Treatment with the CC chemokine-binding protein Evasin-4 improves post-infarction myocardial injury and survival in mice. Thromb Haemost. 2013;110(4):807–825. doi:10.1160/TH13-04-0297
- Carbone F, Crowe LA, Roth A, et al. Treatment with anti-RANKL antibody reduces infarct size and attenuates dysfunction impacting on neutrophil-mediated injury. J Mol Cell Cardiol. 2016;94:82–94. doi:10.1016/j.yjmcc.2016.03.013
- Shishido T, Nozaki N, Takahashi H, et al. Central role of endogenous Toll-like receptor-2 activation in regulating inflammation, reactive oxygen species production, and subsequent neointimal formation after vascular injury. Biochem Biophys Res Commun. 2006;345(4):1446–1453. doi:10.1016/j.bbrc.2006.05.056
- Gavins FN. Are formyl peptide receptors novel targets for therapeutic intervention in ischaemia-reperfusion injury? Trends Pharmacol Sci. 2010;31(6):266–276. doi:10.1016/j.tips.2010.04.001
- Qin C, Buxton KD, Pepe S, et al. Reperfusion-induced myocardial dysfunction is prevented by endogenous annexin-A1 and its N-terminal-derived peptide Ac-ANX-A1(2-26). Br J Pharmacol. 2013;168(1):238–252. doi:10.1111/j.1476-5381.2012.02176.x
- Ren N, Wang M. microRNA-212-induced protection of the heart against myocardial infarction occurs via the interplay between AQP9 and PI3K/Akt signaling pathway. Exp Cell Res. 2018;370(2):531–541. doi:10.1016/j.yexcr.2018.07.018
- Dinarello CA. The interleukin-1 family: 10 years of discovery. FASEB J. 1994;8(15):1314–1325. doi:10.1096/fasebj.8.15.8001745
- Peters VA, Joesting JJ, Freund GG. IL-1 receptor 2 (IL-1R2) and its role in immune regulation. Brain Behav Immun. 2013;32:1–8. doi:10.1016/j.bbi.2012.11.006