
Abstract
Background
Hypertension is a common complication in injection drug users (IDU), especially a high proportion of resistant hypertension occurs among them. However, the involving mechanisms remain largely unknown.
Methods
We here investigated the key signaling moieties in resistant hypertension in drug users. Analyses were performed with high-throughput transcriptomic sequencing data of peripheral blood from individuals with drug-sensitive hypertension (Ctrl-DS), IDU with resistant hypertension (IDU-DR), and IDU with sensitive hypertension (IDU-DS).
Results
We showed that 17 and 1 genes in IDU-DS, 48 and 4 genes in IDU-DR were upregulated and downregulated compared Ctrl-DS, and 2 and 4 genes were upregulated and downregulated in IDU-DR compared with IDU-DS, respectively (p ≤ 0.01 and |log2(FC)| ≥ 1). Differentially expressed genes (DEGs) between Ctrl-DS and IDU-DS were mainly involved in Gene ontology terms of immunoglobulin complex and blood microparticle. DEGs between IDU-DS and IDU-DR were mainly involved in immune system process and immunoglobulin complex. DEGs between Ctrl-DS and IDU-DR were mainly involved in immunoglobulin complex, blood microparticle and cytoplasmic vesicle lumen. We identified 2 gene clusters (brown modules, MEbrown; turquoise module, MEturquoise) correlated with IDU-DR and a gene cluster (magenta module, MEmagenta) correlated with IDU-DS by weighted gene co-expression network analysis (WGCNA). Functional analysis demonstrated that pathways of focal adhesion and focalin-1-rich granule lumen were involved in the development of IDU-DR, and the cytosolic large ribosomal subunit may relate to IDU-DR. Further, immune cell infiltration analysis demonstrated that the abundance of dendritic cells (DCs), natural Treg cells (nTreg), and exhausted T cells (Tex) in IDU-DR and IDU-DS, naïve CD8+ T cells in IDU-DS was significantly different compared with that in Ctrl-DS. The abundance of cytotoxic T cells (Tc) was significantly different between IDU-DS and IDU-DR.
Conclusion
Our findings indicated a potential function of immunoregulation mechanisms for resistant hypertension.
Background
Drug use has created an increasingly serious public health problem worldwide, an estimated 269 million people worldwide had used drugs at least once in the previous year in 2018, and about 35.6 million people suffer from drug use disorders.Citation1 Except for psychiatric disorders, hypertension is a common complication, which is characterized by a high proportion of drug-resistant.Citation2,Citation3 Until now, there is little research on revealing the mechanism of hypertension and associated drug-resistant in injection drug users (IDU).
Hypertension is the leading risk factor for cardiovascular disease worldwide, and an estimated 7.7–10.4 million annual deaths are attributable to elevated blood pressure levels.Citation1 The etiology of hypertension is unclear, and its mechanisms are complex. Infiltration of immune cells (T cells, monocytes and macrophages) in perivascular fat, kidneys and myocardium, increased expression of adhesion molecules, production and release of chemokines and cytokines are features of hypertension.Citation4 The studies that examined the role of immune cells in hypertension increased in the recent two decades. In the innate immune system, natural killer (NK) cells play a role in vascular injury in hypertension.Citation5 The neutrophil to lymphocyte ratio and neutrophil count correlates with an increased risk of developing hypertension.Citation6 Dendritic cells (DCs) affect T cell activation to influence blood pressure.Citation7 In the adaptive immune system, B cells could contribute to the elevation in blood pressure and generate a pro-inflammatory environment leading to vascular injury.Citation4 Activated T cells stimulate the vascular production of O2, which is dependent on the nicotinamide adenine dinucleotide phosphate (NADPH) oxidase and promotes hypertension.Citation8
Hypertension may be secondary to several causes, drug use is one of them.Citation9 The mechanism of drug use-induced hypertension remains unclear. Drug dependence results in the suppression of adaptive immune responses, including hypertension-related. Methamphetamine (METH) may limit T-cell proliferation essential for mounting an effective adaptive immune response.Citation10 METH inhibits phagocytosis in macrophages and inhibits MHC II-restricted antigen presentation.Citation11 METH decreases CD4+ T cell frequency and increases the production of IFN-γ while increasing CD8+ T cell frequency and decreasing the production of TNF-α.Citation12 The numbers of regulatory T cells (Tregs) were significantly enhanced in heroin users, and CD4+ T cells from drug users showed significantly reduced proliferation and secretion of IFN-γ and IL-6.Citation13 Immunosuppression caused by drug use may be essential for the occurrence of hypertension in drug users. To study this hypothesis, the transcriptome profiles of drug users with hypertension were explored by high-throughput RNA sequencing. We identified specific DEGs and immune responses in hypertension with drug use. We believe that this study will provide insightful information for understanding the immunoregulation mechanism of hypertension induced by drug use.
Methods
Study Participants and Ethics Approval
Forty-eight hypertension patients were recruited from the Third People’s Hospital of Kunming City, including 16 hypertension patients with drug-sensitive hypertension (Ctrl-DS, no drug use history), 12 injection drug users (IDU) with drug-resistant hypertension (IDU-DR), and 20 IDU with drug-sensitive hypertension (IDU-DS). All participants had no infectious diseases and inflammation. The information of participants is shown in Supplemental Table 1.
Drug-sensitive hypertension is defined as blood pressure returned to normal, or diastolic blood pressure (DBP) reduced over 30 mmHg even though blood pressure did not return to normal after taking anti-hypertensive medications. Patients who did not meet the above criteria were treatment-resistant hypertension.Citation14
This study was approved by the review board of Third People’s Hospital of Kunming City, and the experimental protocols were approved by the institutional review board of the institutions (No. 2018-L-42) and the principles of the Declaration of Helsinki. All subjects provided their written informed consent for inclusion before they participated in this study.
Sample Collection and Preparation
Five milliliters of peripheral blood were collected from 48 hypertension patients using vacuum blood collection tubes containing EDTA anticoagulant. Blood samples were stored at −4°C until for use.
RNA Extraction and Library Construction
Total RNA was isolated from the blood sample using TRIzol reagent (Invitrogen, Carlsbad, CA, USA) following the procedure. The RNA was quantified using NanoDrop ND-1000 (NanoDrop, Wilmington, DE, USA). The RNA integrity was assessed by Bioanalyzer 2100 (Agilent, CA, USA) with RIN number > 7.0. Poly (A) RNA is purified from 1ug total RNA using Dynabeads Oligo (dT) 25-61005 (Thermo Fisher, CA, USA). Then the poly (A) RNA was fragmented into small pieces using Magnesium RNA Fragmentation Module (NEB, USA) under 94°C for 7 min. Then the cleaved RNA fragments were reverse-transcribed to create the cDNA by SuperScript™ II Reverse Transcriptase (Invitrogen, USA), which were next used to synthesize U-labeled second-stranded DNAs with E. coli DNA polymerase I (NEB, USA), RNase H (NEB, cat.m0297, USA) and dUTP Solution (Thermo Fisher, USA). Then an A-base is added to the blunt ends of each strand for ligating the adapter with a T-base overhang. After being treated with the UDG enzyme (NEB, USA), the ligated products are amplified with PCR under conditions: initial denaturation at 95°C for 3 min; 8 cycles of denaturation at 98°C for 15s, annealing at 60°C for 15s, and extension at 72°C for 30s; and then final extension at 72°C for 5 min. The average insert size for the final cDNA library was 300 ± 50 bp. At last, RNA sequencing was performed with the 2×150 bp paired-end sequencing (PE150) on an Illumina Novaseq™ 6000 (LC-Bio Technology Co., Ltd., Hangzhou, China).
Identification of Differentially Expressed mRNA
Fastp (https://github.com/OpenGene/fastp) was used to remove the reads that contained adaptor contamination, low-quality bases and undetermined bases with default parameters. HISAT2 (https://ccb.jhu.edu/software/hisat2) was used to map reads to the reference genome of Homo sapiens GRCh38. Then the mapped reads were assembled using StringTie (https://ccb.jhu.edu/software/stringtie) with default parameters. Then, all transcriptomes from all samples were merged to reconstruct a comprehensive transcriptome using gffcompare (https://github.com/gpertea/gffcompare/). After the final transcriptome was generated, StringTie was used to estimate mRNAs expression levels by calculating FPKM (FPKM = [total_exon_fragments/mapped_reads (millions) × exon_length (kB)]). The differentially expressed mRNAs were selected with |log2(FC)| ≥ 1 and parametric F-test comparing nested linear models (p < 0.05) by R package edgeR (https://bioconductor.org/packages/release/bioc/html/edgeR.html). GO and KEGG enrichment analyses were performed.
Functional Enrichment Analysis
Gene ontology (GO) analysis of DEGs was performed using R with the packages of “TopGO” and “clusterProfiler”. The threshold of GO enrichment was considered significant at p < 0.05.
Protein-Protein Interaction Network Analysis
STRING (https://string-db.org/) was used to generate PPI networks among the differentially expressed mRNAs based on interactions with combined scores > 0.4, and Cytoscape was used to visualize the network.
Weighted Gene Co-Expression Network Analysis (WGCNA)
To screen hub genes that were significantly associated with hypertension induced by drug abuse, we conducted WGCNA using R with the “WGCNA_1.70-3” packageCitation15 under the parameter of FPKM ≥ 1, Pearson correlation coefficient = 0.8 and soft threshold (power) = 6, the threshold for merging modules = 0.5. Hub genes were selected under the condition of gene significance >0.1 and module membership (kME) > 0.9.
Abundance Analysis of Immune Cells
ImmuCellAI is a tool to estimate the abundance of 24 immune cell subsets from gene expression dataset including RNA-Seq, in which the 24 immune cell subsets are comprised of 18 T cell subtypes and 6 other immune cell subtypes (B cells, NK cells, monocytes, macrophages, neutrophils and DCs).Citation16 In the present study, ImmuCellAI was used to compare the abundance of immune cells among Ctrl-DS, IDU-DS and IDU-DR groups.
Reverse Transcription Quantitative PCR
The results of RNA sequencing were validated by quantitative reverse transcription PCR (RT-qPCR). Total DNA was extracted using TriQuick Reagent (Solarbio Science, Beijing, China). Reverse Transcription was performed using RT First-Strand Synthesis Kit (Servicebio, Wuhan, China) was used to create the first cDNA strand. The reverse transcription mixture (15 μL) contained 1 μL Oligo (dT)18 Primer (50 µM), 1 μL Random Hexamer primer (50 µM), 2 μL total RNA (200 ng/μL), and 11 ul RNase-Free ddH2O. After the mixture was incubated at 65°C for 5 min, 4 μL 5 × Reaction Buffer and 1 μL RT Enzym Mix were added. cDNA synthesis was conducted at 25°C for 5 min, 42°C for 30 min, and 85°C for 5 s.
The qPCR reaction mixture (20 μL) contained 10 μL 2 × SuperReal PreMix Plus, 0.6 μL Primer F/R (10 µM), 2 μL cDNA (40 ng), 0.6 μL 50 × Rox Reference Dye, 6.2 μL nuclease-free Water.The qPCR reaction was performed at the following conditions: initial denaturation at 95°C for 15 min; 40 cycles of denaturation at 95°C for 30s, annealing and extension at 60°C for 60s; 95°C for 60s, 55°C for 30s, 95°C for 30s for the dissolution curve. The internal reference gene was GAPDH. Each experiment was performed in triplicate. PCR primers and amplification conditions used in this study are shown in .
Table 1 Primer Sequences Used for Quantitative Reverse Transcription PCR (qRT-PCR) in This Study
Statistical Analysis
Statistical analyses were performed using SPSS 20.0. All data are expressed as mean ± SEM. Student’s t-test was used for analyzing RT-qPCR results, p < 0.05 was considered statistically significant. GraphPad Prism 8.0 was used to prepare the graphs.
Results
Differential Expression of mRNA in the Blood
Blood samples from 48 hypertension patients, including 16 hypertension patients with drug-sensitive hypertension (Ctrl-DS, no drug use history), 20 injection drug users (IDU) with drug-sensitive hypertension (IDU-DS), and 12 IDU with drug-resistant hypertension (IDU-DR), were subjected to transcriptomic sequencing. The gene expression differences across the Ctrl-DS, IDU-DS and IDU-DR groups were then evaluated. Compared to the Ctrl-DS group, 17 upregulated and 1 downregulated gene in IDU-DS, 48 upregulated and 4 downregulated genes in IDU-DR were identified; and 2 upregulated and 4 downregulated genes were identified in IDU-DR compared with IDU-DS (). Among these differentially expressed genes (DEGs), IGHA2, IGHA1, IGHG2, JCHAIN and TNFAIP8L2 between Ctrl-DS and IDU-DS groups, PI3, FOS and SLIP between Ctrl-DS and IDU-DR groups were significantly differentially expressed (). Furthermore, there were 15 common DEGs in IDU-DR and IDU-DS compared with the Ctrl-DS group (), which may be the signature transcription factors of hypertension induced by drug use.
Figure 1 Differentially expressed genes (DEGs) among IDU-DS, Ctrl-DS and IDU-DR. (A) Volcano plot of DEGs. The left panel shows the volcano plot of DEGs between Ctrl-DS and IDU-DS; the middle panel shows the volcano plot of DEGs between Ctrl-DS and IDU-DR; the right panel shows the volcano plot of DEGs between IDU-DS and IDU-DR. The significant DEGs were defined as genes with a p ≤ 0.01 and |log2(FC)| ≥ 2. DEGs with green marker indicates down-expressed and red marker indicates up-expressed in Ctrl-DS (The left and middle panel). In the right panel, DEGs with green marker indicate down-expressed and red marker indicates up-expressed in IDU-DS. (B) Violin plots showing expression of the most significant DEGs among IDU-DS, Ctrl-DS and IDU-DR. (C) Venn diagrams of the numbers of DEGs among IDU-DS, Ctrl-DS and IDU-DR. (D) Validation of transcripts of genes with a 5-fold difference by quantitative reverse transcription PCR (RT-qPCR). Data are presented as mean ± SEM (n = 3). GAPDH was used as a housekeeping internal control. Transcript expression was quantified relative to the expression level of GAPDH by the 2−ΔΔCT method. The statistical significance was indicated as *p < 0.05, and **p < 0.001.
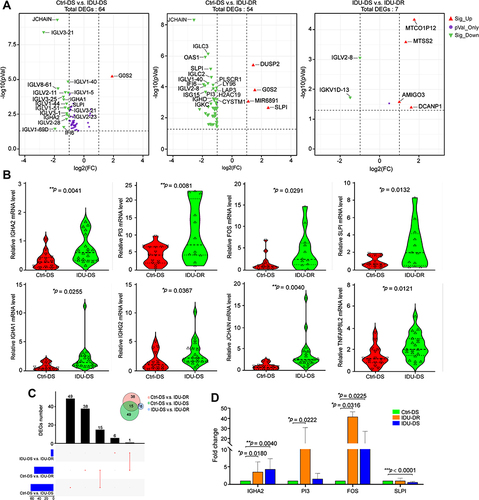
Four DEGs were validated by RT-qPCR (). Compared with the Ctrl-DS group, the expression of IGHA2 was significantly upregulated in IDU-DR (p < 0.05) and IDU-DS (p < 0.05). FOS was significantly upregulated in IDU-DS and IDU-DR groups (p < 0.05). PI3 was significantly upregulated in IDU-DR. SLIP was not differentially expressed in IDU-DR, but downregulated in IDU-DS compared with IDU-DS.
Cluster Analysis of DEGs
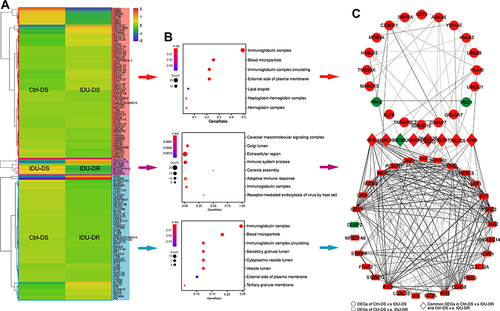
A cluster analysis of the differentially expressed mRNAs was conducted and the results are shown in heatmaps (). The expression patterns of DEGs were similar in the three groups, which means the DEGs in each group may be enriched in the same signaling pathways.
Figure 2 Bioinformatics analysis for significant DEGs. (A) GO enrichment of significant DEGs between Ctrl-DS and IDU-DS, IDU-DR and IDU-DS, Ctrl-DS and IDU-DR. (B) Heatmap diagrams of DEGs expression show the similarity of gene expression patterns in Ctrl-DS and IDU-DS groups. Red indicates up-expressed mRNAs, and blue indicates down-expressed mRNAs. (C) PPI network of the DEGs between Ctrl-DS and IDU-DS, Ctrl-DS and IDU-DR. DEGs with red marker indicate up-regulated genes, and green marker indicates down-expressed in IDU-DS (upper panel of the figure) and IDU-DR (lower panel of the figure). The middle panel of the figure shows common DEGs in IDU-DS and IDU-DR compared with Ctrl-DS, the red marker indicates up-expressed, and the green marker indicates down-expressed in both groups.
Functional Analyses for DEGs
Functional analyses for DEGs demonstrated that 64 DEGs between Ctrl-DS and IDU-DS were mainly involved in Gene ontology (GO) terms of immunoglobulin complex and blood microparticle. 576 DEGs (p < 0.05 only) between IDU-DS and IDU-DR were mainly involved in GO terms of immune system process and immunoglobulin complex. 54 DEGs between Ctrl-DS and IDU-DR were mainly involved in GO terms of immunoglobulin complex, blood microparticle and cytoplasmic vesicle lumen ().
PPI Network Analysis of Significant DEGs
The PPI network of the DEGs in Ctrl-DS and IDU-DS consisted of 28 nodes (genes), including 3 downregulated and 25 upregulated in IDU-DS and 71 edges (interactions), the PPI network of the DEGs in Ctrl-DS and IDU-DR consisted of 37 nodes (genes), including 2 downregulated and 35 upregulated in IDU-DR and 278 edges (interactions). There were 6 common DEGs in 2 comparison groups, and G0S2 was downregulated in both IDU-DS and IDU-DR compared with the Ctrl-DS group. The DEGs between IDU-DR and Ctrl-DS had a higher degree of interaction than that between Ctrl-DS and IDU-DR ().
PPI network analysis showed that proteins of the DEGs in IDU-DS, IDU-DR and Ctrl-DS have more interactions among themselves than what would be expected for a random set of proteins of similar size drawn from the genome. These results indicate that the proteins were partially biologically connected.
WGCNA Analysis
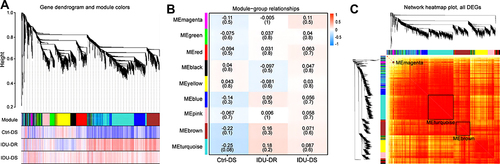
A hierarchical clustering tree was established with the 3600 genes with FPKM > 1 in each sample, and nine modules were identified (). Correlation analysis between the modules and samples showed that brown module (MEbrown) and turquoise module (MEturquoise) were highly (and positively) correlated with IDU-DR, while magenta midule (MEmagenta) and retina were highly (and positively) correlated, as depicted in . Analysis of interactions among the gene modules revealed that the genes in these modules have a high degree of association, suggesting that genes in MEbrown, MEturquoise and ME magenta interact closely with those in the module ().
Figure 3 Weighted gene co-expression network analysis for genes with FPKM > 1. (A) Cluster dendrogram of genes, Upper portion of the figure is the gene cluster tree. A leaf represents a gene while the branches represent different gene modules. Different colors in the middle portion of the dynamic tree cut represent different modules. The lower portion of the figure shows the correlation between the module and the sample, red indicates positive correlation and blue indicates negative correlation. (B) The details of module – sample relationships. The numbers represent the correlation between the module and the sample. Closer the value is to 1, the stronger the positive correlation between the module and the sample; closer to −1, the stronger the negative correlation. The number in brackets represents the value of p. (C) Network heatmap of the gene modules. The tree represents a module (top and left), and the branch represents a gene. The darker the color of the dot (white → yellow → red), the stronger the connectivity between the two genes corresponding to the row and column.
The hub genes of MEbrown, MEturquoise, and MEmagenta were selected according to the criteria of gene significance > 0.1 and kME > 0.9. Finally, 73, 57, and 16 hub genes were obtained in MEbrown, MEturquoise, and MEmagenta, respectively (). Hub genes had a high degree of interaction within each module, especially SLC15A4, APBB1IP, PRKCD, and MAP3K3 in MEbrown, FLI1 and HNRNPK in MEturquoise were the center of the PPI network. MEmagenta has a higher degree of interaction than that in MEbrown and MEturquoise overall ().
Figure 4 Bioinformatics analysis for hub genes of MEbrown, ME turquoise and MEmagenta. (A) Scatterplot of gene significance (y-axis) vs module membership (x-axis). The hub genes were selected with gene significance > 0.1 and module membership > 0.9. (B) PPI network analysis of the hub genes. The grayscale value of each line correlates with the degree of interaction. (C) GO enrichment of the hub genes.
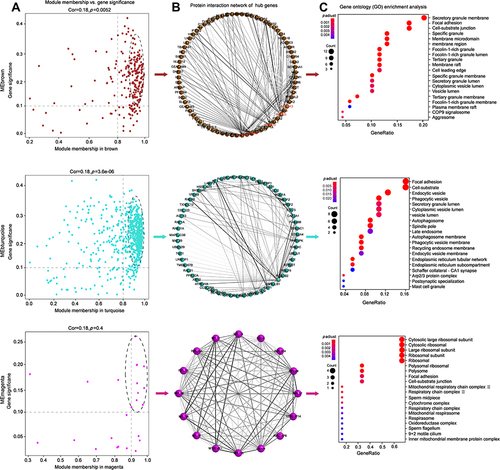
The high degree of interaction among hub genes suggests a biological connection for signaling pathways involved in the biological process of hypertension induced by drug use. Functional analyses demonstrated that hub genes in MEbrown and MEturquoise were involved in focal adhesion, secretory granule lumen and cytoplasmic vesicle lumen, which is consistent with the function of DEGs in the Ctr-DS and IDU-DR groups. Hub genes in MEmagenta were involved in the ribosomal subunit (). It was indicated that the process of focal adhesion and vesicle lumen was related to resistant hypertension with injection drug abuse.
Abundance of Immune Cells
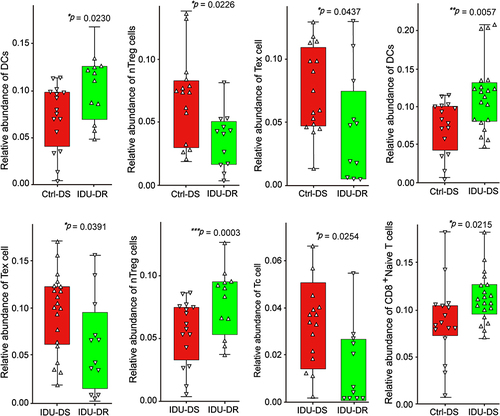
We compared the abundance of immune cell subsets among Ctrl-DS, IDU-DS and IDU-DR groups (). The abundance of dendritic cells (DCs) was significantly higher in IDU-DR and IDU-DS than that in Ctrl-DS (p < 0.05). The abundance of natural Treg cells (nTreg), and exhausted T cells (Tex) were significantly lower in IDU-DR than that in the Ctrl-DS group, and the abundance of CD8+ T cells was higher in IDU-DS than that in Ctrl-DS. The abundance of Tex, nTreg and Tc was lower than that in IDU-DS group. It was suggested that the immune cell was involved in the pathogenesis of hypertension in drug users.
Figure 5 Immune cell abundance in peripheral blood of patients with hypertension. The y-axis indicates the relative abundance of cells. The upward triangle indicates individuals with higher abundance of immune cells, and the downward triangle indicates individuals with lower abundance of immune cells. *p < 0.05, **p < 0.01 and *** p <0.001.
Discussion
Drug use contributes to impaired immune function and increased susceptibility to various diseases has been widely reported.Citation17,Citation18 Although immunity plays a leading role in the pathophysiology of hypertension,Citation19 it is not clear whether the immunosuppressive effect of drugs is the etiology of (drug-resistant) hypertension in drug users. Therefore, we analyzed the transcriptome characteristics of peripheral blood in drug-resistant hypertension patients with drug use and found that the immune system plays an important role in (drug-resistant) hypertension with drug use.
We showed that CX3CR1, FOS, IGHA2, JCHAIN and HLA-B were significantly differentially expressed in hypertension with drug use. It is reported that CX3CR1 exerts protective properties by modulating the invasion of inflammatory cells in hypertensive renal injury,Citation20 and allele frequencies of CX3CR1 V249I polymorphism were found associated with hypertension.Citation21 FOS related to angiogenesis were overexpressed in renal medullary hypertension,Citation22 the present study is consistent with these observations. Further, we found genes that coding Ig alpha chain C region (such as IGHA1, IGHA2) related to the activating of immune mediators,Citation23 and coding Ig lambda chain V region (such as IGLV1-51, IGLV2-11) and Ig kappa chain V region (such as IGKV1-5 and IGKV4-1) of immunoglobulin light chains that participates in the antigen recognitionCitation24 was significantly differentially expressed. What’s more, JCHAIN related to IgA binding,Citation25 and HLA-B related to antigen processing and presentation were significantly differentially expressed in hypertension with drug use, suggesting that the immune system plays an important role in hypertension with drug use.
Through bioinformatic analysis of WGCNA, we determined the most significant modules using traits of IDU-DS and IDU-DR. We selected hub genes with a high degree of gene clustering, in which the relationship between traits and modules was the most significant. The present study showed that genes associated with IDU-DR were mainly clustered in the MEbrown and MEturquoise. The enriched functional confirmed these genes in these two modules were involved in the GO term of focal adhesion pathway, which was consistent with a previous study that hypertension promotes phosphorylation of focal adhesion kinase.Citation26 Genes associated with IDU-DS were mainly clustered in the MEmagenta, which involved the GO term of the ribosomal subunit. It was reported that the activity of the ribosomal protein kinase (RSK) pathway was enhanced in hypertension.Citation27 Combined with the present study, it was suggested that the ribosomal pathway may be related to drug-sensitive hypertension in injection drug users.
The regulatory function of the immune system depends on immune cells, and there is a large amount of evidence to show that various immune cells infiltrate blood vessels, kidneys during hypertension. We obtained the abundance of immune cells in peripheral blood of hypertension patients via ImmuCellAI, and we found that the abundance of CD4+ T subtype of nTreg cells was significantly lower in IDU-DR, which was consistent with the observation that there is a statistically significant decrease in peripheral blood CD4+ T in hypertensive patients.Citation28 It was widely assumed that CD4+ T cells were the key elements in the pathogenesis of hypertension.Citation29 CD4+ T cells invade the kidney and vasculature during hypertension, causing endothelial dysfunction.Citation7 It is reported that administration of injections of Tregs improves inflammation in angiotensin II-induced hypertension,Citation30 but blood pressure was not significantly modified.Citation31 However, mice treated with high doses of Treg maintained a decrease in blood pressure, which was associated with reduced immune cell infiltration.Citation32,Citation33 Altogether, it is suggested that a loss of Treg contributes to the development of hypertension. Combined with the results of the present study, the decrease of nTreg cells may be a risk factor for hypertension in drug use. However, further research needs to be done to investigate the relationship between DEGs and the abundance of immune cells.
The abundance of CD8+ T cells was significantly higher in IDU-DS, which was consistent with the results of a clonal expansion of the CD8+ T cells population in hypertension.Citation34 Multiple studies have reported that DCs affect T cell activation to influence blood pressure.Citation35,Citation36 In the present study, we found that the abundance of DCs was significantly higher in IDU-DS and IDU-DR compared with the Ctrl-DS group. DCs produce cytokines that trigger the activation and proliferation of T cells that produce IL-17A, TNFα, and IFN-γ, all of which contribute to hypertension.Citation37 The above results suggested the importance of immunological regulations in hypertension of IDU.
Drug-resistant hypertension has a high proportion of drug use-induced hypertension. Findings from our study suggest that the significant differential genes in drug-resistant hypertension are mainly enriched in immunoglobulin complex, compared with drug-sensitive hypertension. Although the pathogenesis of resistant hypertension remains poorly understood, it is believed to involve aldosterone-induced fluid retention.Citation38 Also, several signal pathways have been studied and reported to be associated with the development and progression of resistant hypertension, including modulation of sympathetic activity by leptin and aldosterone, arterial stiffness, endothelial dysfunction and variations in the renin-angiotensin-aldosterone system (RAAS).Citation39 Recent research shows that miRNA participates in resistant hypertension by regulating aldosterone.Citation40 In the present study, by analyzing the correlation between the abundance of immune cells and the degree of DBP reduction after drug treatment, we found that the abundance of Tex, nTreg and Tc cells were different between the IDU-DS and IDU-DR groups, which indicated that these T subsets are closely related to resistant hypertension in drug users. One strength of this study is that it is the first time to investigate the relationship between immune cells and resistant hypertension. The limitation of the present study is that we were unable to perform molecular function experiments to verify the role of CD4+ Treg cells in resistant hypertension, which is a requisite to reveal the essential differences between resistant hypertension and drug-sensitive hypertension.
Conclusions
In conclusion, the immune system was an important element in the pathogenesis of hypertension in drug users, especially the nTreg subset was related to resistant hypertension. We believe that when our findings are supported by further studies, there will be a novel insight into elucidating the mechanism of drug use-induced hypertension, as well as potential therapeutic targets.
Data Sharing Statement
The Sequence Read Archive (SRA) data for transcriptomic analyses is available in GenBank under BioProject accession number PRJNA751734 and BioSample accession number SAMN20525641.
Ethics Approval and Consent to Participate
This study was approved by the review board of Third People’s Hospital of Kunming City, and the experimental protocols were approved by the institutional review board of the institutions (No. 2018-L-42). All subjects provided their written informed consent for inclusion before they participated in this study.
Author Contributions
All authors made a significant contribution to the work reported, whether that is in the conception, study design, execution, acquisition of data, analysis and interpretation, or in all these areas; took part in drafting, revising or critically reviewing the article; gave final approval of the version to be published; have agreed on the journal to which the article has been submitted; and agree to be accountable for all aspects of the work. JJ, JQY, YRD and YX are co–first authors.
Disclosure
The authors have declared that no conflict of interest exists.
Additional information
Funding
References
- Zhou B, Perel P, Mensah GA, et al. Global epidemiology, health burden and effective interventions for elevated blood pressure and hypertension. Nat Rev Cardiol. 2021;18(1):1–18. doi:10.1038/s41569-020-00473-5
- Chin KM, Channick RN, Rubin LJ. Is methamphetamine use associated with idiopathic pulmonary arterial hypertension? Chest. 2006;130(6):1657–1663. doi:10.1378/chest.130.6.1657
- Darke S, Duflou J, Kaye S. Prevalence and nature of cardiovascular disease in methamphetamine-related death: a national study. Drug Alcohol Depend. 2017;179:174–179. doi:10.1016/j.drugalcdep.2017.07.001
- Caillon A, Paradis P, Schiffrin EL. Role of immune cells in hypertension. Br J Pharmacol. 2019;176(12):1818–1828. doi:10.1111/bph.14427
- Kossmann S, Schwenk M, Hausding M, et al. Angiotensin II-induced vascular dysfunction depends on interferon-gamma-driven immune cell recruitment and mutual activation of monocytes and NK-cells. Arterioscler Thromb Vasc Biol. 2013;33(6):1313–1319. doi:10.1161/ATVBAHA.113.301437
- Liu X, Zhang Q, Wu H, et al. Blood neutrophil to lymphocyte ratio as a predictor of hypertension. Am J Hypertens. 2015;28(11):1339–1346. doi:10.1093/ajh/hpv034
- Zhang RM, McNerney KP, Riek AE, Bernal-Mizrachi C. Immunity and hypertension. Acta Physiol. 2021;231(1):e13487. doi:10.1111/apha.13487
- Guzik TJ, Hoch NE, Brown KA, et al. Role of the T cell in the genesis of angiotensin II induced hypertension and vascular dysfunction. J Exp Med. 2007;204(10):2449–2460. doi:10.1084/jem.20070657
- Lv D, Zhang M, Jin X, et al. The body mass index, blood pressure, and fasting blood glucose in patients with methamphetamine dependence. Medicine. 2016;95(12):e3152. doi:10.1097/MD.0000000000003152
- Potula R, Haldar B, Cenna JM, Sriram U, Fan S. Methamphetamine alters T cell cycle entry and progression: role in immune dysfunction. Cell Death Discov. 2018;4(1):44. doi:10.1038/s41420-018-0045-6
- Talloczy Z, Martinez J, Joset D, et al. Methamphetamine inhibits antigen processing, presentation, and phagocytosis. PLoS Pathog. 2008;4(2):e28. doi:10.1371/journal.ppat.0040028
- Mata MM, Napier TC, Graves SM, Mahmood F, Raeisi S, Baum LL. Methamphetamine decreases CD4 T cell frequency and alters pro-inflammatory cytokine production in a model of drug abuse. Eur J Pharmacol. 2015;752:26–33. doi:10.1016/j.ejphar.2015.02.002
- Hansen W, Luppus S, Barthel R, et al. Heroin-assisted treatment of heroin-addicted patients normalizes regulatory T cells but does not restore CD4(+) T cell proliferation. Addict Biol. 2021;26(4):e12998. doi:10.1111/adb.12998
- Xinzhi W. New diagnostic and therapeutic criteria for hypertension. Chin J Med. 1979;4(10):62–63.
- Langfelder P, Horvath S. WGCNA: an R package for weighted correlation network analysis. BMC Bioinform. 2008;9(1):559. doi:10.1186/1471-2105-9-559
- Miao YR, Zhang Q, Lei Q, et al. ImmuCellAI: a unique method for comprehensive T-cell subsets abundance prediction and its application in cancer immunotherapy. Adv Sci. 2020;7(7):1902880. doi:10.1002/advs.201902880
- Hernandez-Santini AC, Mitha AN, Chow D, et al. Methamphetamine facilitates pulmonary and splenic tissue injury and reduces T cell infiltration in C57BL/6 mice after antigenic challenge. Sci Rep. 2021;11(1):8207. doi:10.1038/s41598-021-87728-4
- Plein LM, Rittner HL. Opioids and the immune system - friend or foe. Br J Pharmacol. 2018;175(14):2717–2725. doi:10.1111/bph.13750
- Higaki A, Caillon A, Paradis P, Schiffrin EL. Innate and innate-like immune system in hypertension and vascular injury. Curr Hypertens Rep. 2019;21(1):4. doi:10.1007/s11906-019-0907-1
- Ahadzadeh E, Rosendahl A, Czesla D, et al. The chemokine receptor CX3CR1 reduces renal injury in mice with angiotensin II-induced hypertension. Am J Physiol Renal Physiol. 2018;315(6):F1526–F1535. doi:10.1152/ajprenal.00149.2018
- Bagci B, Bagci G, Huzmeli C, Sezgin I, Ozdemir O. Associations of fractalkine receptor (CX3CR1) and CCR5 gene variants with hypertension, diabetes and atherosclerosis in chronic renal failure patients undergoing hemodialysis. Int Urol Nephrol. 2016;48(7):1163–1170. doi:10.1007/s11255-016-1293-0
- Wu YB, Zang WD, Yao WZ, et al. Analysis of FOS, BTG2, and NR4A in the function of renal medullary hypertension. GMR. 2013;12(3):3735–3741. doi:10.4238/2013.September.19.4
- Schroeder HW Jr, Cavacini L. Structure and function of immunoglobulins. J Allergy Clin Immunol. 2010;125(2):S41–S52. doi:10.1016/j.jaci.2009.09.046
- Lefranc MP. Immunoglobulin and T-cell receptor genes: IMGT ((R)) and the birth and rise of immunoinformatics. Front Immunol. 2014;5:22. doi:10.3389/fimmu.2014.00022
- Braathen R, Hohman VS, Brandtzaeg P, Johansen FE. Secretory antibody formation: conserved binding interactions between J chain and polymeric Ig receptor from humans and amphibians. J Immunol. 2007;178(3):1589–1597. doi:10.4049/jimmunol.178.3.1589
- Sugimura K, Fukumoto Y, Nawata J, et al. Hypertension promotes phosphorylation of focal adhesion kinase and proline-rich tyrosine kinase 2 in rats: implication for the pathogenesis of hypertensive vascular disease. Tohoku J Exp Med. 2010;222(3):201–210. doi:10.1620/tjem.222.201
- Cheng PW, Lee HC, Lu PJ, et al. Resveratrol inhibition of Rac1-derived reactive oxygen species by AMPK decreases blood pressure in a fructose-induced rat model of hypertension. Sci Rep. 2016;6(1):25342. doi:10.1038/srep25342
- Sereti E, Stamatelopoulos KS, Zakopoulos NA, Evangelopoulou A, Mavragani CP, Evangelopoulos ME. Hypertension: an immune related disorder? Clin Immunol. 2020;212:108247. doi:10.1016/j.clim.2019.108247
- Rodriguez-Iturbe B, Pons H, Johnson RJ. Role of the immune system in hypertension. Physiol Rev. 2017;97(3):1127–1164. doi:10.1152/physrev.00031.2016
- Kasal DA, Barhoumi T, Li MW, et al. T regulatory lymphocytes prevent aldosterone-induced vascular injury. Hypertension. 2012;59(2):324–330. doi:10.1161/HYPERTENSIONAHA.111.181123
- Kvakan H, Kleinewietfeld M, Qadri F, et al. Regulatory T cells ameliorate angiotensin II-induced cardiac damage. Circulation. 2009;119(22):2904–2912. doi:10.1161/CIRCULATIONAHA.108.832782
- Matrougui K, Abd Elmageed Z, Kassan M, et al. Natural regulatory T cells control coronary arteriolar endothelial dysfunction in hypertensive mice. Am J Pathol. 2011;178(1):434–441. doi:10.1016/j.ajpath.2010.11.034
- Barhoumi T, Kasal DA, Li MW, et al. T regulatory lymphocytes prevent angiotensin II-induced hypertension and vascular injury. Hypertension. 2011;57(3):469–476. doi:10.1161/HYPERTENSIONAHA.110.162941
- Youn JC, Yu HT, Lim BJ, et al. Immunosenescent CD8+ T cells and C-X-C chemokine receptor type 3 chemokines are increased in human hypertension. Hypertension. 2013;62(1):126–133. doi:10.1161/HYPERTENSIONAHA.113.00689
- Ferguson JF, Aden LA, Barbaro NR, et al. High dietary salt-induced dendritic cell activation underlies microbial dysbiosis-associated hypertension. JCI Insight. 2019;5. doi:10.1172/jci.insight.126241
- Lu X, Rudemiller NP, Wen Y, et al. A20 in myeloid cells protects against hypertension by inhibiting dendritic cell-mediated T-cell activation. Circ Res. 2019;125(12):1055–1066. doi:10.1161/CIRCRESAHA.119.315343
- Kirabo A, Fontana V, de Faria AP, et al. DC isoketal-modified proteins activate T cells and promote hypertension. J Clin Invest. 2014;124(10):4642–4656. doi:10.1172/JCI74084
- Acelajado MC, Hughes ZH, Oparil S, Calhoun DA. Treatment of resistant and refractory hypertension. Circ Res. 2019;124(7):1061–1070. doi:10.1161/CIRCRESAHA.118.312156
- Parreira RC, Lacerda LHG, Vasconcellos R, et al. Decoding resistant hypertension signalling pathways. Clin Sci. 2017;131(23):2813–2834. doi:10.1042/CS20171398
- Kara SP, Ozkan G, Yilmaz A, Bayrakci N, Guzel S, Geyik E. MicroRNA 21 and microRNA 155 levels in resistant hypertension, and their relationships with aldosterone. Ren Fail. 2021;43(1):676–683. doi:10.1080/0886022X.2021.1915800