Abstract
Background
Insulin resistance (IR) is known to be characteristic of type 2 diabetes mellitus, and is regarded as an important mechanism in disease pathogenesis. One of the key pathogenetic mechanisms of IR progression is impaired free fatty acid (FFA) metabolism. Plasminogen-activator inhibitor 1 (PAI-1) and key inflammation markers, ie, interleukin 6 (IL-6) and C-reactive protein (CRP), also play a role.
Purpose
To assess the changing levels of the metabolic proinflammation IR markers IL-6, CRP and PAI-1 and their association with the presence or absence of type 2 diabetes mellitus in myocardial infarction (MI) patients during their hospital stay.
Methods
The patients were divided into two groups: group 1 included 95 nondiabetic MI patients, and group 2 enrolled 40 diabetic MI patients. The control group consisted of 30 sex-and age-matched volunteers. Serum IL-6 and CRP levels as well as FFA, glucose, C-peptide, insulin, and plasma PAI-1 concentrations were measured at days 1 and 12 from MI onset.
Results
At day 1, there was an increase in glucose concentrations, which remained high in both groups by day 12 but was much higher in the diabetic patients. Basal insulin and C-peptide levels did not differ significantly from those in the control group. The quantitative insulin sensitivity-check index in both groups was significantly different from that in controls. FFA concentrations at day 1 in both diabetic and nondiabetic patients increased; by day 12, they had decreased but were still higher than the controls. CRP and IL-6 levels at day 1 were higher in all the patients, but diabetic patients had the highest levels; by day 12, the levels were lower but still 2.4-fold (IL-6) and 12.5-fold (CRP) higher than those in the control group.
Conclusion
This study showed that MI is accompanied both by activated inflammatory response and IR. Strong correlations between IL-6 and FFA concentrations demonstrate that nonspecific inflammation factors are involved in IR development in MI patients. Consequently, these inflammatory cytokines might cause the development of IR.
Introduction
Insulin resistance (IR) is known to be a characteristic feature of type 2 diabetes mellitus (T2DM), and is traditionally regarded as an important stage of its pathogenesis: IR in general and diabetic populations is associated with cardiovascular risk factors including hyperglycemia, dyslipoproteinemia, arterial hypertension, obesity, thrombosis, and smoking.Citation1,Citation2
Large clinical trials showed that IR was a predictor of such cardiovascular events as ischemic heart disease and myocardial infarction (MI).Citation3,Citation4 Additionally, it was established that the course of MI as a separate disease is accompanied by IR development and that the pathogenetic mechanisms are unclear. Medical literature has, among others, the following possible reasons for IR development: activation of local inflammation in the area of atherosclerotic lesion and infarct site with enhanced expression of proinflammatory cytokines (IL-6) and acute-phase proteins, including C-reactive protein (CRP), as their key representative.Citation5 An important role of increased CRP levels not only as an MI predictor and a marker of adverse outcome but also as a precursor of IR development was established earlier.Citation6 High CRP levels are thought to result in a change in insulin-action regulation at the cellular level, which could lead to IR.Citation7
Among proinflammatory cytokines contributing to IR development, the role of interleukin (IL)-6, which has autocrine and paracrine properties and is involved in insulin reception and free fatty acid (FFA) metabolism regulation, has been extensively studied. The increase in FFA concentrations in myocardial ischemia could also lead to a reduced sensitivity to insulin in the peripheral tissues.89 Moreover, previous experimental studies demonstrated that IL-6 could induce plasminogen-activator inhibitor (PAI)-1 production. Its activity increase is regarded both as a risk factor for coronary atherothrombosis and MI and as a trigger for IR development.Citation10 PAI-1 is known to modulate insulin signaling in fibroblasts, preventing vitronectin binding to αvβ3-receptors, which in turn decreases insulin-induced protein kinase B phosphorylation.Citation11
According to Juhan-Vague et al, obese patients with hyperinsulinemia and a genotype associated with the increased PAI-1 transcription had a high risk of MI.Citation12 Thus, an analysis of the medical literature allows the suggestion that proinflammatory factors could be involved in IR development in acute coronary events. The detection of a possible association between metabolic changes, indicators, and nonspecific inflammation markers in MI patients, including those with T2DM, can play a role in the choice of treatment strategy in terms of risk stratification in this category of patients.
This study was aimed at assessing the changing levels of the metabolic proinflammation IR markers IL-6, CRP and PAI-1, and their association with presence or absence of T2DM in MI patients during their hospital stay.
Materials and methods
Study subjects and design
A total of 155 MI patients (95 males and 60 females), mean age 65 ± 4.5 years, and 30 sex- and age-matched volunteers (the control group) with no cardiovascular or endocrine diseases were enrolled in the study. The patients were divided into two groups: group I comprised 95 nondiabetic MI patients, and group 2 enrolled 60 diabetic MI patients. The mean T2DM duration was, on average, 6.4 ± 1.5 years. The groups were sex- and age-matched and had similar risk factors for ischemic heart disease, concurrent conditions, and MI complication rate.
The main demographic characteristics of the study patients are summarized in . The patient groups were similar in age, sex, main risk factors of ischemic heart disease, comorbidities, and coronary event incidence (). The study excluded patients older than 75 years and/or with clinically significant concurrent conditions (autoimmune diseases, thyroid gland, or adrenal gland diseases). However, there were more obese patients among those with T2DM compared to nondiabetic patients, according to body mass index (BMI) levels: 29.65 (26.85–34.55) kg/m2 vs 25.5 (23.2–30.1) kg/m2.
Table 1 Initial clinical and anamnestic characteristics of patients
Acute MI was diagnosed according to the 2007 Russian National Cardiology Society guidelines based on clinical, electrocardiographic, echocardiographic, and biochemical signs of the disease. The inclusion criteria were chest pain refractory to nitroglycerin, myocardial ischemia, and necrosis signs (ST-segment elevation and/or new pathologic Q waves on the electrocardiogram, elevated cardiac enzymes: MB fraction of creatine kinase [CK MB] and troponin T). Peak CK MB and troponin T levels did not differ between the groups. Peak CK MB levels were 94.03 ± 17.9 U/L and 137.64 ± 41.1 U/L in the diabetic and nondiabetic patients, respectively (P = 0.916); troponin T concentrations were 1.09 ± 0.92 ng/mL and 0.71 ± 0.41 ng/mL in the diabetic and nondiabetic patients, respectively (P = 0.564).
The exclusion criteria were age >75 years, clinically significant comorbidities (autoimmune diseases, thyroid or adrenal gland diseases), acute coronary syndrome as a complication of percutaneous coronary intervention, or coronary artery bypass surgery.
The patient groups had a similar incidence of major hospital coronary events (). Eighty percent of patients in both groups did not have any signs of acute heart failure, according to the Killip classification (1967) upon admission and during the hospital stay (); however, more than 50% of patients had arrhythmias and impaired conduction diagnosed according to the established criteria.Citation13 The structure and function of the left ventricle did not differ between the groups. Mean left ventricular ejection fraction was 51.25% ± 1.85% in the diabetic patients and 50.42% ± 1.62% in those without T2DM (P = 0.598); mean left ventricular end-diastolic volume was 164.35 ± 10.47 mL in the diabetic patients and 156.43 ± 7.18 mL in the nondiabetic patients (P = 0.649); mean left ventricular end-systolic volume was 79.71 ± 8.32 mL in the diabetic patients and 75.22 ± 5.56 in the nondiabetic patients (P = 0.702).
The groups were similar in the presence/type of coronary artery disease: coronary angiography showed multivessel (more than three vessels) hemodynamically significant coronary artery lesions in both groups (76.5% in the diabetic patients and 62.5% in the nondiabetic patients [P = 0.857]). T2DM compensation was evaluated based on glycated hemoglobin levels (T2DM was considered to be compensated in glycated hemoglobin >7.5%, according to the 2000 European Diabetes Policy Group criteria). Decompensated T2DM was diagnosed in eight (40%) patients.
The study design was approved by the Institutional Review Board of the Research Institute for Complex Issues of Cardiovascular Diseases; all the individuals signed the informed consent before being enrolled in the study. Therapeutic interventions during the follow-up period are listed in .
Table 2 Revascularization and drug therapy during follow-up
Assays
Serum IL-6 concentrations were measured by enzyme-linked immunosorbent assay at days 1 and 12 from the MI onset using Life Technologies (Carlsbad, CA, USA) test-systems. CRP, serum FFA, and glucose concentrations were measured at the same study time points using standard Thermo Fisher Scientific (Vantaa, Finland) test systems on a Konelab 30i biochemistry analyzer (Thermo Fisher Scientific Oy, Vantaa, Finland). C-peptide and insulin concentrations were measured by enzyme-linked immunosorbent assay with BioMedica (Waterloo, NSW, Australia) and Diagnostic Systems Laboratories (Webster, TX, USA) lab kits, respectively. Plasma PAI-1 concentrations were assessed with standard Technoclone (Vienna, Austria) test systems. Additionally, all the patients had their postprandial glycemia, insulin, and C-peptide concentrations measured 2 hours after a standard carbohydrate breakfast (75 g anhydrous glucose dissolved in 250–300 mL water to drink for 3–5 minutes on an empty stomach).
The IR level was estimated using a structural mathematical model incorporating fasting serum insulin and glucose measurement with the quantitative insulin sensitivity-check index (QUICKI) calculation. QUICKI = 1/(log [I0] + log [G0]), where I0 – basal insulinemia (mg/dL), G0 – basal glycemia (mME/mL). According to Katz et al, a mean QUICKI value of 0.382 ± 0.007 correlates with normal tissue sensitivity to insulin, while QUICKI values of 0.331 ± 0.010 and 0.304 ± 0.007 correlate with moderate and severe IR.Citation14
Statistical analysis
Statistical analysis was done using the nonparametric Mann-Whitney test for unpaired samples and the Wilcoxon test for paired samples. The results were presented as median and quartiles. P-values < 0.05 were considered statistically significant. Spearman’s correlation coefficient was calculated to analyze the correlations between the variables. The statistical analysis was performed using Statistica 6.0 (StatSoft, Tulsa, OK, USA).
Results
The diabetic and nondiabetic MI patients were found to have a 1.5-fold and 1.9-fold increase (respectively) in blood glucose levels at day 1 compared to those in the control group (). The increase in basal glucose levels was still present at day 12 in both patient groups, but was more pronounced in the diabetic patients. Postprandial glucose concentrations were 2.6-fold increased in the individuals with MI and T2DM at day 12, while in the nondiabetic patients postprandial glucose levels decreased compared to the basal levels but did not reach those in the controls.
Table 3 Basal and postprandial levels of glucose, insulin, and C-peptide at 1 and 12 days of the MI development
Unlike glucose concentrations, fasting serum insulin and C-peptide levels had a tendency towards increasing in both groups at days 1 and 12 after MI onset, but did not differ from those in the controls (). The change in postprandial levels of those parameters at day 12 was more significant. Indeed, postprandial insulin concentrations both in the diabetic and nondiabetic MI patients crept up in an almost similar way compared to the control and basal levels.
Despite the fact that the changes in glucose metabolism were less pronounced in the nondiabetic MI patients, the integral QUICKI of IR in both groups significantly differed from that in the controls. In the controls, the QUICKI value was 0.38 ± 0.01 and corresponded to the normal tissue sensitivity to insulin. In the group of nondiabetic patients, QUICKI values were 0.316 ± 0.005 and 0.319 ± 0.005 at days 1 and 12, respectively, which were regarded as borderline values between severe and moderate IR. In diabetic MI patients, QUICKI values were 0.296 ± 0.009 and 0.300 ± 0.005, which according to Katz et al corresponded to severe IR.Citation14
Analysis of FFA concentration changes in MI patients showed significant differences compared to the controls both at day 1 and at day 12 of the disease (). At day 1, FFA concentrations in both diabetic and nondiabetic MI patients were seven- and elevenfold higher than those in the controls, respectively. By day 12, the levels had decreased, but were still three- and 4.7-fold higher than those in the controls; thus, in patients with such comorbidity, these changes were more pronounced during the entire follow-up period.
Table 4 Basal level of free fatty acids and type 1 plasminogen activator inhibitor, respectively at 1 and 12 days of the MI development
PAI-1 concentrations were found to be increased in both groups, but at the same time at day 1 the diabetic MI patients had a 4.6-fold increase in PAI-1 levels compared to the controls (). These values were, on average, twofold higher than those in the nondiabetic patients. At day 12 from MI onset, PAI-1 concentrations significantly decreased in both groups; however, they did not reach the control levels.
Measurement of the key inflammation markers showed that at day 1, the whole study population had 3.6- and 19-fold increased IL-6 and CRP concentrations, respectively (). At the same time, the diabetic patients had more pronounced changes in the levels of inflammation markers: IL-6 and CRP concentrations were 5.3-fold and 26-fold higher, respectively (). At day 12, IL-6 and CRP concentrations had decreased in both groups, but were still on average 2.4-fold (IL-6) and 12.5-fold (CRP) higher than those in the controls, the diabetic MI patients having higher IL-6 and CRP levels during the entire follow-up period.
Table 5 Contents of interleukin 6, C-reactive protein in patients with myocardial infarction on the 1st and 12th day of hospitalization
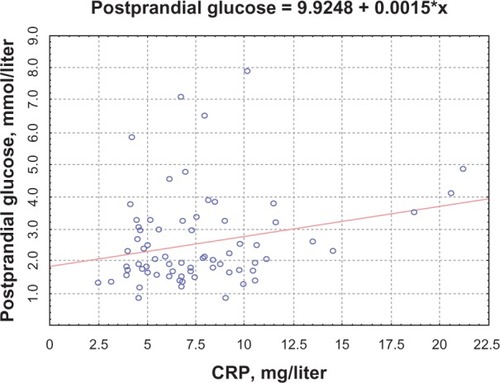
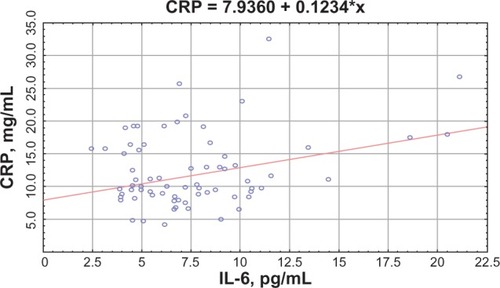
Correlation analysis demonstrated the correlations between CRP and FFA concentrations (R = 0.53, P = 0.04 for the nondiabetic patients; R = 0.41, P = 0.03 for the diabetic patients) (); CRP levels and CK MB activity (R = 0.42, P = 0.03 for the nondiabetic patients; R = 0.38, P = 0.027 for the diabetic patients). The diabetic MI patients had a positive correlation between CRP and PAI-1 concentrations (R = 0.5, P = 0.0027) and a negative one with QUICKI (R = −0.33, P = 0.039). A correlation between basal glucose and IL-6 levels (R = 0.48, P = 0.031 for the nondiabetic patients; R = 0.51, P = 0.023 for the diabetic patients) () and correlations between CRP and postprandial glucose levels were found (R = 0.48, P = 0.045 for the nondiabetic patients; R = 0.51, P = 0.041 for the diabetic patients) ().
Figure 1 Correlation between C-reactive protein (CRP) levels and free fatty acids (FFA).
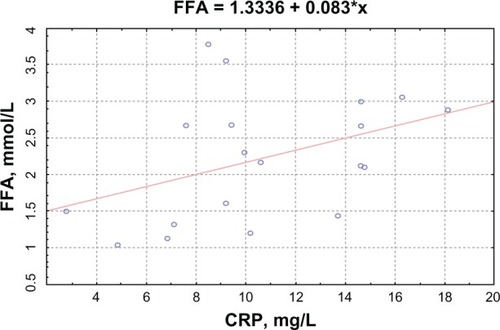
Figure 2 Correlation between basal levels of glucose and interleukin (IL)-6.
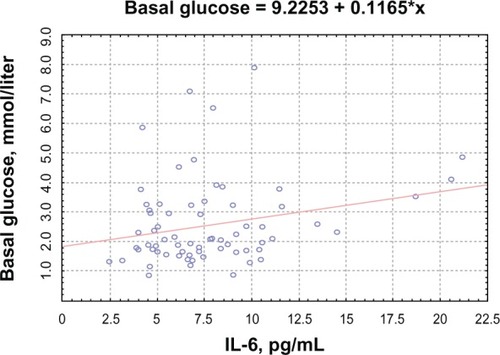
Figure 3 Correlation between C-reactive protein (CRP) levels and postprandial levels of glucose.
In both groups, there were positive correlations between IL-6 and FFA concentrations (R = 0.12, P = 0.01; R = 0.49, P = 0.005), IL-6 and PAI-1 concentrations (R = 0.47, P = 0.04; R = 0.54, P = 0.03) (), IL-6 levels and CK MB activity (R = 0.38, P = 0.01; R = 0.56, P = 0.001) (), and CRP concentrations and IL-6 levels (R = 0.29, P = 0.04; R = 0.38, P = 0.03) ().
Figure 4 Correlation between plasminogen-activator inhibitor (PaI)-1 and interleukin (IL)-6.
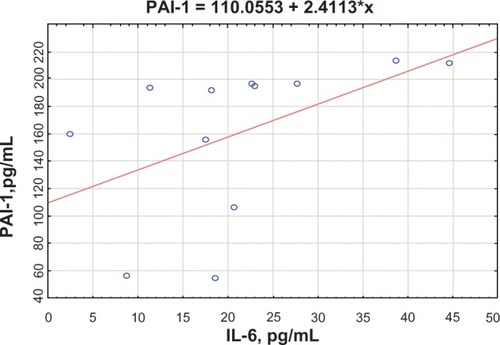
Figure 5 Correlation between interleukin (IL)-6 levels and creatine kinase (CK) MB activity.
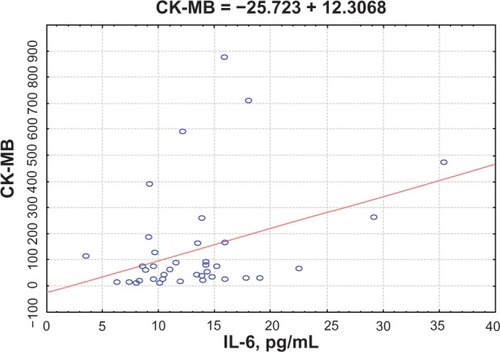
Figure 6 Correlation between C-reactive protein (CRP) levels and interleukin (IL)-6.
Discussion
According to the contemporary understanding, IR has been traditionally regarded as the key stage of T2DM pathogenesis as well as a risk factor for atherosclerosis and MI.Citation15 The well-established IR markers are glucose, insulin, and C-peptide concentrations; however, according to medical literature, postprandial insulin and C-peptide levels are more informative than basal (fasting) ones, particularly when there are no obvious IR signs.Citation16 This study shows that IR develops in MI patients, which is reflected by basal and postprandial hyperglycemia both in the acute and early recovery phases irrespective of T2DM presence. Indeed, the study demonstrated that both diabetic and nondiabetic patients had significantly increased glucose levels, while basal insulin concentrations did not differ significantly; however, there was a significant 1.7-fold increase in postprandial insulin levels compared to those in the control groups, and the medical literature confirms that this parameter is a marker of IR. IR was also confirmed by lower QUICKI values. Diabetic MI patients had severe IR, and those without T2DM had moderate IR.
Among other IR factors in MI, such proinflammatory cytokines and acute-phase proteins as IL-6 and CRP have been extensively studied in the medical literature.Citation3 Recent research has shown that IL-6 has autocrine and paracrine properties along with its proinflammatory and cardiodepressive effects, and might be involved in IR development in MI patients.Citation17 A large prospective trial in 7735 nondiabetic males with no prediabetic conditions, conducted in the UK between 1978 and 2005, showed a strong association between higher IL-6 levels and a risk of T2DM, irrespective of age and obesity.Citation18
Some authors suggest that molecular mechanisms of mediated IL-6 resistance to insulin might include the activation of proinflammatory serine/threonine stress kinases, protein suppressors of cytokine signaling, and protein tyrosine phosphatases acting as physiologic negative regulators of insulin.Citation2
IL-6 was also shown to increase FFA levels in the blood of male volunteers, which could induce resistance to peripheral tissue insulin. IL-6 is supposed to inhibit the activity of lipoprotein lipase in adipocytes, and on the contrary activate cyclic adenosine monophosphate-dependent hormone-sensitive lipase in hepatocytes, which contributes to impaired circulating lipoprotein metabolism and FFA buildup inducing insulin-receptor dysfunction and IR development.Citation15,Citation19
The results of this study demonstrate higher IL-6 and FFA levels in the acute phase of MI and their further decrease in the early recovery period. Additionally, at day 1, the diabetic MI patients had the highest IL-6 and FFA concentrations, which could have been associated with profound metabolic changes due to more pronounced IR in this category of patients. The increased production of inflammation mediators seems to contribute to lipolysis activation accompanied by excess FFA release into the blood flow. The observed positive correlation between IL-6 and FFA levels confirms this suggestion. Reaching the liver, FFA on one hand becomes a substrate for triglyceride and atherogenic lipoprotein production, and on the other hand causes the buildup of other lipid metabolites (ceramides, diacylglycerides), inducing impaired insulin signaling and thereby contributing to IR development to a much greater extent.Citation16
According to reports of other authors, IL-6 is produced by different immune-system and adipose-tissue cells, as well as endothelial and epithelial cells.Citation18 Experimental studies showed that in MI, the main source of this cytokine is cardiomyocytes, activated macrophages, and T-lymphocytes being attracted to the ischemic region of necrosis.Citation20 Obviously, the increase in IL-6 concentrations demonstrates not only higher cytokine production in the cells involved in MI pathogenesis but also reflects the activity of inflammation in the affected myocardium. The results of the correlation analysis, which showed positive correlations between IL-6 and cardiospecific markers of myocardial necrosis, support this hypothesis.
IL-6 has recently been established to be capable of stimulating PAI-1 in vitro generation in different cells; PAI-1 is not only the key component of the fibrinolytic system but also an IR marker.Citation11 PAI-1 has recently been found to block insulin signaling in adipocytes, and at the same time the exposition of high insulin-content adipocytes was accompanied by increased PAI-1 concentrations in these cells. In this study, we found higher PAI-1 concentrations in both patient groups, and T2DM presence determined higher concentrations of this marker in the acute MI phase.
Meanwhile, in the early recovery phase, both patient groups had lower PAI-1 concentrations, which demonstrated fibrinolytic activity normalization due to the treatment. The correlation analysis showed a positive correlation between IL-6 and PAI-1 concentrations in MI patients, which confirmed the IL-6-inducing impact on the production of this protein. Obviously, in MI, excess PAI-1 not only leads to slower fibrinolysis, buildup of fibrin, and its degradation products and thereby to microvascular thromboses but is also involved in IR development, which amplifies prothrombotic status.Citation3
Along with activated cytokine production, cardiomyocyte ischemia and necrosis are accompanied by the production of acute-phase proteins, primarily CRP, which is involved in the responses aimed at localizing the affected region and myocardial remodeling initiation.Citation16 CRP levels are known to increase significantly already 6–8 hours after myocardial tissue injury, reach their peak within 24–48 hours, and then decrease with a circulation half-time of 6 hours.Citation17 This study shows higher CRP concentrations in both patient groups in the acute and early recovery phases. The presence of T2DM determined the highest protein concentrations in MI patients during the entire follow-up period, which might be associated with higher IL-6 concentrations in this patient category. Previous research has established IL-6 to be the most significant inducer of CRP production. At the same time, experimental studies showed that CRP was capable of inducing IR. According to Pravenec et al, transgenic rats expressing human CRP in high concentrations had metabolic disorders (hyperinsulinemia, hyperglycemia, and glycogen-production impairment stimulated by insulin in the skeletal muscles), which are intrinsic to IR syndrome.Citation21 D’Alessandris et al established that CRP induces serine phosphorylation in the insulin-receptor domain, which impairs the ability of the latter to activate phosphatidylinositol 3-kinase and leads to IR development in rat myocytes.Citation22 Meanwhile, we discovered positive correlations between CRP levels and the activity of CK MB fraction. The observed correlative associations between CRP and metabolic IR markers demonstrate that IL-6 is not only the key inflammation mediator but also plays an active role in FFA and glucose metabolism, and fibrinolytic system protein production and secretion, which can be involved in pathogenetic events associated with IR in MI.
Conclusion
The results of this study demonstrate that MI as well as activated inflammation is accompanied by IR development. The most informative indicators of impaired sensitivity to insulin in MI are increases in FFA and PAI-1 levels compared to postprandial glycemia and insulinemia. The observed strong associations between IL-6, CRP, basal and postprandial glycemia, and insulinemia, as well as FFA and PAI-1 levels evidence the involvement of nonspecific inflammation factors in IR development and the amplification of prothrombogenic potential in MI patients.
In turn, the presence of preexisting IR determines higher thrombogenic status and increases the risk of not only primary but also recurrent cardiovascular events. The observed consistent patterns can lead to new treatment strategies to prevent T2DM in MI patients and improve quality of life.
Acknowledgment
The authors wish to thank Anna Bashkireva for her assistance in writing this article.
Disclosure
The authors report no conflicts of interest in this work.
References
- PickupJInflammation and activated innate immunity in the pathogenesis of type 2 diabetesDiabetes Care20042781382314988310
- YuQGaoFMaXLInsulin says NO to cardiovascular diseaseCardiovasc Res20118951652421051417
- FernándezJMRilcartWInsulin resistance and chronic cardiovascular inflammatory syndromeEndocr Rev20032427830112788800
- SmitJWRomijnJAAcute insulin resistance in myocardial ischemia: causes and consequencesSemin Cardiothorac Vasc Anesth20061021521916959753
- AntoinetteMSteffenLJacobsDRelation of C-reactive protein to insulin resistance and cardiovascular risk factors in youthDiabetes Care2005281763176815983332
- BarrettTDHennanJKMarksRMLucchesiBRC-reactive-protein-associated increase in myocardial infarct size after ischemia/reperfusionJ Pharmacol Exp Ther20023031007101312438521
- Fernandez-RealJMVayredaMRichartCCirculating interleukin 6 levels, blood pressure, and insulin sensitivity in apparently healthy men and womenJ Clin Endocrinol Metab2001861154115911238501
- GeigerPCHancockCWrightDCHanDHHolloszyJOIL-6 increases muscle insulin sensitivity only at superphysiological levelsAm J Physiol Endocrinol Metab200729218421846
- FrangogiannisNGSmithCWEntmanMLThe inflammatory response in myocardial infarctionCardiovasc Res200253314711744011
- ColletJPMontalescotGVicautEAcute release of plasminogen activator inhibitor-1 in ST-segment elevation myocardial infarction predicts mortalityCirculation200310839139412860898
- AlessiMCJuhan-VagueIPAI-1 and the metabolic syndromeArterioscler Thromb Vasc Biol2006262200220716931789
- Juhan-VagueIMorangePEFrereCThe plasminogen activator inhibitor-1 -675 4G/5G genotype influences the risk of myocardial infarction associated with elevated plasma proinsulin/insulin levels in men from Europe: the HIFMECH studyJ Thromb Haemost200312322232914629464
- KryzhanovskyVADiagnosis and treatment of myocardial infarctionK.Phoenix2001
- KatzANambiSSMatherKQuantitative insulin sensitivity check index: a simple, accurate method for assessing insulin sensitivity in humansJ Clin Endocrinol Metab2000852402241010902785
- LeclercqIADa Silva MoraisASchroyenBVan HulNGeertsAInsulin resistance in hepatocytes and sinusoidal liver cells: mechanisms and consequencesJ Hepatol20074714215617512085
- CefaluWTInsulin resistance: cellular and clinical conceptsExp Biol Med (Maywood)2001226132611368233
- PapanicolaouDAVgontzasANInterleukin-6: the endocrine cytokineJ Clin Endocrinol Metab2000851331133310720086
- Nieto-VazquezIFernández-VeledoSde AlvaroCLorenzoMDual role of interleukin-6 in regulating insulin sensitivity in murine skeletal muscleDiabetes2008573211322118796617
- OpieLHKnuutiJThe adrenergic-fatty acid load in heat failureJ Am Coll Cardiol2009541637164619850204
- GwechenbergerMMendozaLHYoukerKACardiac myocytes produce interleukin-6 in culture and in viable border zone of reperfused infarctions circulationCirculation1999995465519927402
- PravenecMKajiyaTZídekVEffects of human C-reactive protein on pathogenesis of features of the metabolic syndromeHypertension20115773173721357282
- D’AlessandrisCLauroRPrestaISestiGC-reactive protein induces phosphorylation of insulin receptor substrate-1 on Ser307 and Ser612 in L6 myocytes, thereby impairing the insulin signalling pathway that promotes glucose transportDiabetologia20075084084917279354