
Abstract
Purpose
Acute graft-versus-host disease (aGVHD) poses a significant impediment to achieving a more favourable therapeutic outcome in allogeneic hematopoietic stem cell transplantation (allo-HSCT). The tumour suppressor p53 plays a pivotal role in preventing aGVHD development. However, whether P53 pathway which contains p53 family members and other related genes participates in aGVHD development remains an unsolved question.
Patients and Methods
Transcriptomic data was obtained from Gene Expression Omnibus (GEO) database. Gene set enrichment analysis was applied to determine the enrichment degree of signaling pathways. CIBERSORT and ssGSVA were used to evaluate immune cell compositions. Univariate and multivariate logistic regression analysis were performed to examine the independent diagnostic variables. qRT-PCR was utilized to validate the genes expression levels in our cohort.
Results
A total number of 102 patients (42 aGVHD patients vs 60 non-aGVHD patients) were obtained after integrating two datasets in GEO database (GSE73809 and GSE4624). P53 pathway was remarkably suppressed in T cells from aGVHD patients and negatively associated with activated T cells as well as T cells activation related signaling pathways, including T-cell receptor (TCR), mTORC1, MYC and E2F target pathways. A risk model for aGVHD built by four genes (DDIT3, FBXW7, TPRKB and TOB1) in P53 pathway, exhibiting high differentiate and predictive value. DDIT3 and FBXW7 mRNA expression levels significantly decreased in peripheral blood mononuclear cells (PBMCs) from aGVHD patients compared with non-aGVHD group in our patient cohort, consisting with bioinformatics analysis.
Conclusion
P53 pathway plays a potential role in impeding T cell activation through suppressing its related signaling pathways, thereby preventing aGVHD development. P53 pathway may emerge as a promising therapeutic target in aGVHD treatment.
Introduction
Allogeneic hematopoietic stem cell transplantation (allo-HSCT) can cure hematologic malignancies through graft-versus-leukemia (GVL) effect to eliminate malignant cells. Regrettably, the efficacy of GVL is intertwined with the pathogenesis of graft-versus-host disease (GVHD).Citation1 GVHD arises from donor T cells that, concurrently, orchestrate potent anti-tumor responses. Acute graft-versus-host disease (aGVHD) is one of the major complications after allo-HSCT, mainly occurring in the gastrointestinal (GI) tract, skin, and liver.Citation2 Alloreactive donor CD4+ and CD8+ T cells are indispensable mediators of aGVHD pathogenesis.Citation3,Citation4 Recently, various immunosuppressive agents, such as post-transplant cyclophosphamide (PTCy)Citation5 and anti-thymocyteglobulin (ATG)Citation6,Citation7 have prominently prevented the development of aGVHD. Despite these achievements, exploring diagnostic and therapeutic biomarkers for aGVHD remains urgent needs.
The pivotal tumour suppressor p53 orchestrates tumour suppressionCitation8,Citation9 and inhibition of autoimmune and inflammatory diseases.Citation10 Accumulating evidence suggests that the balance between regulatory T cells (Tregs) and T helper cell 17 (Th17) plays a pivotal role in aGVHD development.Citation11,Citation12 Tregs are the group of negatively regulatory immune cells to prevent aGVHD.Citation13,Citation14 On the contrary, Th17 are the major subtype of inflammatory T cell implicated in the pathogenesis of aGVHD.Citation15,Citation16 p53 promotes the differentiation and maturation of Tregs,Citation10,Citation17 whereas inhibits Th17 differentiation.Citation17,Citation18 Additionally, our previous findings showed that p53 significantly decreased in CD4+ T cells from aGVHD patients compared with the non-aGVHD group. CD4+ T cells with insufficient p53 undergo over-activation and proliferation under IL-2 stimulation, leading to inflammatory damage among aGVHD patients.Citation19 Collectively, the above findings suggested that p53 is a key factor to restraint aGVHD occurrence through suppressing T cells activation and inflammatory response.
T-cell receptor (TCR), myelocytomatosis oncogene (MYC),Citation20 mechanistic target of rapamycin complex 1 (mTORC1)Citation21 and early 2 factors (E2F)Citation22 target signaling pathways have been demonstrated to associate with T cells activation. The above studies prompt an exploration into whether P53 pathway, which contains p53 family members and other related genes, impedes T cell activation by suppressing its related signaling pathways, thereby limiting aGVHD development.
In this study, we demonstrated that P53 pathway was significantly suppressed in T cells from aGVHD patients and might restrict T cell activation by inhibiting TCR, MYC, mTORC1 and E2F target signaling pathways, thereby preventing aGVHD occurrence. An aGVHD risk model constructed by four genes (DDIT3, FBXW7, TPRKB and TOB1) in P53 pathway showed high predictive value, further emphasizing the crucial role of P53 pathway played in aGVHD pathogenesis. In summary, our findings unveiled a pivotal biomarker, P53 pathway, for diagnosis and treatment of aGVHD.
Materials and Methods
Clinical Specimens
A total of 14 patients who underwent allo-HSCT from February 2019 to February 2023 at the Central of Hematopoietic Stem Cell Transplantation of Xiangya Hospital were included in this study if they met the following criteria: 1) they were older than 14 years; 2) received peripheral blood stem cell transplantation (PBSCT); 3) developed or did not develop aGVHD within 100 days after transplantation. presents the clinical characteristics of patients. Mount Sinai Acute GVHD International Consortium (MAGIC) criteria were used to diagnose and score the severity of aGVHD.Citation23,Citation24 Patients were categorised into two groups based on the presence or absence of aGVHD. Peripheral blood samples were collected from patients diagnosed with aGVHD before initiating treatment (n = 7). For the control group (n = 7), according to the onset time of aGVHD patients (calculating from transplantation to aGVHD onset), samples were collected from patients who did not develop aGVHD at the same time point after allo-HSCT. The last aGVHD-reported date was March 25, 2023. The median (range) aGVHD onset time was 46 (18~90) days. Two out of 7 non-aGVHD patients presented later with chronic GVHD. One developed ocular and pulmonary cGVHD, the other developed oral cGVHD.
Table 1 Patient and Graft Characteristics
Quantitative Real-Time PCR (qRT-PCR) Assay
Total RNA was harvested from peripheral blood mononuclear cells (PBMCs) using the Trizol Reagent (Invitrogen, Carlsbad, CA, USA). The SweScript All-in-One first-strand cDNA Synthesis SuperMix for qPCR (G3337-50, Servicebio, Wuhan, Hubei, China) was employed for reverse transcription into complementary DNA (cDNA) following the manufacturer’s instructions. qRT-PCR was performed in triplicate on a QuantStudio 7 Flex (Thermo Fisher Scientific, Marietta, OH, USA) using 2×Universal Blue SYBR Green qPCR Master Mix (G3326-15, Servicebio, Wuhan, Hubei, China), following the manufacturer’s instructions. Relative mRNA levels were normalized to glyceraldehyde-3-phosphate dehydrogenase (GAPDH) mRNA using the 2−ΔΔCT method. The primers sequences are listed in .
Table 2 Real-Time qPCR Primers
Data Collection and Process
Gene expression data were acquired from Gene Expression Omnibus (GEO) database (https://www.ncbi.nlm.nih.gov/gds/). The GSE73809 dataset (GPL17586) contained 11 aGVHD patients and 13 non-aGVHD patients, and the GSE4624 dataset (GPL3639) consist of 31 aGVHD patients and 47 non-aGVHD patients. All included patients received allo-HSCT and peripheral blood T cells were obtained for transcriptome analysis. Considering the insufficient samples from each dataset, we integrated two datasets and removed the batch effect by using R package “sva”Citation25 to make the results as trusted as possible. After integrating, a total number of 102 patients were included in this study with 42 aGVHD patients and 60 non-aGVHD patients.
Identification of the Differentially Expressed Genes and Gene Set Enrichment Analysis
Differentially expressed genes (DEGs) between aGVHD patients and non-GVHD group were identified using the “limma”Citation26 package. P-value <0.05 was the cutoff for DEGs. Gene set enrichment analysis (GSEA)Citation27 was conducted with the “clusterProfiler” packageCitation28 in R software. Pathway signatures were acquired from MSigDB of the Broad Institute (https://www.gsea-msigdb.org/gsea/index.jsp). The threshold for remarkably enriched annotations in GSEA was set at adjusted P-value <0.05. A total of 200 genes in P53 pathway were identified from the GSEA website.
Immune Cell Profiling Analysis
The immune cell compositions of all samples were evaluated through CIBERSORTCitation29 and ssGSVACitation30 packages respectively. Wilcoxon test was performed to compare the proportions of immune cells between aGVHD patients and non-aGVHD group. Additionally, the relationship among immune cells and P53 pathway and genes involved in it were further determined.
Identification of Diagnosis-Related Genes and Development of a Diagnosis Model
Genes in P53 pathway from the integrated dataset were analyzed through univariate and multivariate logistic regression analysis to examine the independent diagnostic variables. Receiver operating characteristic (ROC) curves were applied to assess the predictive value of genes. Nomogram was established via “rms” package based on four genes in P53 pathway for visualization and potential clinical use in diagnosing aGVHD. The performance of nomogram was evaluated by calibration curve and ROC curve. The decision curve was applied to determine the clinical value of the diagnosis model.
Statistical Analysis
SPSS 26.0 software, R software (Version 4.1.1) and R studio (Version 2021.09.0) were utilized to perform statistical analyses. Continuous variables with a normal distribution were presented as mean ± standard deviation (SD), while non-normal variables were reported as median (interquartile range). Independent samples Student’s test compared means of two continuous normally distributed variables. Wilcoxon rank sum test was used to compare means of two groups of variables not normally distributed. Univariate and multivariate logistic regression were used to determine the risk factors of events. Pearson correlation measures the strength of the linear relationship between two variables and is displayed with correlation coefficient (r). Significance was set at P < 0.05.
Results
P53 Pathway is Suppressed in T Cells from aGVHD Patients
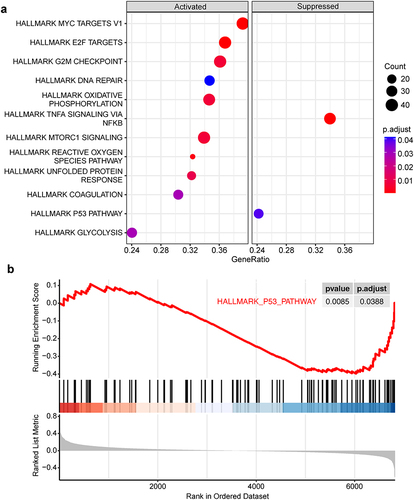
After integrating the transcriptomic data from two datasets (GSE73809 and GSE4624), we obtained an integrated dataset containing a total number of 102 patients (42 aGVHD patients vs 60 non-aGVHD patients), which was used for subsequent bioinformatics analysis. Initially, we applied gene set enrichment analysis (GSEA) to investigate the discrepancy of biological signaling pathway in T cells between aGVHD patients and non-aGVHD group. The Results showed that compared with non-aGVHD group, 12 signaling pathways were significantly changed in T cells from aGVHD patients, including 10 up-regulated pathways and 2 down-regulated pathways. Notably, T cell activation related signaling pathways, mTORC1, E2F, and MYC pathways, were significantly enriched in T cells from aGVHD patients. In addition, cell cycle and proliferation related signaling pathways, G2M checkpoint and DNA repair pathways, and metabolic related signaling pathways, oxidative phosphorylation, reactive oxygen species and glycolysis pathways, were also highly activated in T cells from aGVHD patients. These results indicate the possibility that hypermetabolism in T cells from aGVHD patients provides them with abundant metabolic intermediates and energy, thereby supporting the activation and proliferation of cells. Besides, the remaining two activated pathways were unfolded protein response and coagulation signaling pathways. On the other hand, TNFα signaling via NF-kB and P53 pathway were considerably suppressed in T cells from aGVHD patients, implying the potentially suppressive role of these two pathways in T cells activation and aGVHD occurrence ( and ).
Figure 1 Gene set enrichment analysis between aGVHD patients and non-aGVHD group. (a) All the activated and suppressed signaling pathways in T cells from aGVHD patients compared with non-aGVHD group. Pathway signatures source from hallmark gene sets. Count represents the number of “core genes” which are high-expressed in activated pathways or low-expressed in suppressed pathways, having significant contribution to the pathway status. GeneRatio is the ratio of Count to the total number of genes in the pathways contained in the dataset. (b) P53 pathway remarkably downregulated in T cells from aGVHD patients.
P53 Pathway Negatively Associates with T Cell Activation
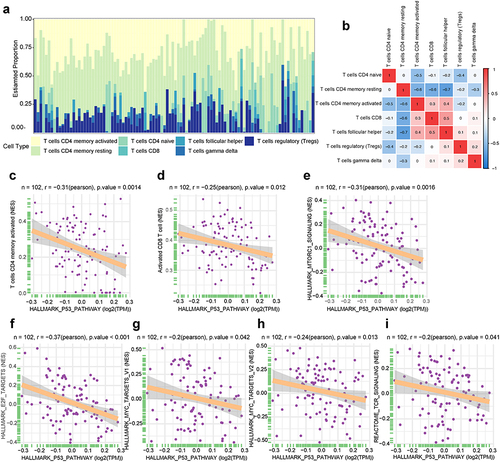
Next, we investigated the proportions of T-cell subsets in both aGVHD patients and non-aGVHD group in the integrated dataset. The percentages of 7 T-cell subsets in the two groups were shown in . Additionally, T-cell subsets proportions had weak to moderate correlations (). Next, we investigated the relationship between P53 pathway and T cell activation. We found that P53 pathway had a considerably negative relationship with activated CD4 memory T cell and activated CD8 T cell by using CIBERSORT algorithm () and ssGSVA algorithm (), respectively. Furthermore, we performed correlation analyses between P53 pathway and T cell activation related signaling pathways. The results showed that P53 pathway had significantly negative correlations with TCR, mTORC1, MYC and E2F signaling pathways (). These results suggested that P53 pathway had intrinsically negative associations with T cell activation. The suppression of P53 pathway might lead to T cells over-activation.
Figure 2 T-cell subsets and hallmark signaling pathways associated with P53 pathway. (a) The proportion of 7 T-cell subsets in each sample using CIBERSORT. Color indicates the T cell types. The horizontal axis indicates patient samples. (b) Correlation of T-cell subsets percentages. Color indicates the correlation direction. Each cell contains Pearson correlation coefficient. (c and d) The relationship between P53 pathway and T cell subgroups. (c) CIBERSORT algorithm, (d) ssGSVA algorithm. N represents the total number of patients in integrated dataset. The horizontal axis indicates P53 pathway. The longitudinal axis represents T cell subsets. (e–i) The correlation between P53 pathway and hallmark signaling pathways as well as TCR signaling. N represents the total number of patients in integrated dataset. The horizontal axis indicates P53 pathway. The longitudinal axis represents signaling pathways.
Genes in P53 Pathway Negatively Associate with T Cell Activation
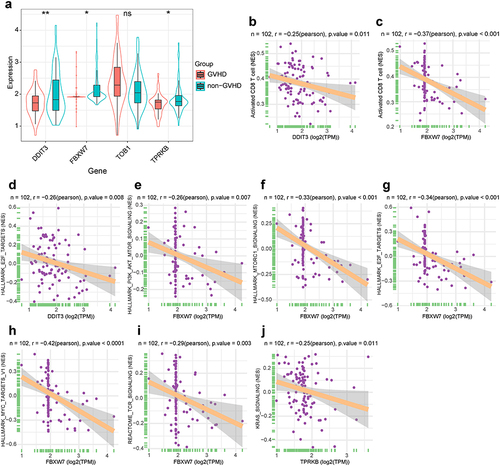
To further identify whether the genes in P53 pathway participates in aGVHD development, we performed univariate logistic regression analysis to assess the predictive value of all genes in P53 pathway (Table S1). Four genes with lower P-value (P< 0.1) were chosen for further analysis. Compared with non-aGVHD group, DDIT3, FBXW7 and TPRKB expression remarkably decreased in T cells from aGVHD patients, while TOB1 expression increased without statistical difference (). The results of correlation analysis between four genes and immune cell signatures revealed that merely DDIT3 and FBXW7 expression had strong negative relationship with active CD8 T cell ( and ). Furthermore, we investigated whether the four genes had a close relationship with T cell activation related signaling pathways. The results indicated that DDIT3 and TPRKB expression had negative connection with E2F and Kirsten rat sarcoma viral oncogene homologue (KRAS) signaling pathway, respectively. FBXW7 expression had significant negative association with phosphoinositide 3-kinase (PI3K)/protein kinase B (AKT)-mammalian target of rapamycin (mTOR), mTORC1, E2F, MYC and TCR signaling pathways (). These results indicated that two out of four genes in P53 pathway, DDIT3 and FBXW7, negatively associated with T cell activation.
Figure 3 T-cell subsets and hallmark signaling pathways associated with genes in P53 pathway. (a) Box and violin plot for expression levels of four genes in P53 pathway. Data follows non-normal distribution. Wilcoxon test was used to identify significant differences. *P< 0.05, **P< 0.01; ns, not significant. (b and c) The correlation between genes in P53 pathway and T cell subsets (ssGSVA algorithm). N represents the total number of patients in integrated dataset. The horizontal axis indicates genes in P53 pathway. The longitudinal axis represents T cell subsets. (d–j) The correlation between genes in P53 pathway and hallmark signaling pathways as well as TCR signaling. N represents the total number of patients in integrated dataset. The horizontal axis indicates genes in P53 pathway. The longitudinal axis represents signaling pathways.
Diagnostic Value of Four Genes in P53 Pathway
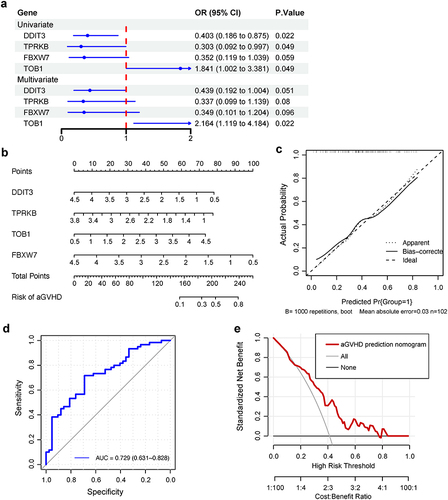
We next investigated whether the above four genes in P53 pathway were independent biomarkers for predicting aGVHD development. Univariate logistic regression analysis indicated that DDIT3, FBXW7 and TPRKB exhibited lower risk (OR<1), while TOB1 showed higher risk (OR>1) to develop aGVHD. Multivariate logistic regression analysis illustrated that TOB1 was an independent diagnostic marker for aGVHD (). Further, we established a prognostic nomogram based on four genes in P53 pathway for aGVHD diagnosis (). The calibration curve suggested that nomogram exhibited favourable concordance between actual and predicting possibility (). The area under curve (AUC) of receiver operating characteristic (ROC) curve was 0.729 (95% CI: 0.631 to 0.828) (). Decision curve analysis (DCA) results indicated nomogram had a good clinical value ().
Figure 4 Construction of an individualized predictive model for aGVHD. (a) Univariate and multivariate logistic regression analyses of relationship between four genes in P53 pathway and aGVHD development. OR, odds ratio, calculates the relationship between each gene in P53 pathway and the likelihood of aGVHD occurrence. OR smaller than one implies aGVHD has fewer odds of happening with high expression of genes in P53 pathway. The blue dots represent OR values, which may not be seen if it exceeds the range of ruler below. The blue lines represent 95% CI of OR. (b) Nomogram depicting the prediction of aGVHD occurrence. The aGVHD nomogram consists of four P53 pathway genes, namely, DDIT3, TPRKB, TOB1 and FBXW7. The expression value of each gene can match a point on the top. For an individual patient, the total points of four genes correspond to the risk of aGVHD. (c) Calibration curve of nomogram for aGVHD prediction. The concordance between lines Apparent and Ideal implies the congruence between actual and ideal nomogram. (d) The ROC curves and (e) DCA of the diagnostic efficacy verification. During DCA, it represents a good clinical value when the interested curve (marked in red) lies in the upper right quadrant formed by the other two curve.
Validation of Four Diagnostic Genes Expression in Our Patient Cohort
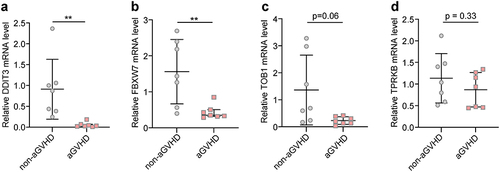
Furthermore, we applied qRT-PCR to explore DDIT3, FBXW7, TOB1 and TPRKB mRNA expression levels in peripheral blood mononuclear cells (PBMCs) from aGVHD patients and non-aGVHD group in our cohort. The results suggested that DDIT3 and FBXW7 expression significantly decreased in PBMCs from aGVHD patients compared with non-aGVHD group ( and ), whereas TOB1 and TPRKB expression was comparable between the two groups of patients ( and ). The changes of DDIT3 and FBXW7 mRNA expression levels were consistent with bioinformatics analysis.
Figure 5 Validation of mRNA expression levels of four genes in P53 pathway. Measurement of DDIT3 (a), FBXW7 (b), TOB1 (c) and TPRKB (d) mRNA expression levels in PBMCs from our patient cohort. Data in DDIT3 and FBXW7 groups follows non-normal distribution (Wilcoxon test). Data in TOB1 and TPRKB groups follows normal distribution (Unpaired Student’s t-test). **P < 0.01.
Discussion
The p53 family comprises p53 itself, p73, and p63.Citation31 Both of p73 and p63 bear structural and functional resemblance to p53 and are involved in pleiotropic effects.Citation32 Our present study showed that P53 pathway, which contains p53 family members and other related genes, was remarkably suppressed in T cells from aGVHD patients. The lower expressions of P53 pathway significantly correlated with higher proportion of activated T cells, suggesting that not only p53, but also P53 pathway was a vital protective factor during aGVHD development. Paradoxically, others have shown that deficient for p73 exhibits profound defect in inflammationCitation33 and p73 is involved in tumor necrosis factor (TNF) α-related epithelial stem cell apoptosis in GVHD.Citation32 It is likely that p73 induces innate inflammation instead of T cells-mediated adaptive inflammation and exerts distinct function in T cells and other types of cells during aGVHD. Future studies will be important in exploring these regulation mechanisms.
Recent studies have demonstrated a set of signaling pathways and transcription factors (TFs) participated in T cells activation. MYC could upregulate glycolytic and glutamine metabolism genes expression in the first hours of T cell activation.Citation20 Inhibition of mTOR could impair T cells activation and facilitate T cell anergy.Citation21 E2F TF family are regulated by mTOR signaling.Citation22 PI3K/ AKT-mTOR signaling pathway is important for T cell metabolism and can be regarded as a vital target for T cell immunosuppression.Citation34 Consistently, our results revealed that MYC, E2F, mTORC1 signaling pathways were remarkably activated in T cell from aGVHD patients compared with non-aGVHD group. Moreover, P53 pathway had significantly negative connections with MYC, mTORC1, E2F and TCR signaling pathways. These results support our assertion that P53 pathway might directly impede T cell activation through inhibiting its related signaling pathways, thereby suppressing aGVHD development.
A risk model built by four genes (DDIT3, FBXW7, TOB1 and TPRKB) in P53 pathway showed high predictive value for aGVHD, further iterating the crucial role of P53 pathway in aGVHD development. Recent findings suggested that deletion of DNA damage inducible transcript 3 (DDIT3) in T cells enhanced anti-tumor CD8+ T cell immunity.Citation35 Suppression of F-box and WD repeat domain containing 7 (FBXW7) stimulates T cell polyfunctional cytokine expression and promotes their survival.Citation36 In line with these studies, our results showed that DDIT3 and FBXW7 expression significantly decreased in T cells from aGVHD patients and negatively correlated with activated CD8 T cells and multiple T cell activation pathways. Patients with lower expressions of these two genes had higher potential to develop aGVHD. Collectively, these findings indicate an essential protective function of DDIT3 and FBXW7 in aGVHD development by suppressing CD8 T cells activation.
To the best of our knowledge, studies focused on the role of TP53RK Binding Protein (TPRKB) in T cell activation have not been found. In this study, we revealed that TPRKB expression significantly reduced in T cells from aGVHD patients and negatively associated with KRAS signaling pathway, which communicates with T cell activation related PI3K/AKT/mTOR signaling pathway.Citation37 Additionally, patients with lower TPRKB expression tend to develop aGVHD. These results imply the potential role of TPRKB in suppressing aGVHD occurrence and T cell activity. Transducer of ERBB2, 1 (TOB1) highly expressed in anergic or quiescent CD4+ lymphocytes and its inhibition augmented CD3-mediated responses.Citation38 However, our findings suggest that there is no significant difference of TOB1 expression in T cells between aGVHD patients and non-aGVHD group. Moreover, TOB1 bears no relationship to T cell activation. Intriguingly, patients with higher TOB1 expression tend to develop aGVHD. It is likely that TOB1 plays a specific role in aGVHD development, which is not to inhibit T cells activation and inflammatory response. Therefore, TOB1 might just be regarded as an excellent biomarker for aGVHD diagnosis, while its function during aGVHD still needs to be defined in future study.
The present study showed TP53 expression was comparable between aGVHD patients and non-aGVHD group, probably due to the transcriptomic data in this study sourcing from T cells, while our previous findings basing on CD4+ T cells. Notably, qRT-PCR results in PBMCs from our patient cohort revealed that the changes of mRNA expression levels of DDIT3 and FBXW7, two out of four genes in P53 pathway, were consistent with bioinformatics analysis. However, the insufficient sample size and the sample sourcing from PBMCs, comprising not only T cells but also other various immune cells, are the limitations of this experiment and may contribute to the discrepancy between qRT-PCR results and bioinformatics analysis. Nevertheless, in isolated PBMCs, T cells amount to 45~70% of total cells and are therefore the most abundant cell type.Citation39 Hence, qRT-PCR results partly confirm the authenticity and availability of bioinformatics analysis.
This study also had several limitations. First, prejudice may exist owing to the different platform source of the two datasets we selected. Second, both the database lacked vital clinical information such as patient background, aGVHD severity and treatment outcome. Third, the specific roles played by genes in P53 pathway in T cells activation need to explore in further experimental study.
Conclusion
Taken together, in this study, we identify P53 pathway is suppressed in T cells from aGVHD patients and highlight its closely negative relationships with T cell activation. These findings advance our comprehension of the crucial role played by P53 pathway in aGVHD development, presenting as footstones for future study.
Ethical Statements
This research adhered to international ethical guidelines for biomedical research involving human subjects. Approval for the study protocol was obtained from the Human Ethics Committee of Xiangya School of Medicine, Central South University. All participants provided signed informed consent in accordance with the Declaration of Helsinki.
Disclosure
The authors have no relevant financial or non-financial interests to disclose for this work.
Data Sharing Statement
Publicly available datasets (GSE73809 and GSE4624) were analyzed in this study. These data can be found here: [GEO, https://www.ncbi.nlm.nih.gov/geo/].
Additional information
Funding
References
- Malard F, Holler E, Sandmaier BM, Huang H, Mohty M. Acute graft-versus-host disease. Nat Rev Dis Primers. 2023;9(1):27. doi:10.1038/s41572-023-00438-1
- Srinagesh HK, Levine JE, Ferrara JLM. Biomarkers in acute graft-versus-host disease: new insights. Ther Adv Hematol. 2019;10:2040620719891358. doi:10.1177/2040620719891358
- Toubai T, Tawara I, Sun Y, et al. Induction of acute GVHD by sex-mismatched H-Y antigens in the absence of functional radiosensitive host hematopoietic-derived antigen-presenting cells. Blood. 2012;119(16):3844–3853. doi:10.1182/blood-2011-10-384057
- Coghill JM, Sarantopoulos S, Moran TP, Murphy WJ, Blazar BR, Serody JS. Effector CD4+ T cells, the cytokines they generate, and GVHD: something old and something new. Blood. 2011;117(12):3268–3276. doi:10.1182/blood-2010-12-290403
- Bashey A, Zhang X, Sizemore CA, et al. T-cell-replete HLA-haploidentical hematopoietic transplantation for hematologic malignancies using post-transplantation cyclophosphamide results in outcomes equivalent to those of contemporaneous HLA-matched related and unrelated donor transplantation. J Clin Oncol. 2013;31(10):1310–1316. doi:10.1200/JCO.2012.44.3523
- Soiffer RJ, Kim HT, McGuirk J, et al. Prospective, randomized, double-blind, phase iii clinical trial of anti-T-lymphocyte globulin to assess impact on chronic graft-versus-host disease-free survival in patients undergoing HLA-matched unrelated myeloablative hematopoietic cell transplantation. J Clin Oncol. 2017;35(36):4003–4011. doi:10.1200/JCO.2017.75.8177
- Walker I, Panzarella T, Couban S, et al. Pretreatment with anti-thymocyte globulin versus no anti-thymocyte globulin in patients with haematological malignancies undergoing haemopoietic cell transplantation from unrelated donors: a randomised, controlled, open-label, Phase 3, multicentre trial. Lancet Oncol. 2016;17(2):164–173. doi:10.1016/S1470-2045(15)00462-3
- Green DR, Kroemer G. Cytoplasmic functions of the tumour suppressor p53. Nature. 2009;458(7242):1127–1130. doi:10.1038/nature07986
- Vousden KH, Prives C. Blinded by the Light: the Growing Complexity of p53. Cell. 2009;137(3):413–431. doi:10.1016/j.cell.2009.04.037
- Kawashima H, Takatori H, Suzuki K, et al. Tumor suppressor p53 inhibits systemic autoimmune diseases by inducing regulatory T cells. J Immunol. 2013;191(7):3614–3623. doi:10.4049/jimmunol.1300509
- Hoffmann P, Ermann J, Edinger M, Fathman CG, Strober S. Donor-type CD4(+)CD25(+) regulatory T cells suppress lethal acute graft-versus-host disease after allogeneic bone marrow transplantation. J Exp Med. 2002;196(3):389–399. doi:10.1084/jem.20020399
- Liu Y, Cai Y, Dai L, et al. The expression of Th17-associated cytokines in human acute graft-versus-host disease. Biol Blood Marrow Transplant. 2013;19(10):1421–1429. doi:10.1016/j.bbmt.2013.06.013
- Edinger M, Hoffmann P, Ermann J, et al. CD4+CD25+ regulatory T cells preserve graft-versus-tumor activity while inhibiting graft-versus-host disease after bone marrow transplantation. Nat Med. 2003;9(9):1144–1150. doi:10.1038/nm915
- Pierini A, Strober W, Moffett C, et al. TNF-α priming enhances CD4+FoxP3+ regulatory T-cell suppressive function in murine GVHD prevention and treatment. Blood. 2016;128(6):866–871. doi:10.1182/blood-2016-04-711275
- Jiang H, Fu D, Bidgoli A, Paczesny S. T cell subsets in graft versus host disease and graft versus tumor. Front Immunol. 2021;12:761448. doi:10.3389/fimmu.2021.761448
- Carlson MJ, West ML, Coghill JM, Panoskaltsis-Mortari A, Blazar BR, Serody JS. In vitro-differentiated TH17 cells mediate lethal acute graft-versus-host disease with severe cutaneous and pulmonary pathologic manifestations. Blood. 2009;113(6):1365–1374. doi:10.1182/blood-2008-06-162420
- Park JS, Lim MA, Cho ML, et al. p53 controls autoimmune arthritis via STAT-mediated regulation of the Th17 cell/Treg cell balance in mice. Arthritis Rheum. 2013;65(4):949–959. doi:10.1002/art.37841
- Zhang S, Zheng M, Kibe R, et al. Trp53 negatively regulates autoimmunity via the STAT3-Th17 axis. FASEB j. 2011;25(7):2387–2398. doi:10.1096/fj.10-175299
- Hua J, Chen Y, Fu B, et al. Downregulation of p53 by Insufficient CTCF in CD4 T cells is an important factor inducing acute graft-versus-host disease. Front Immunol. 2020;11:568637. doi:10.3389/fimmu.2020.568637
- Wang R, Dillon CP, Shi LZ, et al. The transcription factor Myc controls metabolic reprogramming upon T lymphocyte activation. Immunity. 2011;35(6):871–882. doi:10.1016/j.immuni.2011.09.021
- Yang K, Chi H. mTOR and metabolic pathways in T cell quiescence and functional activation. Semin Immunol. 2012;24(6):421–428. doi:10.1016/j.smim.2012.12.004
- Michaloglou C, Crafter C, Siersbaek R, et al. Combined Inhibition of mTOR and CDK4/6 is required for optimal blockade of E2F function and long-term growth inhibition in estrogen receptor-positive breast cancer. Mol Cancer Ther. 2018;17(5):908–920. doi:10.1158/1535-7163.MCT-17-0537
- Harris AC, Young R, Devine S, et al. International, multicenter standardization of acute graft-versus-host disease clinical data collection: a report from the mount sinai acute GVHD international consortium. Biol Blood Marrow Transplant. 2016;22(1):4–10. doi:10.1016/j.bbmt.2015.09.001
- Schoemans HM, Lee SJ, Ferrara JL, et al. EBMT-NIH-CIBMTR Task Force position statement on standardized terminology & guidance for graft-versus-host disease assessment. Bone Marrow Transplant. 2018;53(11):1401–1415. doi:10.1038/s41409-018-0204-7
- Leek JT, Johnson WE, Parker HS, Jaffe AE, Storey JD. The sva package for removing batch effects and other unwanted variation in high-throughput experiments. Bioinformatics. 2012;28(6):882–883. doi:10.1093/bioinformatics/bts034
- Ritchie ME, Phipson B, Wu D, et al. limma powers differential expression analyses for RNA-sequencing and microarray studies. Nucleic Acids Res. 2015;43(7):e47. doi:10.1093/nar/gkv007
- Subramanian A, Tamayo P, Mootha VK, et al. Gene set enrichment analysis: a knowledge-based approach for interpreting genome-wide expression profiles. Proc Natl Acad Sci U S A. 2005;102(43):15545–15550. doi:10.1073/pnas.0506580102
- Yu G, Wang LG, Han Y, He QY. clusterProfiler: an R package for comparing biological themes among gene clusters. Omics. 2012;16(5):284–287. doi:10.1089/omi.2011.0118
- Newman AM, Liu CL, Green MR, et al. Robust enumeration of cell subsets from tissue expression profiles. Nat Methods. 2015;12(5):453–457. doi:10.1038/nmeth.3337
- Hänzelmann S, Castelo R, Guinney J. GSVA: gene set variation analysis for microarray and RNA-seq data. BMC Bioinf. 2013;14:7. doi:10.1186/1471-2105-14-7
- Vlašić I, Horvat A, Tadijan A, Slade N. p53 Family in Resistance to Targeted Therapy of Melanoma. Int J Mol Sci. 2022;24(1):65. doi:10.3390/ijms24010065
- Zhan Q, Korngold R, Lezcano C, McKeon F, Murphy GF. Graft-versus-host disease-related cytokine-driven apoptosis depends on p73 in cytokeratin 15-positive target cells. Biol Blood Marrow Transplant. 2012;18(6):841–851. doi:10.1016/j.bbmt.2012.02.004
- Yang A, Walker N, Bronson R, et al. p73-deficient mice have neurological, pheromonal and inflammatory defects but lack spontaneous tumours. Nature. 2000;404(6773):99–103. doi:10.1038/35003607
- Powell JD, Lerner CG, Schwartz RH. Inhibition of cell cycle progression by rapamycin induces T cell clonal anergy even in the presence of costimulation. J Immunol. 1999;162(5):2775–2784. doi:10.4049/jimmunol.162.5.2775
- Cao Y, Trillo-Tinoco J, Sierra RA, et al. ER stress-induced mediator C/EBP homologous protein thwarts effector T cell activity in tumors through T-bet repression. Nat Commun. 2019;10(1):1280. doi:10.1038/s41467-019-09263-1
- Zhao E, Maj T, Kryczek I, et al. Cancer mediates effector T cell dysfunction by targeting microRNAs and EZH2 via glycolysis restriction. Nat Immunol. 2016;17(1):95–103. doi:10.1038/ni.3313
- Huang L, Guo Z, Wang F, Fu L. KRAS mutation: from undruggable to druggable in cancer. Signal Transduct Target Ther. 2021;6(1):386. doi:10.1038/s41392-021-00780-4
- Tzachanis D, Freeman GJ, Hirano N, et al. Tob is a negative regulator of activation that is expressed in anergic and quiescent T cells. Nat Immunol. 2001;2(12):1174–1182. doi:10.1038/ni730
- Lozano-Ojalvo D, López-Fandiño R, López-Expósito I, et al. PBMC-Derived T Cells. In: Verhoeckx K, Cotter P, López-Expósito I, editors. The Impact of Food Bioactives on Health: In Vitro and ex vivo Models. Springer Nature; 2015:169–180.