
Abstract
Background
Progress in research on expression profiles in osteoarthritis (OA) has been limited to individual tissues within the joint, such as the synovium, cartilage, or meniscus. This study aimed to comprehensively analyze the common gene expression characteristics of various structures in OA and construct a diagnostic model.
Methods
Three datasets were selected: synovium, meniscus, and knee joint cartilage. Modular clustering and differential analysis of genes were used for further functional analyses and the construction of protein networks. Signature genes with the highest diagnostic potential were identified and verified using external gene datasets. The expression of these genes was validated in clinical samples by Real-time (RT)-qPCR and immunohistochemistry (IHC) staining. This study investigated the status of immune cells in OA by examining their infiltration.
Results
The merged OA dataset included 438 DEGs clustered into seven modules using WGCNA. The intersection of these DEGs with WGCNA modules identified 190 genes. Using Least Absolute Shrinkage and Selection Operator (LASSO) and Random Forest algorithms, nine signature genes were identified (CDADC1, PPFIBP1, ENO2, NOM1, SLC25A14, METTL2A, LINC01089, L3HYPDH, NPHP3), each demonstrating substantial diagnostic potential (areas under the curve from 0.701 to 0.925). Furthermore, dysregulation of various immune cells has also been observed.
Conclusion
CDADC1, PPFIBP1, ENO2, NOM1, SLC25A14, METTL2A, LINC01089, L3HYPDH, NPHP3 demonstrated significant diagnostic efficacy in OA and are involved in immune cell infiltration.
Introduction
Osteoarthritis (OA) is a degenerative joint disease that is characterized by inflammation and pain.Citation1 OA not only considerably diminishes life satisfaction for patients, but also increases the substantial financial burden on healthcare systems.Citation2 Among the joints most frequently affected by OA, the knee joint encompasses various structural components including the meniscus, synovium, and articular cartilage.Citation3
Meniscal damage marks an early pivotal event in knee OA development, exacerbating the load on the articular cartilage and potentially initiating inflammatory responses that hasten cartilage deterioration.Citation4 Inflammation and hypertrophy of the synovium play vital roles in OA, and synovitis is recognized as a major contributor to OA-associated pain and its progression.Citation5 Gradual wear and degradation of articular cartilage are essential pathological manifestations of OA, diminishing the cushioning ability of the joint, which results in pain and restricted mobility.Citation6 The treatment of OA includes non-surgical approaches (health management, medication) and surgical interventions. With the advancement in the research of OA’s molecular mechanisms and the maturation of pluripotent stem cell research, new minimally invasive treatment methods have gradually increased. Although the long-term benefits are still inconclusive, intra-articular therapies such as hyaluronic acid (HA), platelet-rich plasma (PRP), and mesenchymal stem cells have become effective methods for early to mid-stage OA. Moreover, with the development of big data machine learning analysis models based on disease genomics and molecular phenotypes, novel diagnostic methods, distinct from traditional demographic and clinical imaging approaches, have demonstrated promising predictive capabilities and are being utilized in clinical practice.Citation7,Citation8
Recent research has increasingly illuminated the critical role of the immune system in OA development, particularly the significant impact of inflammatory responses in promoting damage to joint cartilage and accelerating disease progression.Citation9 However, research on noninvasive biomarkers for OA diagnosis is challenging.Citation10
In this study, we collectively analyzed the meniscus, synovium, and articular cartilage for the first time using various bioinformatics approaches to identify the distinctive genes associated with knee osteoarthritis. These genes have shown exceptional diagnostic efficacy as confirmed using external datasets and clinical tissue samples. We also explored the signaling pathways in which these genes are involved and their role in immune cell infiltration, aiming to deepen our understanding of the interplay between meniscal damage, synovial inflammation, and cartilage degeneration, while providing references for clinical diagnosis and treatment.
Methods and Materials
Clinical Samples
We collected six osteoarthritis (OA) tissue samples from patients who underwent total knee arthroplasty at the 1st Affiliated Hospital of Harbin Medical University and six normal tissue samples from patients who underwent reconstructive surgery due to trauma.
Microarray Data
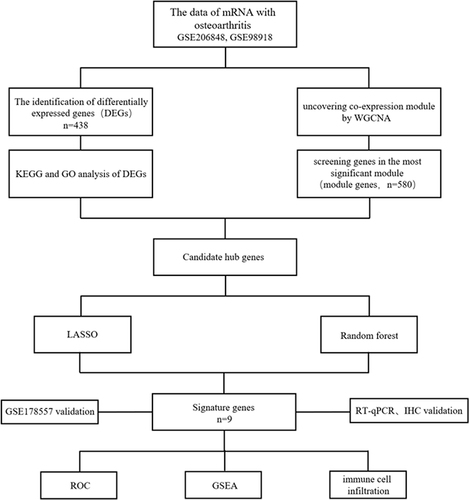
illustrates the study. In this study, we downloaded three datasets, GSE206848, GSE98918, and GSE178557(http://www.ncbi.nlm.nih.gov/geo/).Citation11–13 GSE206848 and GSE98918 (Including 19 healthy control groups and 19 disease groups) were designated as the training sets, whereas GSE178557 (Including 4 healthy control groups and 4 disease groups) was used as the validation dataset. The detailed characteristics of these datasets, including microarray platforms, composition of sample groups, and sample sizes ().
Table 1 Basic Information of Datasets
Figure 1 Designing of this research.
Screening of DEGs
Initially, the training datasets were merged using R software’s insilomerging package.Citation14 Subsequently, the method proposed by Johnson et al was used to eliminate batch effects.Citation15 The limma package of R software (version 4.1.2) was used for differential analysis.Citation16
Co-Expression Network Analysis
GSE206848 and GSE98918 datasets were processed using WGCNA.Citation17 Briefly, the genes that exhibited the lowest 50% of the median absolute deviation values were discarded. The goodSamplesGenes method was used to exclude outlier genes and samples, thereby facilitating the construction of a scale-free network. The modules were subsequently delineated using dynamic tree cutting. WGCNA analysis was used to identify significant modules in OA.
Exploration of Functions
Gene profiling and visualization were conducted using the clusterProfiler package.Citation18 Gene Ontology (GO) was used to explore the biological pathways involved in the DEGs.Citation19 Kyoto Encyclopedia of Genes and Genomes (KEGG) analysis was used to analyze potential biological functions.Citation20 Pathway association analysis of the characteristic genes was conducted using GSEA software. Significance was assessed based on the criterion of an adjusted p < 0.05.Citation21
Protein Network
To further investigate the interactions between DEGs from OA patients, a protein network was analyzed using STRING (https://string-db.org/). Subsequently, the network was visualized using the CentiScape plugin in Cytoscape3.10.0.
Screening OA Diagnostic Genes
The LASSO and Random Forest algorithms were used to analyze the characteristic genes associated with osteoarthritis (OA). Data integration was performed using R software’s glmnet package.Citation22 Subsequently, the randomForest package of R software was used to screen hub genes.Citation23 The overlapping genes identified by both the machine learning models were used as characteristic genes for further analysis.
Immune Infiltration Analysis
The CIBERSORT algorithm was utilized to analyze correlations among immune cells, with the goal of investigating differences in immune infiltration in osteoarthritis (OA) patients and healthy patients. Additionally, the correlation between characteristic genes and immunity was assessed using Spearman’s method.Citation24
RT-qPCR
Total RNA was extracted by the centrifuge column method (DP451; Invitrogen). An automatic medical PCR analysis system (SLAN-96S, China) and SYBR Green qPCR Mix (G3326-01; Servicebio) were used for RT-qPCR analysis. The mRNA expression levels were statistically analyzed using the housekeeping genes GAPDH. All experiments were repeated three times and significant differences were statistically analyzed using the normalized 2 −ΔΔ ct. Primers were designed as follows.
SLC25A14: 5′-GCCCTGCCAGCCTTTCTACTC-3′, 5′-AACCACCCCACTGTTCTTCCATC-3′; NOM1: 5′-GGAGGCAGTGGTGAGGAAGTTC-3′; 5′-ATAAATGGGCAATGACGGTGAAC-3′; METTL2A1: 5′-ACGACCTGTGTGATGAAGAGAAGAG-3′, 5′-AGAAGCCTGCTCAGCCTGTTG-3′; NPHP3: 5′-CCTCTGCCTTGTCAATGTTAGTCAC-3′, 5′-AAGCAAGCCACATCCATAAGTCAAC-3′; ENO2: 5′-CGCACTTTCCACTTCTTCCTTTCTC-3′, 5′-TCTCTAACACCTCAGCACACCAAC-3′; PPFIBP1: 5′-TTGACCGTAGCACCTGGATGAAC-3′, 5′-CAATAGACAATCCGCTGCCTGTTG-3′; GAPDH: 5′-TGACATCAAGAAGGTGGTGAAGCAG-3′, 5′-GTGTCGCTGTTGAAGTCAGAGGAG-3′.
Immunohistochemistry Staining
The expression levels of PPFIBP1, ENO2, NPHP3, and METTL2A (13961-1-AP, 10149-1-AP, 22026-1-AP, 16983-1-AP; Proteintech) in both OA and normal tissues were confirmed using immunohistochemical staining. Briefly, tissues were initially fixed for 24 h, followed by stepwise dehydration using alcohol gradients, paraffin embedding, and sectioning at a thickness of 4 mm. Antigen retrieval was conducted and endogenous peroxidases were removed using 3% H2O2. Sections were subsequently blocked with goat serum (AR1009; Boster). Primary and secondary antibodies were then incubated sequentially. DAB (ZLI-9018, Origene) was used for chromogenic detection, and hematoxylin (G1004, Servicebio) was used for nuclear staining.
Statistical Analysis
All experiments were performed at least three times, with data presented as mean ± SD. Data were analyzed using GraphPad Prism software version 9.4.0. Comparisons between two groups were conducted using Student’s t-test, while multiple group comparisons were performed using ANOVA. *p < 0.05 was considered statistically significant.
Results
Identifying DEGs Between OA and Control
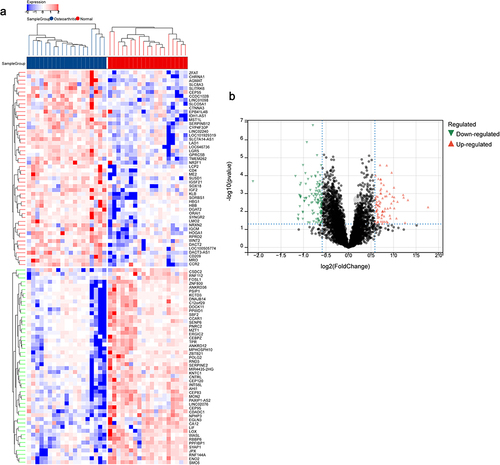
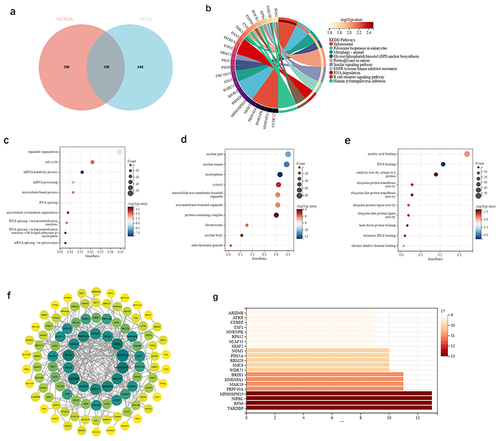
Following the removal of batch effects, the GSE206848 and GSE98918 datasets were merged (Supplementary Figure S1). Through differential analysis, we obtained all differentially expressed genes (Supplementary Table S1), including 123 upregulated and 315 downregulated genes ( and ).
Figure 2 Differential analysis of genes in OA.
Functional Enrichment Analysis
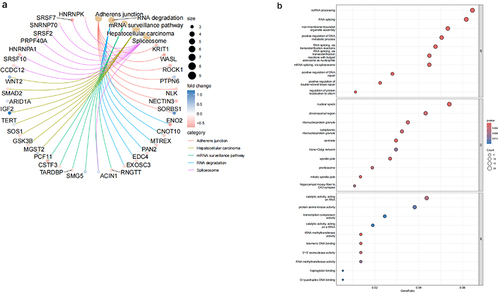
KEGG analysis revealed that the primary enriched pathways were “Adherens junction”, “Spliceosome and RNA degradation” (). GO analysis indicated that the main enriched terms in BP were “RNA splicing” and “positive regulation of DNA metabolic processes”. For CC, the primary enrichments were observed in “nuclear speckle”, “chromosomal region” and “ribonucleoprotein granule”. MF) analysis showed that “catalytic activity, acting on RNA” and “protein serine kinase activity” were the most significant features ().
Figure 3 Enrichment analysis of DEGs in OA.
Gene Modularity Analysis
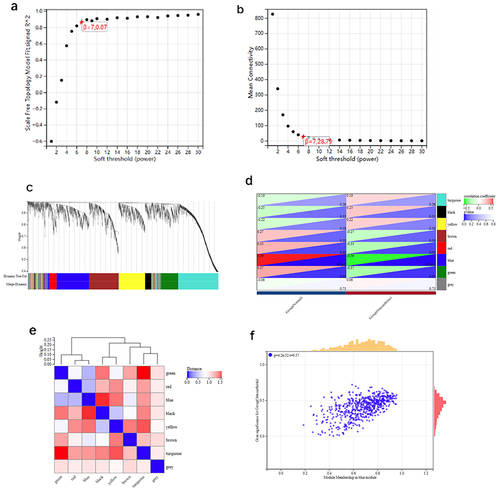
We utilized the R software’s WGCNA package for module classification, setting the soft-thresholding power at 7 for relatively better average connectivity ( and ). Subsequently, eight clustered modules were generated and are represented in distinct colors ( and ). The blue module, consisting of 580 genes, was significantly correlated with OA (correlation coefficient = 0.59, p = 4.2e-52) ( and ).
Figure 4 Module genes using WGCNA in OA.
Analysis of Intersection Between WCGNA and OA DEGs and PPI Network Construction
A total of 190 genes were screened for DEGs and key modules. (). KEGG analysis revealed that the primary enriched pathways were “Spliceosome”, “Ribosome biogenesis in eukaryotes” (). GO analysis indicated that the main enriched terms in BP were “organelle organization” and “the cell cycle”. For CC, the primary enrichments were observed in “nuclear part” and “nuclear lumen”. MF analysis showed that “nucleic acid binding” was more prominent (). Subsequently, we constructed a protein network using the intersecting genes, and visualized the most active modules using the MCODE plugin ( and ).
Figure 5 Analysis of the genes of DEGs and key modules.
Identification of OA Signature Genes
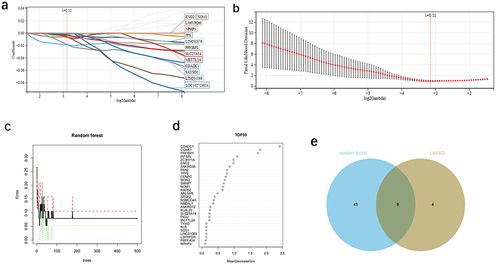
The diagnostic model was constructed using two machine-learning algorithms. The LASSO regression algorithm identified 13 potential biomarkers ( and ), whereas the random forest analysis identified 50 relatively important signature genes ( and ). The identified signature genes are listed in . The convergence of these two algorithms identified nine signature genes: CDADC1, PPFIBP1, ENO2, NOM1, SLC25A14, METTL2A, LINC01089, L3HYPDH, and NPHP3 ().
Table 2 Analysis Results of Machine Learning
Figure 6 Machine learning was used to screen the diagnostic genes of OA.
Diagnostic Value Assessment
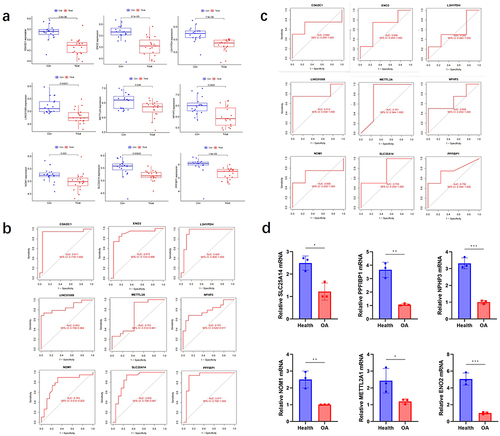
The identified genes were expressed at low levels in OA patients. (). The AUC values of the ROC analysis were 0.911 for CDADC1, 0.873 for ENO2, 0.925 for L3HYPDH, 0.853 for LINC01089, 0.701 for METTL2A, 0.781 for NPHP3, 0.783 for NOM1, 0.852 for SLC25A14, and 0.917 for PPFIBP1 (). Furthermore, the accuracy of each signature gene in predicting OA was evaluated using the external dataset GSE178557. The outcomes were in alignment with the trends observed in the GSE206848 and GSE98918 datasets (), demonstrating that these nine genes exhibited significant diagnostic efficiency in predicting OA. We extracted total RNA from three groups of clinical OA patients and healthy tissues. The RT-qPCR results were consistent with the expression predicted by the model. ().
Figure 7 The model genes expression.
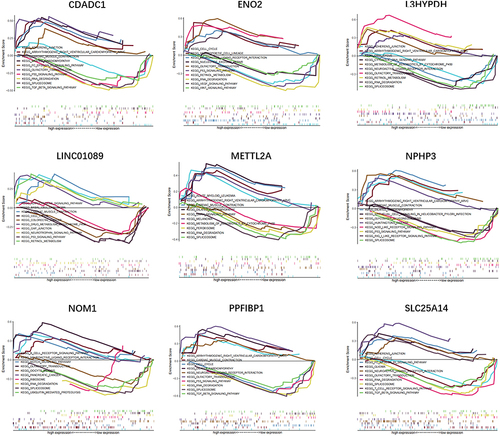
The top ten pathways for each gene are shown in . For instance, the expression of ENO2 is significantly correlated with RNA degradation, the cell cycle, and the Wnt signaling pathway. The expression of NOM1 correlated with the B-cell receptor pathway. The expression of PPFIBP1 significantly correlated with the cell cycle and olfactory transduction.
Figure 8 Analysis of the model genes in OA.
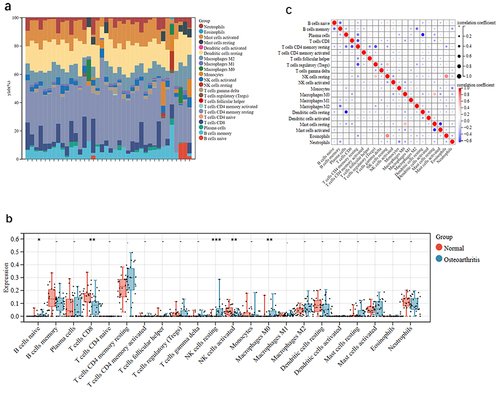
Immune Infiltration Analysis in OA
The immunological characteristics of the patients were illustrated in . Notably, OA patients exhibited higher levels of naive B cells and lower levels of activated NK cells (). We also found a positive correlation between resting NK cells and eosinophils, whereas resting dendritic cells were negatively correlated with plasma cells and memory B cells were negatively correlated with M2 macrophages ().
Figure 9 Immune cell infiltration analysis.
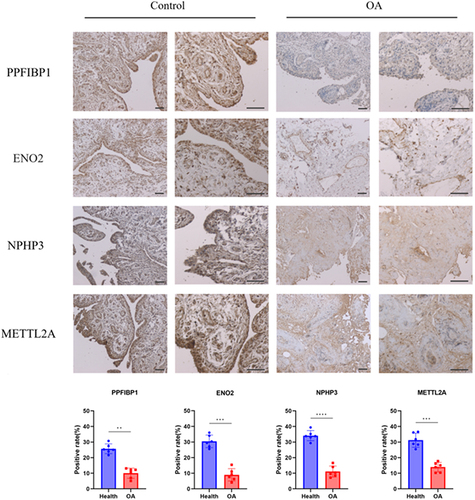
Expression of PPFIBP1, ENO2, NPHP3, and METTL2A in OA Tissues
illustrates the pathological features of synovium in the OA group. Marked proliferation and enlargement of synovial cells, neovascularization, pannus formation, and infiltration of various inflammatory cells including lymphocytes, macrophages, and neutrophils were observed. The compilation of target genes was also reduced along with the loss of normal synovial tissue. Additionally, immunohistochemical (IHC) analysis revealed that gene expression in the synovium of the OA group was consistent with the trends observed in the database.
Figure 10 Typical IHC graphics of signature genes staining in synovium.
Discussion
OA is a degenerative orthopedic disease that significantly affects the quality of life.Citation25 The diagnosis of OA is predominantly based on clinical manifestations and radiological studies; however, specific diagnostic biomarkers are lacking. In recent years, several studies have conducted high-throughput sequencing on OA’s synovium, cartilage, and meniscus in an attempt to identify diagnostic biomarkers.Citation26,Citation27 However, no study has integrated these three components to explore the mechanisms underlying OA progression from a holistic perspective. The diagnostic value of this model for OA was assessed using several methods.
CDADC1 is expressed in multiple tissues of the human body, particularly in the heart, muscles and brain.Citation28 GO analysis revealed that CDADC1 primarily participates in key biological processes, including the regulation of hydrolase activity, protein dimerization, cytidine deaminase activity, and DNA cytosine deamination. These biological functions are involved in OA development and development of OA. For example, hydrolases play a crucial role in joint cartilage self-repair by limiting excessive chondrocyte apoptosis and modulating inflammatory mediators to alleviate inflammatory reactions within the joints.Citation29,Citation30 These studies suggest that CDADC1 may be a potential target for alleviating OA.
ENO2 plays a pivotal role in the development of neural tissues.Citation31 GO analysis indicated that ENO2 is involved in glucose metabolism and glycolysis. Recent studies have revealed the pivotal role of glycolysis in regulating the energy metabolism and inflammatory responses in OA chondrocytes.Citation32 Glycolysis is correlated with the production of inflammatory mediators and aberrant chondrocyte differentiation under hypoxic conditions.Citation33 Therefore, interventions targeting ENO2 may offer new therapeutic strategies for alleviating OA symptoms and delaying disease progression.
L3HYPDH regulates dietary proteins and other proteins such as collagen IV.Citation34 GO analysis revealed that L3HYPDH primarily participates in the hydrolase activity. GO annotations related to METTL2A (Methyltransferase 2A) include methyltransferase and tRNA (cytidine) methyltransferase activities.Citation35 NOM1 (Nucleolar protein with MIF4G domain1) is involved in the biogenesis of ribosomal small subunits, while another diagnostic gene, SLC25A14, participates in ion flux across the mitochondrial membrane and the regulation of membrane potential.Citation36,Citation37 The functions of these genes are closely and intricately associated with the induction of inflammation in articular cartilage and degradation of the extracellular matrix. Identifying the specific connections between these regulatory factors and the OA phenotype is of paramount importance for future work.Citation38
NPHP3 is primarily involved in biological pathways, including organelle biogenesis, maintenance, and cargo trafficking to the periciliary membrane, and can also act as a molecular switch within the Wnt signaling pathway.Citation39 Abnormal activation of the Wnt pathway affects changes in the subchondral tissue and synovial inflammation.Citation40
PPFIBP is crucial for regulating focal adhesion disassembly and mediating protein-protein interactions at synapses.Citation41 The coordination of internal and external signal transduction is a key factor in the perception of stress transmission.Citation42 The pervasive presence of PPFIBP1 in the synovium, meniscus, and articular cartilage of OA patients highlights its potential as a diagnostic biomarker.Citation43 This indicates that PPFIBP1 may be instrumental in understanding the pathological processes of OA and may serve as a novel target for therapeutic interventions.
Naïve B cells, resting NK cells, and M0 macrophages play distinct roles in OA pathophysiological progression. Naive B cells differentiate into plasma cells that produce antibodies that target self-antigens within the joint.Citation44 This activity promotes inflammation and accelerates the tissue degradation. Resting NK cells play a dual role in OA. They can sometimes exacerbate local inflammation and, in special cases, promote knee joint repair through the secretion of growth factors.Citation45 M1 macrophages drive inflammation and tissue damage, whereas M2 macrophages facilitate resolution of inflammation and tissue repair.Citation46 The progression of OA may lead to a shift in balance, thereby influencing disease outcomes.
Our study has certain limitations. First, the data were sourced from public databases with a relatively small sample size, which might introduce selection bias and impact the diagnostic value. However, the reliability of our analysis was confirmed by using external datasets and immunohistochemistry. Secondly, larger clinical sample sizes and follow-up studies are required to validate our findings. Third, further investigation is required to elucidate the role of hub genes in immune response.
Conclusion
This study screened out Nine signature genes (CDADC1, PPFIBP1, ENO2, NOM1, SLC25A14, METTL2A, LINC01089, L3HYPDH, NPHP3) had a significant diagnostic value for OA. Additionally, we explored the characteristics of immune cell infiltration in patients with OA to provide new insights into OA treatment.
Ethics Approval
This study was conducted in accordance with the principles of the Declaration of Helsinki. The human-related data, surgical samples involved in this study have been approved by the Ethics Committee of the First Affiliated Hospital of Harbin Medical University.
Informed Consent
The study was conducted with informed consent from patients. All patients signed informed consent forms approved by the institutional review Committee.
Disclosure
The authors report no conflicts of interest in this work.
References
- Tang S, Yao L, Ruan J, et al. Single-cell atlas of human infrapatellar fat pad and synovium implicates APOE signaling in osteoarthritis pathology. Sci Transl Med. 2024;16(731):eadf4590. doi:10.1126/scitranslmed.adf4590
- Li J, Gui T, Yao L, et al. Synovium and infrapatellar fat pad share common mesenchymal progenitors and undergo coordinated changes in osteoarthritis. J Bone Miner Res. 2024. doi:10.1093/jbmr/zjad009
- Van kooten NJT, Blom AB, Teunissen van Manen IJ, et al. S100A8/A9 drives monocytes towards M2-like macrophage differentiation and associates with M2-like macrophages in osteoarthritic synovium. Rheumatology. 2024. doi:10.1093/rheumatology/keae020
- Lee K, Niku S, Koo SJ, Belezzuoli E, Guma M. Molecular imaging for evaluation of synovitis associated with osteoarthritis: a narrative review. Arthritis Res Ther. 2024;26(1):25. doi:10.1186/s13075-023-03258-6
- Ma J, Yu P, Ma S, et al. Bioinformatics and integrative experimental method to identifying and validating Co-expressed ferroptosis-related genes in OA articular cartilage and synovium. J Inflamm Res. 2024;17:957–980. doi:10.2147/JIR.S434226
- Chen Y, Zeng D, Wei G, et al. Pyroptosis in osteoarthritis: molecular mechanisms and therapeutic implications. J Inflamm Res. 2024;17:791–803. doi:10.2147/JIR.S445573
- Tian R, Su S, Yu Y, et al. Revolutionizing osteoarthritis treatment: how mesenchymal stem cells hold the key. Biomed Pharmacother. 2024;173:116458. doi:10.1016/j.biopha.2024.116458
- Foster NE, Eriksson L, Deveza L, Hall M. Osteoarthritis year in review 2022: epidemiology & therapy. Osteoarthritis Cartilage. 2023;31(7):876–883. doi:10.1016/j.joca.2023.03.008
- Li H, Yuan Y, Zhang L, Xu C, Xu H, Chen Z. Reprogramming macrophage polarization, depleting ROS by astaxanthin and thioketal-containing polymers delivering rapamycin for osteoarthritis treatment. Adv Sci. 2024;11(9):e2305363. doi:10.1002/advs.202305363
- Ma K, Pham T, Wang J, et al. Nanoparticle-based inhibition of vascular endothelial growth factor receptors alleviates osteoarthritis pain and cartilage damage. Sci Adv. 2024;10(7):eadi5501. doi:10.1126/sciadv.adi5501
- Yu J, Wang W, Jiang Z, Liu H. TPX2 upregulates MMP13 to promote the progression of lipopolysaccharide-induced osteoarthritis. PeerJ. 2024;12:e17032. doi:10.7717/peerj.17032
- Brophy RH, Zhang B, Cai L, Wright RW, Sandell LJ, Rai MF. Transcriptome comparison of meniscus from patients with and without osteoarthritis. Osteoarthritis Cartilage. 2018;26(3):422–432. doi:10.1016/j.joca.2017.12.004
- Liu Y, Yang Y, Lin Y, et al. N(6) -methyladenosine-modified circRNA RERE modulates osteoarthritis by regulating β-catenin ubiquitination and degradation. Cell Prolif. 2023;56(1):e13297. doi:10.1111/cpr.13297
- Su Y, Yu G, Li D, et al. Identification of mitophagy-related biomarkers in human osteoporosis based on a machine learning model. Front Physiol. 2023;14:1289976. doi:10.3389/fphys.2023.1289976
- Geng Y, Shao R, Xu T, Zhang L. Identification of a potential signature to predict the risk of postmenopausal osteoporosis. Gene. 2024;894:147942. doi:10.1016/j.gene.2023.147942
- Feng L, Chen Y, Mei X, Wang L, Zhao W, Yao J. Prognostic signature in osteosarcoma based on amino acid metabolism-associated genes. Cancer Biother Radiopharm. 2024. doi:10.1089/cbr.2024.0002
- Liu J, Lu Y, Liu Y, et al. A gene signature linked to fibroblast differentiation for prognostic prediction of mesothelioma. Cell Biosci. 2024;14(1):33. doi:10.1186/s13578-023-01180-7
- Duan X, Xing F, Zhang J, et al. Bioinformatic analysis of related immune cell infiltration and key genes in the progression of osteonecrosis of the femoral head. Front Immunol. 2023;14:1340446. doi:10.3389/fimmu.2023.1340446
- Tang H, Xie J, Du YX, Tan ZJ, Liang ZT. Osteosarcoma neutrophil extracellular trap network-associated gene recurrence and metastasis model. J Cancer Res Clin Oncol. 2024;150(2):48. doi:10.1007/s00432-023-05577-2
- Wang X, Liang Z, Liu Q, et al. Identification of PIK3R5 as a hub in septic myocardial injury and the cardioprotective effects of Psoralidin. Phytomedicine. 2024;122:155146. doi:10.1016/j.phymed.2023.155146
- Yuan H, Yang S, Han P, Sun M, Zhou C. Drug target genes and molecular mechanism investigation in isoflurane-induced anesthesia based on WGCNA and machine learning methods. Toxicol Mech Methods. 2024;34(3):319–333. doi:10.1080/15376516.2023.2286619
- Lee KS, Park H. Machine learning on thyroid disease: a review. Front Biosci. 2022;27(3):101. doi:10.31083/j.fbl2703101
- Tang J, Henderson A, Gardner P. Exploring AdaBoost and Random Forests machine learning approaches for infrared pathology on unbalanced data sets. Analyst. 2021;146(19):5880–5891. doi:10.1039/D0AN02155E
- Newman AM, Liu CL, Green MR, et al. Robust enumeration of cell subsets from tissue expression profiles. Nat Methods. 2015;12(5):453–457. doi:10.1038/nmeth.3337
- Swain S, Sarmanova A, Mallen C, et al. Trends in incidence and prevalence of osteoarthritis in the United Kingdom: findings from the Clinical Practice Research Datalink (CPRD). Osteoarthritis Cartilage. 2020;28(6):792–801. doi:10.1016/j.joca.2020.03.004
- Mathiessen A, Cimmino MA, Hammer HB, Haugen IK, Iagnocco A, Conaghan PG. Imaging of osteoarthritis (OA): what is new? Best Pract Res Clin Rheumatol. 2016;30(4):653–669. doi:10.1016/j.berh.2016.09.007
- Demehri S, Guermazi A, Kwoh CK. Diagnosis and longitudinal assessment of osteoarthritis: review of available imaging techniques. Rheum Dis Clin North Am. 2016;42(4):607–620. doi:10.1016/j.rdc.2016.07.004
- Xu Y, Li L, Li J, Liu Q. Structural and biological function of NYD-SP15 as a new member of cytidine deaminases. Gene. 2016;583(1):36–47. doi:10.1016/j.gene.2016.02.048
- Wu Y, Shen S, Chen J, et al. Metabolite asymmetric dimethylarginine (ADMA) functions as a destabilization enhancer of SOX9 mediated by DDAH1 in osteoarthritis. Sci Adv. 2023;9(6):eade5584. doi:10.1126/sciadv.ade5584
- Zheng L, Zhang Z, Sheng P, Mobasheri A. The role of metabolism in chondrocyte dysfunction and the progression of osteoarthritis. Ageing Res Rev. 2021;66:101249. doi:10.1016/j.arr.2020.101249
- Chai G, Brewer JM, Lovelace LL, Aoki T, Minor W, Lebioda L. Expression, purification and the 1.8 angstroms resolution crystal structure of human neuron specific enolase. J Mol Biol. 2004;341(4):1015–1021. doi:10.1016/j.jmb.2004.05.068
- Matsuoka K, Bakiri L, Bilban M, et al. Metabolic rewiring controlled by c-Fos governs cartilage integrity in osteoarthritis. Ann Rheum Dis. 2023;82(9):1227–1239. doi:10.1136/ard-2023-224002
- Arra M, Swarnkar G, Ke K, et al. LDHA-mediated ROS generation in chondrocytes is a potential therapeutic target for osteoarthritis. Nat Commun. 2020;11(1):3427. doi:10.1038/s41467-020-17242-0
- Visser WF, Verhoeven-Duif NM, de Koning TJ. Identification of a human trans-3-hydroxy-L-proline dehydratase, the first characterized member of a novel family of proline racemase-like enzymes. J Biol Chem. 2012;287(26):21654–21662. doi:10.1074/jbc.M112.363218
- Mao XL, Li ZH, Huang MH, et al. Mutually exclusive substrate selection strategy by human m3C RNA transferases METTL2A and METTL6. Nucleic Acids Res. 2021;49(14):8309–8323. doi:10.1093/nar/gkab603
- Heus HC, Hing A, van Baren MJ, et al. A physical and transcriptional map of the preaxial polydactyly locus on chromosome 7q36. Genomics. 1999;57(3):342–351. doi:10.1006/geno.1999.5796
- Gorgoglione R, Porcelli V, Santoro A, et al. The human uncoupling proteins 5 and 6 (UCP5/SLC25A14 and UCP6/SLC25A30) transport sulfur oxyanions, phosphate and dicarboxylates. Biochim Biophys Acta Bioenergy. 2019;1860(9):724–733. doi:10.1016/j.bbabio.2019.07.010
- Zhao Z, Wang Z, Pei L, Zhou X, Liu Y. Long non-coding ribonucleic acid AFAP1-AS1 promotes chondrocyte proliferation via the miR-512-3p/matrix metallopeptidase 13 (MMP-13) axis. Bioengineered. 2022;13(3):5386–5395. doi:10.1080/21655979.2022.2031390
- Olbrich H, Fliegauf M, Hoefele J, et al. Mutations in a novel gene, NPHP3, cause adolescent nephronophthisis, tapeto-retinal degeneration and hepatic fibrosis. Nat Genet. 2003;34(4):455–459. doi:10.1038/ng1216
- Shang X, Böker KO, Taheri S, Hawellek T, Lehmann W, Schilling AF. The Interaction between microRNAs and the Wnt/β-Catenin signaling pathway in osteoarthritis. Int J Mol Sci. 2021;22(18):9887. doi:10.3390/ijms22189887
- Kriajevska M, Fischer-Larsen M, Moertz E, et al. Liprin beta 1, a member of the family of LAR transmembrane tyrosine phosphatase-interacting proteins, is a new target for the metastasis-associated protein S100A4 (Mts1). J Biol Chem. 2002;277(7):5229–5235. doi:10.1074/jbc.M110976200
- Wu TJ, Chang SL, Lin CY, et al. IL-17 facilitates VCAM-1 production and monocyte adhesion in osteoarthritis synovial fibroblasts by suppressing miR-5701 synthesis. Int J Mol Sci. 2022;23(12). doi:10.3390/ijms23126804
- Steinberg J, Southam L, Fontalis A, et al. Linking chondrocyte and synovial transcriptional profile to clinical phenotype in osteoarthritis. Ann Rheum Dis. 2021;80(8):1070–1074. doi:10.1136/annrheumdis-2020-219760
- Domínguez Conde C, Xu C, Jarvis LB, et al. Cross-tissue immune cell analysis reveals tissue-specific features in humans. Science. 2022;376(6594):eabl5197. doi:10.1126/science.abl5197
- Yang J, Fan Y, Liu S. ATF3 as a potential diagnostic marker of early-stage osteoarthritis and its correlation with immune infiltration through bioinformatics analysis. Bone Joint Res. 2022;11(9):679–689. doi:10.1302/2046-3758.119.BJR-2022-0075.R1
- Kou L, Huang H, Tang Y, et al. Opsonized nanoparticles target and regulate macrophage polarization for osteoarthritis therapy: a trapping strategy. J Control Release. 2022;347:237–255. doi:10.1016/j.jconrel.2022.04.037