Abstract
Purpose:
Formal presentations are a common requirement for students in health professional programs, and evaluations are often viewed as subjective. To date, literature describing the reliability or validity of seminar grading rubrics is lacking. The objectives of this study were to characterize inter-rater agreement and internal consistency of a grading rubric used in a grand rounds seminar course.
Methods:
Retrospective study of 252 student presentations given from fall 2007 to fall 2008. Data including student and faculty demographics, overall content score, overall communication scores, subcomponents of content and communication, and total presentation scores were collected. Statistical analyses were performed using SPSS, 16.0.
Results:
The rubric demonstrated internal consistency (Cronbach’s alpha = 0.826). Mean grade difference between faculty graders was 4.54 percentage points (SD = 3.614), with ≤ 10-point difference for 92.5% of faculty evaluations. Student self evaluations correlated with faculty scores for content, communication, and overall presentation (r = 0.513, r = 0.455, and r = 0.539; P < 0.001 for all respectively). When comparing mean faculty scores to student’s self-evaluations between quintiles, students with lower faculty evaluations overestimated their performance, and those with high faculty evaluations underestimated their performance (P < 0.001).
Conclusion:
The seminar evaluation rubric demonstrated inter-rater agreement and internal consistency.
Introduction
The ability to communicate effectively and utilize evidence-based medicine principles are core competencies for health care professionals.Citation1 Pharmacists, physicians, nurses, and other health care professionals must collaborate and communicate in an interdisciplinary fashion to integrate current research findings into clinical practice.
Evaluating the reliability and validity of various forms of medical literature, and being able to educate both the public and other healthcare professionals, are important competencies in training programs and licensure.Citation2–Citation6 Upon graduation, healthcare professionals frequently will be required to research and evaluate literature to answer clinical questions. In addition, many will be called upon to provide various educational presentations, either as an informal discussion or lecture, or formal continuing education seminars.
One method by which effective communication methods and use of evidence-based medicine principles may be assessed is through a seminar course. Since 1996, two seminar courses designed to instill these skills have been required as part of the Doctor of Pharmacy curriculum at the Texas Tech University Health Sciences School of Pharmacy. The Grand Rounds courses are 2-credit courses that occur in the fall and spring of the fourth professional year (PHAR 4241 and 4242 respectively) across three campuses (Amarillo, Dallas, and Lubbock, Texas, USA). Each semester, a student must present one 40-minute seminar on a timely and/or controversial topic, with 5–10 minutes allotted for questions and answers. Topics suitable for presentations are those that would be interesting to practicing pharmacists. These may include new medications, therapeutic controversies, practice management issues, pharmacy-related law, medical ethics, or pharmacoeconomics.
The framework utilized for development of student presentations is based on the Accreditation Council on Pharmacy Education, Accreditation Standards for Continuing Pharmacy Education.Citation7 Learning outcomes for the course include the ability to: 1) Define a pharmacy practice topic that is appropriately focused and is of general interest to pharmacy practitioners; 2) Design an effective presentation, synthesizing clinical literature and incorporating both basic science and pharmacy practice content, which meets ACPE guidelines; 3) Utilize a faculty mentor for feedback in the research, development, and execution of a slide presentation; 4) Demonstrate effective public communication skills; and 5) Self-evaluate presentation content and communication skills.
Prior to 2006, one faculty member would grade the content of a student seminar and another would grade communication skills. A common complaint by students was their feeling that the presentation evaluations were overly subjective, and resulted in significant grade discrepancies. Informal polling of faculty involved with grading tended to corroborate this assumption, which was consistent with respondents to a faculty survey of communication skills development.Citation8 This was felt in large part due to lack of specific, descriptive, objective criteria that outlined the competencies and expectations clearly in the grading form. In addition, students would sometimes complain that evaluations would differ depending upon campus location or by various levels of faculty rank.
In 2006, a new grading rubric was designed to assess both the content and communication skills of students. The grading rubric that was developed incorporated specific outcomes for each subcategory of seminar content and communication, and thus appeared to be more objective and subject to less inter-rater variability. In developing this tool, a review of the health sciences and education literature, Internet search, and informal survey of academic pharmacy faculty was conducted via the American College of Clinical Pharmacy list serve. The course coordinator (EJM) constructed the first draft of the rubric, creating specific sections and subsections that assessed and weighted specific criteria. The criteria selected were felt essential components of a professional seminar, consistent with the goals and objectives of the Grand Rounds course. After construction, the rubric was distributed to faculty course members for review and further refinement.
In addition to developing a new rubric in 2006, a new student self-assessment process was incorporated into the course. By requiring students to view and evaluate their own presentation using the same rubric that the faculty used, it was hoped that this would provide students more insight into the grade they received and enhance development of their presentation skills.
In developing the rubric (Appendix 1), it was noted that little-to-no literature was available describing the validity or reliability of seminar evaluation tools. While a seminar grading rubric has been published in the pharmacy education literature,Citation9 and numerous public speaking rubrics are widely available on the Internet, the vast majority of these assessments instruments appear somewhat subjective nor are they specific for health professionals. In addition, to our knowledge, no study has assessed the utility or reliability of student self-evaluation of performance in a pharmacy seminar course.
The primary objectives of this study were to assess the consistency of faculty scoring using the revised grading rubric, and to compare the results of student self-evaluations to faculty evaluations. Secondary objectives included assessing the internal consistency of the rubric and determining if differences exist in rubric scoring depending on campus location or other factors that may influence faculty evaluations (eg, academic rank).
Methods
This was a retrospective study of fourth year Doctor of Pharmacy students enrolled in the fall 2007, spring 2008, and fall 2008 grand rounds courses (PHAR 4241 and 4242 for the fall and spring courses, respectively). Students enrolled attended a two-hour course orientation each summer that outlined the expectations and requirements of the courses and reviewed the grading rubric.
Two independent faculty members graded each presentation using the revised rubric. Written instructions for using the rubric were included on the evaluation form and a “frequently asked questions” document was distributed to all graders. For each student presentation, two faculty members were nonrandomly selected from the faculty pool to serve as graders. Thus, faculty graders potentially varied for each student presentation. Each student’s final presentation score was determined by averaging the two faculty grades. Streaming videos were made of all presentations and uploaded to WebCT 6 (Blackboard Inc, Washington, DC, USA). Students were required to view their presentations, and complete a self-assessment of their performance using the same grading rubric used by the faculty graders. While the student’s self-assessment grade was not incorporated as part of their final course grade, it was required in order to successfully complete the course (ie, failure to do so would result in an “incomplete”).
Data from faculty evaluations of presentations and student self-evaluations were collected. This data included the mean overall presentation grade, overall content and communication grades, and each subcategory of the content and communication assessment. The professorial rank of the faculty grader (ie, clinical instructor [resident], assistant professor, associate professor, or professor) was also collected. Student baseline demographics including age, gender, race, campus location, and pre-course enrollment GPA were obtained from the Office of Student Services. All data was input and maintained in a Microsoft Excel (Redmond, VA, USA) spreadsheet. Study approval was obtained from the Institutional Review Board.
Statistical analysis
Data were converted from Microsoft Excel to SPSS Version 16.0 (Chicago, Ill, USA). Descriptive statistics were used for baseline student information. Internal consistency of the rubric was assessed using Cronbach’s alpha, which provides a point-estimate measure of how well items in the rubric correlate with each other. Cronbach’s alpha was calculated using the raw scores for the 15 items in the rubric based upon scores assigned from each faculty evaluation of each student presentation.
Pearson’s correlation coefficient was used to determine the correlation between the mean faculty presentation grade and student self-evaluation. Agreement of grades between faculty pairs was operationally defined as the absolute value of the difference of scores assigned by faculty pairs for each student grand rounds presentation. For example, if student A received an overall score of 87 by faculty X and 89 by faculty Y, the grade agreement score for student A was |87–89| = 2. This definition provided an interval-level measure for each student presentation of how well the scores of faculty pairs agreed.
To test for differences in mean grade agreement scores between groups (ie, student gender, campus, semester), t-test and analysis of variance methods were used. Additionally, a Pearson’s correlation coefficient was calculated to determine if grade agreement scores were associated with student age. A P-value of <0.05 was set for level of significance.
Results
From fall of 2007 through fall of 2008, 168 students were enrolled in the grand rounds courses (PHAR 4241 and 4242). These students delivered 252 presentations over 3 campuses (Amarillo n = 85, Dallas n = 109, and Lubbock n = 58). All faculty evaluation data were available for analysis. Two student self-evaluations were excluded due to incomplete data. Student demographics and pre-course enrollment GPA are presented in .
Table 1 Baseline student demographics
Internal consistency of the rubric as measured by Cronbach’s alpha was 0.826. While a Cronbach’s alpha of 0.70 or greater is often cited as being deemed acceptable,Citation10 some suggest a minimum of 0.80.Citation11 However, the level of acceptability may be higher or lower depending upon the purpose of the examination.Citation11 For this assessment, the rubric demonstrated acceptable internal consistency.
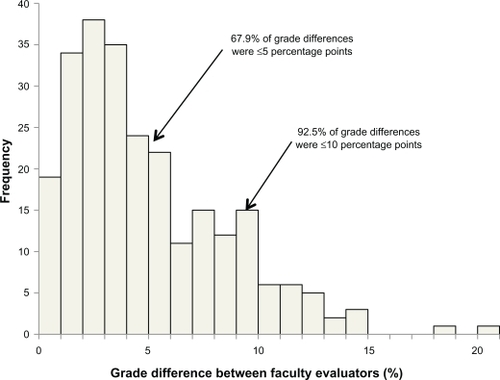
The mean grade agreement score for the 252 presentations was 4.54 percentage points (SD = 3.614). Grade agreement scores ranged from a low of 0 percentage points (both graders gave the same overall score) to a high of 20 percentage points (one grader gave a 96% while the other gave a 76%). Of note though, 92.5% of the grade agreement scores were 10 percentage points or less and 67.9% of the grade differences were 5 percentage points or less ().
Figure 1 Histogram depicting the differences in score between faculty graders.
Mean grade agreement scores (difference in student presentation grades between faculty grader 1 and 2) for the three campuses were 4.6 ± 4.0, 4.9 ± 3.6 and 3.6 ± 2.8 (mean ± SD). There was no significant difference in mean grade agreement depending upon campus location (P = 0.065). In addition, there was no difference based on age (r = 0.045, P = 0.476), gender (mean grade for males was 4.9 ± 3.9 versus 4.2 ± 3.4 for females; P = 0.138), and results did not vary by semester (mean grades 5.01 ± 3.78, 4.21 ± 3.55, and 4.37 ± 3.48; P = 0.311).
To determine if differences in faculty rank may have affected scoring, each pair of faculty graders were categorized as having the same academic rank, having ranks that differ by one (eg, assistant vs associate professor), having ranks that differ by two (eg, assistant vs full professor) or having ranks that differ by three (eg, resident vs full professor). Among the four strata of faculty grader pairs, mean grade agreement scores ranged from 3.89 to 4.95 (). These differences were not significant (P = 0.553), suggesting that grade agreement was not biased by differences in faculty rank.
Table 2 Grade difference of faculty pairs stratified by differences in academic rank
In order to receive their grade, students were required to watch a video of their presentation and complete the same evaluation form as the faculty graders. There was a statistically significant correlation between the overall presentation grade, overall content score, and overall communication score between the student’s self-evaluation and faculty-assessed performance ().
Table 3 Correlation between student self-evaluation and faculty presentation scoresTable Footnotea (n = 252)
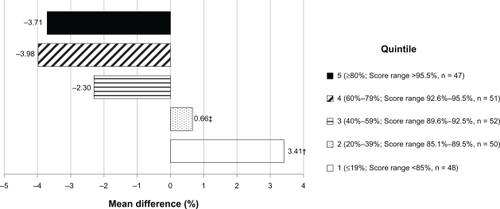
To determine if there was a difference in how students evaluated their performance based on the grade they received for the presentation, quintiles (ie, 0%–19%, 20%–39%, 40%–59%, 60%–79%, 80%–100%) were used to characterize low versus high performing students. As can be seen in , mean differences between student and faculty scores differed by quintile (3.41, 0.66, −2.30, −3.98, −3.71, for lowest to highest quintile, respectively). Students in the lowest quintile overestimated their performance by a mean of 3.41 points and students in the upper quintiles underestimated their performance (F(4, 243) = 18.336, P < 0.001). This finding was confirmed by the correlation of faculty scores with the difference of student and faculty scores; r = −0.541, n = 248, P < 0.001. Low performing students overestimated their performance and high performing students underestimated their performance.
Figure 2 Differences between student self-evaluation and faculty presentation scores by quintile.a
Discussion
To our knowledge, this is the first study to assess and characterize a seminar grading rubric in a health professions curriculum. Internal consistency (a necessary condition for construct validity) of this tool was acceptable (Cronbach’s alpha = 0.826), demonstrating that the 15 items in the rubric consistently measured students’ presentation outcomes. In addition, the inter-rater grade agreement analysis demonstrated consistency in presentation assessments. Inter-rater agreement was not biased by student age, gender, or race and did not vary significantly based upon campus, over time (ie, between semesters), or faculty rank.
While the aim of the current study was not to determine the validity of the rubric, components of validity were addressed. Content validity was established by basing the rubric upon established methods including a thorough review of the literature as well as informal polling of other pharmacy institutions. In addition, the rubric was reviewed by faculty with expertise in pharmacy education to validate that the items were appropriate or valid. Furthermore, convergent validity was supported by the acceptable level of internal consistency.
Findings of the current study regarding differences in student perceptions of their performance compared to the faculty graders were consistent with those of others.Citation12–Citation14 Students with grades in the lower quintiles self-evaluated their performance higher than the faculty, whereas students who were in the highest quintiles rated their performance lower than faculty. This suggested that students who performed poorly may have limited insight into weaknesses and overestimated their strengths, whereas students who performed well underestimated their strengths and overestimated weaknesses.
Despite the strengths of the current study, there are some limitations. With respect to external validity, our findings should only be generalized to education programs with student and faculty characteristics similar to ours. Due to lack of a “standard” seminar grading form, we were not able to demonstrate criterion validity for this grading tool.
Another limitation of the study was some instances of large disparities (ie, >10 points) between faculty graders. While the difference in faculty evaluations for the majority of presentations were less than 5 percentage points, there were instances in which faculty differed by more than 10 points, despite an effort to orient faculty to the grading rubric and providing detailed directions. However, averaging the two faculty evaluations mitigated most of the differences. A formal training session for faculty involved in the grading process may have yielded improved inter-rater grade agreement, and should be considered in the future.
Conclusion
The seminar evaluation rubric demonstrated inter-rater grade agreement and internal consistency. While this rubric was designed specifically for a pharmacy curriculum, it could be easily adapted for use by other health professional programs that require formal student presentations. Significant correlation between faculty evaluations and students’ self-assessment was noted. Similarly, there was generally good agreement between faculty grader pairs. Consistent with prior research, students who performed poorly rated their self-performance higher than the faculty. Likewise, students who performed well rated their performance lower than the faculty. Future studies should be conducted to determine if similar results would be seen if the rubric were used in other health professional curricula that require a formal presentation. It would also be useful to identify other faculty-associated factors that may result in grade disparities (eg, academic background, years of experience) and how these may be mitigated. In addition, it would be useful to assess the impact of student self-assessment on future public speaking activities to determine if performance is improved.
Acknowledgements
We would like to acknowledge Dr Melissa Medina from the University of Oklahoma who developed and shared her seminar grading form, and was of assistance in developing our form. In addition, we would like to thank Mrs Toni Bryan for her assistance with data entry.
Disclosure
The authors report no conflicts of interest in this work.
References
- The core competencies needed for health care professionalsGreinerACKnebelEHealth professions education: a bridge to qualityThe National Academy of Sciences20034573
- Accreditation Standards and Guidelines for the professional program in pharmacy leading to the doctor of pharmacy degreeAccreditation Council for Pharmacy Education Available at http://www.acpe-accredit.org/pdf/ACPE_Revised_PharmD_Standards_Adopted_Jan152006.pdf. Accesed May 14, 2010.
- Functions and structure of a medical school: standards for accreditation of medical education programs leading to the M.D. degreeLiaison Committee on Medical Education Available at: http://www.lcme.org/standard.htm. Accessed Jun 25, 2010.
- HatalaRGuyattGEvaluating the teaching of evidence-based medicineJAMA200228891110111212204080
- NLNAC Standards and criteria for baccalaureate degree2008National League for Nursing Accrediting Commission, Inc Available at: http://www.nlnac.org/manuals/SC2008.htm. Accessed Jun 25, 2010.
- NLNAC Standards and criteria for clinical doctorate degree2008National League for Nursing Accrediting Commission, Inc Available at: http://www.nlnac.org/manuals/SC2008.htm Accessed Jun 25, 2010.
- Accreditation standards for continuing pharmacy education: effective January 1, 2009Accreditation Council for Pharmacy Education Available at: http://www.acpe-accredit.org/ceproviders/standards.asp. Accessed Jun 25, 2010.
- BeardsleyRSCommunication skills development in colleges of pharmacyAm J Pharm Educ200165307314
- PoirierTIA seminar course on contemporary pharmacy issuesAm J Pharm Educ20087223018483598
- DeVonHABlockMEMoyle-WrightPA psychometric tool-box for testing validity and reliabilityJ Nurs Scholarsh200739215516417535316
- van der VleutenCPSchuwirthLWAssessing professional competence: from methods to programmesMed Educ200539330931715733167
- StefaniLAJPeer, self and tutor assessment: Relative reliabilitiesStudies in Higher Education199419169
- AlbaneseMDottlSMejicanoGDistorted perceptions of competence and incompetence are more than regression effectsAdv Health Sci Educ Theory Pract200611326727816832709
- EvaKWCunningtonJPReiterHIKeaneDRNormanGRHow can I know what I don’t know? Poor self assessment in a well-defined domainAdv Health Sci Educ Theory Pract20049321122415316272