Abstract
Background:
Improvement in acute stroke care requires the identification of variables which may influence care quality. The nature and impact of demographic and stroke-related variables on care quality provided by allied health (AH) professionals is unknown.
Aims:
Our research explores the association of age and gender on an index of acute stroke care quality provided by AH professionals.
Methods:
A retrospective clinical audit of 300 acute stroke patients extracted data on AH care, patients’ age and gender. AH care quality was determined by the summed compliance with 20 predetermined process indicators. Our analysis explored relationships between this index of quality, age, and gender. Age was considered in different ways (as a continuous variable, and in different categories). It was correlated with care quality, using gender-specific linear and logistic regression models. Gender was then considered as a confounder in an overall model.
Results:
No significant association was found for any treatment of age and the index of AH care quality. There were no differences in gender-specific models, and gender did not significantly adjust the age association with care quality.
Conclusion:
Age and gender were not predictors of the quality of care provided to acute stroke patients by AH professionals.
Introduction
During the next 2 decades, increasing numbers of older patients are predicted to present to tertiary hospitals in Western countries with acute stroke due to the aging of these populations.Citation1 To meet this challenge, stroke services must deliver care in the most effective and evidence-based manner so that scarce resources are used wisely.Citation2,Citation3
There is strong evidence that treating stroke patients in specialist stroke units, where evidence-based care is delivered in a coordinated manner according to agreed protocols or clinical guidelines, results in significantly improved outcomes for patients of all ages.Citation4,Citation5 In line with this evidence-based approach, it is important to audit the quality of care provided in acute stroke settings, and benchmark findings against the current best practice recommendations.Citation6 Targeted quality improvement strategies to improve the clinical care provided to acute stroke patients require the identification of factors which may influence the quality of care.Citation7
Allied health (AH) professionals are members of mulidisciplinary teams who provide care to patients after acute stroke. Although many aspects of acute stroke care are inter-disciplinary, AH professionals can make significant contributions to specific areas such as stroke rehabilitation, the prevention of complications, and discharge planning. Despite a growing number of studies exploring stroke care quality, very little in known about the contributions that AH professions make to this quality, or the factors that may influence their care.Citation4,Citation5,Citation8–Citation14
Older age has been explored in recent literature as a determinant of care quality received by patients following acute stroke.Citation8–Citation14 This avenue of enquiry has been supported by evidence that older stroke patients often have worse outcomes than younger patients.Citation15 In an earlier review of literature, we reported on 9 studies that provided data on age-related differences in stroke care quality, most of which suggested that older patients may be disadvantaged in elements of acute care. However it is unclear whether quality of care is related directly to patients’ age per se, or whether care is influenced by other factors which are associated with older age, such as comorbidity levels, prestroke function, or even stroke severity.Citation16,Citation17 Studies of age associations with stroke care quality have emphasized medical processes such as the provision of timely brain scans and medication use.Citation11,Citation12,Citation17,Citation18 There is little clear evidence available on factors which may influence the quality of the care contributed by AH professionals. Our review found 5 studies which partly examined age associations for compliance with process indicators relevant to AH.Citation9,Citation10,Citation13,Citation14,Citation16 These studies reported differing associations between age and process indicator compliance, suggesting that age may not be a significant determinant of the AH process of care.
Gender has also been explored as a determinant of the quality of medical care provided to acute stroke patients, with equivocal findings. Several investigators have reported that females were less likely to receive medical diagnostic tests and interventions than males.Citation19–Citation21 In contrast, other studies have failed to find an association of stroke care quality with gender alone.Citation10,Citation14,Citation18,Citation22,Citation23 Debate continues among researchers on the probable confounding associations between gender, and variables such as age, stroke severity, comorbidities, and prestroke dependency.Citation16–Citation18,Citation24 While there is general agreement that women in the Western world generally live longer than men,Citation25 and that women on average are older than men at stroke onset,Citation14,Citation16,Citation18 the relationship between gender and stroke severity and comorbidity is less clear.Citation18 Little is known on the influence of gender on the quality of care as it relates to AH professionals’ clinical practice.
Another problem for researchers exploring stroke care quality is that there are currently no agreed age categorizations for analysis. Some studies have chosen age 75 years to differentiate between younger and older stroke patients,Citation5,Citation9,Citation26 while others have chosen age 80 years,Citation11,Citation16 or an assortment of 10-year age ranges.Citation10,Citation12–Citation14
Our study aimed to explore the determinants of the quality of care provided to acute stroke patients by AH professionals. This paper reports on our investigations of the best way to treat patients’ age for analysis in such studies, and to determine the influence of gender on age associations.
Methods
Study design
Ethics
Approval for this study was obtained from the Human Research Ethics Committees of the principal author’s university and each participating hospital.
Study design
This was a retrospective clinical audit of consecutively sampled acute stroke patients’ medical records. Informed patient consent was not required, as the data were routinely collected for audit purposes by Australian hospitals. Nevertheless patient confidentiality and anonymity in reporting were protected by not identifying patients in any way during reporting. The study design constrained investigations of the influence of putative causes, to measures of association only.
Sample size
Three hundred medical records were sampled, 100 each from 3 large metropolitan tertiary hospitals in Adelaide, South Australia, Australia. Our earlier pilot audit of 50 medical records established the feasibility of data collection processes, and assisted with sample size calculation from this study. Our sample of 300 records was sufficiently powered at α = 0.05, β = 0.8 for subgroup analysis.Citation27
Inclusion and exclusion criteria
Patient medical records were included if they had a diagnosis of acute stroke as defined by ICD10 codes and confirmed by diagnostic imaging and/or clinical evidence. Eligible patients were consecutively admitted prior to August 31, 2009. Medical records were excluded for patients who had presented with transient ischemic attack or subarachnoid hemorrhage or if the records did not become available for auditing within the data collection period.
Measures of quality of AH care
We previously reported on the measurement of quality of care in acute settings, provided by AH professionals to patients with stroke.Citation27,Citation28 AH professions of interest in our research are those commonly found in acute stroke teams: physiotherapy, occupational therapy, speech pathology, dietetics, social work, and psychology.Citation29 We acknowledge that these professions account for only part of a stroke multidisciplinary team and that role overlap in well-functioning teams is desirable.Citation29 Process indicators are the simplest and most sensitive measure for evaluation of the quality of care.Citation30 We undertook a systematic review of the literature to select the most appropriate process indicators for AH, and details of our methodology have been published elsewhere.Citation28 Process indicators were extracted from the literature, and 20 care quality indicators were identified that were relevant to AH. These indicators were also aligned to recommendations in the Australian Clinical Guidelines for Stroke Management.Citation29 Although many of these indicators describe inter-disciplinary tasks undertaken collaboratively within a stroke team, the focus of this study is the ability of AH professionals to contribute to this work, within an Australian context. Compliance with these process indicators became the dependent variables for our investigations of the influence of age and gender on the quality of processes of AH care:
Swallow screening performed within 24 hours of admission
Physiotherapy assessment performed within 48 hours of admission
Occupational therapy assessment performed within 48 hours of admission
Speech pathology assessment performed within 48 hours of admission
Dietitian assessment within 48 hours of admission
Social worker assessment within 7 days of admission
Standardized cognitive assessment performed during admission
First mobilization within 24 hours of stroke onset
Early commencement of physiotherapy rehabilitation within 48 hours of admission
Early commencement of speech pathology rehabilitation within 48 hours of admission
Early commencement of occupational therapy rehabilitation with 48 hours of admission
Naso-gastric tube (NGT) for patients who do not recover a functional swallow during the first month post stroke
Nutritional screen performed during admission
Mood assessment performed during admission
Family meeting held during admission
Stroke education/information for patient/carer during admission
Stroke secondary prevention discussed with patient/carer
Home visit performed if discharged to home
Carer skills training provided prior to discharge if discharged to home
Discharge plan provided to patient/carer
Data
De-identified data from all patient records were manually extracted by the principal researcher, and entered into a purpose-built MS Excel spreadsheet.
Dependent variable
Evidence was sought from the medical records regarding whether each patient’s care had complied with the 20 individual process indicators. Compliance was recorded in binary terms (yes = 1/no = 0) or as ‘not applicable’ in some instances. We recognized that not all process indicators would be applicable to all patients (eg, the patient was unable to participate in active rehabilitation for specific clinical reasons). To clarify and standardize the process, auditing definitions were developed to determine whether or not process indicators had been met. These were adapted from the National Stroke Foundation’s Acute Stroke Services Framework 2008 document.Citation6
For the purpose of this paper, the dependent variable was per-patient total compliance with the 20 processes of care (deemed an index of quality), which standardized patient ineligibility for some indicators. Compliance was therefore expressed as the percentage of indicators met, of the possible number of indicators relevant for that patient.
Independent variables
This paper reports on patient age and gender.
Analysis processes
We undertook a stepped series of analyses. Data were analyzed using SAS Proprietary Software Version 9.2.
Step 1
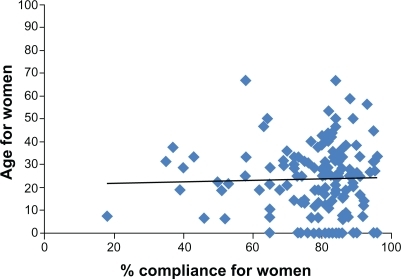
Age was treated as a continuous variable, and correlated with percentage compliance with AH processes of care, using gender-specific linear regression models. The findings were reported as scatter plots, and Pearson r2 statistics, which expressed the strength of association between the 2 variables. The analyses were conducted for men and women separately because of the possible confounding influence of gender.
Step 2
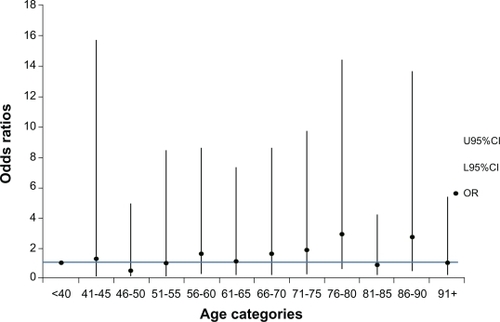
Age was then divided for analysis into 12, 5-year age categories, from <40 years to 91+ years, reflecting the age range in the sample. The index of percentage compliance with AH care was divided at the median value (21.2%) for analysis purposes. The default comparator was the youngest age group (<40 years). Univariate gender-specific logistic regression models were constructed to test the relationship between binary form compliance (quality of care) and independent 5-year age intervals. The findings were reported as crude odds ratios and 95% confidence intervals (OR, 95% CI).
The influence of patient gender on care compliance was also examined in this step. The frequency distribution of men and women in each of the 5-year age groups was reported. The influence of gender on process indicator compliance was explored as the gender difference in total percentage compliance, using Student t-tests.
Step 3
We were concerned that the small number of subjects in the younger age groups, and the potentially different etiology of their stroke, may have unduly interfered with a clear understanding of the association with quality of care. Thus the age categories were reorganized into 5, 10 year-age categories, mapped in a similar way to the categories proposed by Rudd et al.Citation10 We added an additional younger category (<55 years, 55–64 years, 65–74 years, 75–84 years, and 85+ years). Univariate gender-specific logistic regression models were again constructed to test the relationship between binary form compliance (quality of care index) and independent 10-year age categories. The findings were again reported as crude odds ratios and 95% confidence intervals (OR, 95% CI). Gender was then added to this model, to test its potential confounding influence. The findings were reported as adjusted odds ratios and 95% confidence intervals (AOR, 95% CI).
Results
Age profile
The median age of the 300 patients at stroke onset was 77.5 years (mean 74.7 years [SD 13.5]; range 18–100 years). Few patients were included in the younger age categories, as outlined in .
Table 1 Age distribution in five year age categories
Gender–age profile
Overall, there were relatively equal numbers of men and women in the dataset (47% women and 53% men).
Compliance with quality of care index
The percentage compliance of actual care provided in the 20 process indicators ranged from 0% to 100%, with the median value being 21.2% (25th% 11.1, 75th% 31.3%).
Step 1
Considering the interval age and compliance data for men and women separately, there were nonsignificant linear associations in both instances. In men, there was a negative trend for compliance with increasing age (r2 = 0.02), while in women there was an almost linear trend of compliance with age (r2 = 0.001) (see and ).
Figure 1 Age and compliance scatter plots for men.
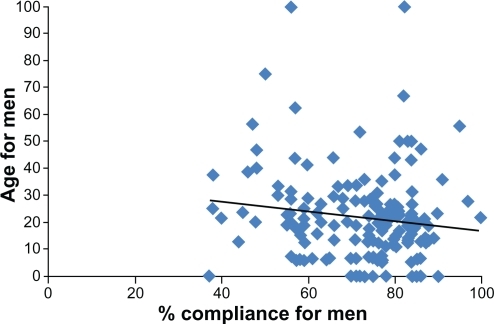
Figure 2 Age and compliance scatter plots for women.
Step 2
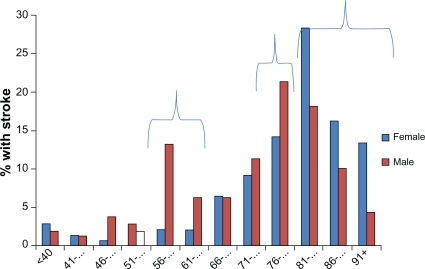
The gender profile in the 12, 5-year age categories varied. There was a significantly higher percentage of male stroke patients in the 56- to 65-year age categories, and the 76- to 80-year age category, and a significantly higher percentage of female stroke patients over the age of 81 years (). This potentially reflects the epidemiology/demography of stroke, as well as the age-gender profile in the general community.Citation17,Citation31
Figure 3 Gender and age in the cohort of stroke patients in this analysis.
Gender effect on compliance
There was no significant gender difference in percentage compliance (mean difference −1.5 [95%CI −5.4 to 2.3, P > 0.05]).
Quality of care and 5-year age categories
Percentage compliance was divided at the median value (21.2%) for analysis. There was an inconsistent pattern in the association of poor quality care with the 12 age categories (). A line is superimposed at the level of OR = 1 for ready comparison of the association between poor care and age. In all instances, the 95% CI encompassed an odds ratio of 1, suggesting no strong trend across age categories, for quality of care.
Figure 4 Likelihood of poor compliance occurring in each 5-year age category.
Step 3
Quality of care and 10-year age categories
Testing the broader age categories for an association with poor quality care provided no additional clarity regarding the association between age and quality AH care, as indicated in .
Figure 5 Likelihood of poor compliance occurring in each 10-year age category.
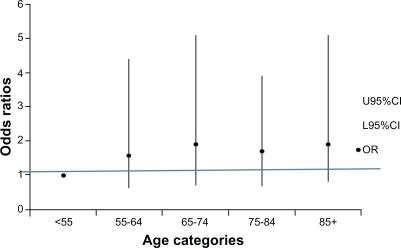
The influence of gender
When gender was added to these age categories in this model, as a potential confounder, it marginally attenuated the likelihood of poor compliance occurring in the 55 to 64-year age group, and marginally strengthened the likelihood in the 85+ age group (). However it did not change the overall pattern of association with care, or the nonsignificance of the overall association between age and quality of care.
Table 2 Odds ratio of poor compliance occurring in 10 year age groupings, adjusted by gender
Given the lack of clear association with age, using any treatment of it, with the index of quality of AH care, it seems reasonable to suggest the use of a cut-off point of 75 years. This approach has been proposed by other researchers in this area.Citation5,Citation9,Citation26 To further test this division at 75 years, we found no significant difference between the compliance of care for younger patients (mean percentage compliance 23%; SD 17) and compliance for older patients (mean 22%; SD 17), P = 0.6.
Discussion
This study provides rare evidence on the influence of the age and gender of acute stroke patients on the quality of care they receive from AH professionals. The sample used for analysis was robustly powered and selected in a manner that minimized bias.
We were unable to determine an optimal age categorization to differentiate process indicator compliance for AH professionals. We therefore recommend that for subsequent analysis, if an age effect is to be investigated, age could be considered in 2 categories (less than 75 years, or 75+ years). Although the use of 75 years as an age divide is arbitrary, it is already common in stroke research, and thus will facilitate benchmarking of results from investigations of AH care, with other measures of medical and nursing care.Citation5,Citation9,Citation10,Citation26
Given the lack of any clear age or gender association with the quality of care found in this sample, it seems appropriate to hypothesize that neither age nor gender on its own, is a predictor of the quality of AH care provided for acute stroke patients. This contrasts with some medical literature that reports evidence of age- and gender-related differences in the quality of care received by these populations.Citation9–Citation12 We hypothesize that the factors influencing the clinical decisions taken by AH professionals, may differ from those influencing medical professionals. This may be due to a number of reasons including differences in training, clinical roles, and priorities, and the nature of the evidence that underpins clinical processes for each professional group.
It is possible that age-dependent variables, such as patients’ prestroke independence and stroke severity, are more important predictors of the quality of AH care than either age or gender. More detailed analysis is required to explore the influence of nonage variables on the quality of AH practice, and this will form the next phase of our study. Moreover, the next phase of our research should consider care quality in the 20 individual performance indicators relevant for AH professionals, as it is likely that different processes of care are influenced by different variables.
Conclusion
In our sample, age and gender were not strong predictors of the quality of AH care provided for stroke patients. The most appropriate age division for analysis of process indicator compliance for AH professionals in future studies appears to be 75 years. This finding allows us to compare our research findings with those of other researchers who have investigated the quality of medical care.
Disclosure
The first author undertook this research as part of a PhD candidature which was supported by an Australian Postgraduate Award government scholarship. No other sources of funding were provided.
References
- Australian Institute of Health and WelfareMajor cardio-vascular diseases: strokeAustralian GovernmentCanberra2006
- DeweyHThriftAMihalopoulosCLifetime cost of stroke subtypes in Australia: findings from the North East Melbourne Stroke Incidence Study (NEMESIS)Stroke200334102502250712970517
- DeweyHThriftAMihalopoulosCCost of stroke in Australia from a societal perspective: results from the North East Melbourne Stroke Incidence Study (NEMESIS)Stroke200132102409241611588334
- SaposnikGKapralMKCouttsSBFangJDemchukAMHillMDDo all groups benefit from organized inpatient stroke care?Stroke200940103321332719644068
- Stroke Unit Trialists’ CollaborationOrganised inpatient (stroke unit) care for strokeCochrane Database Syst Rev20074CD00019717943737
- National Stroke FoundationAcute Stroke services Framework, 2008: a Framework to Enable the Delivery and Monitoring of Optimal Acute Stroke Care Across AustraliaMelbourne Australia2008
- CadilhacDMoodieMLalorEBilneyLDonnanGNational Stroke Foundation. Improving access to evidence-based acute stroke services: development and evaluation of a health systems model to address equity of access issuesAust Health Rev200630110911816448383
- SanossianNOvbiageleBPrevention and management of stroke in very elderly patientsLancet Neurol20098111031104119800847
- BhallaAGrieveRTillingKRuddAGWolfeCDBIOMED II European Study of Stroke Care. Older stroke patients in Europe: stroke care and determinants of outcomeAge Ageing200433661862415501838
- RuddAGHoffmanADownCPearsonMLoweDAccess to stroke care in England, Wales and Northern Ireland: the effect of age, gender and weekend admissionAge Ageing200736324725517360793
- FairheadJFRothwellPMUnderinvestigation and undertreatment of carotid disease in elderly patients with transient ischaemic attack and stroke: comparative population based studyBMJ2006333756752552716849366
- HeidrichJHeuschmannPUKolominsky-RabasPRuddAGWolfeCDBIOMED II European Study of Stroke CareVariations in the use of diagnostic procedures after acute stroke in Europe: results from the BIOMED II study of stroke careEur J Neurol200714325526117355544
- McKevittCCoshallCTillingKWolfeCAre there inequalities in the provision of stroke care? Analysis of an inner-city stroke registerStroke200536231532015618440
- PalnumKDPetersenPSørensenHOlder patients with acute stroke in Denmark: quality of care and short-term mortality. A nationwide follow-up studyAge Ageing2008371909517965039
- RothwellPMCoullAJSilverLEPopulation-based study of event-rate, incidence, case fatality, and mortality for all acute vascular events in all arterial territories (Oxford Vascular Study)Lancet200536694991773178316298214
- Di CarloALamassaMPracucciGStroke in the very old: clinical presentation and determinants of 3-month functional outcome: A European perspectiveStroke199930112313231910548664
- SaposnikGBlackSHakimAFangJTuJVKapralMKAge disparities in stroke quality of care and delivery of health servicesStroke2009403328333519696418
- GallSLDonnanGDeweyHMSex differences in presentation, severity, and management of stroke in a population-based studyNeurology2010741297598120181922
- Di CarloALamassaMBaldereschiMPracucciGBasileAMWolfeCDSex differences in the clinical presentation, resource use, and 3-month outcome of acute stroke in Europe: data from a multicentre multinational hospital-based registryStroke2003341114111912690218
- SmithMALisabethLDBrownDLMorgensternLBGender comparisons of diagnostic evaluation for ischemic stroke patientsNeurology200565685585816186523
- GarganoJWWehnerSReevesMSex differences in acute stroke care in a statewide stroke registryStroke200839242918048851
- PalnumKDAndersenGIngemanAKrogBRBartelsPJohnsenSPSex-related differences in quality of care and short-term mortality among patients with acute stroke in Denmark: a nationwide follow-up studyStroke20094041134113919211479
- KapralMKFangJHillMDInvestigators of the Registry of the Canadian Stroke NetworkSex differences in stroke care and outcomes: results from the Registry of the Canadian Stroke NetworkStroke200536480981415731476
- Di CarloALamassaMConsoliDSex differences in presentation, severity, and management of stroke in a population-based studyNeurology201075767067120713959
- Department Health AustraliaNational Men’s and Women’s Health Updated 2008. http://www.health.gov.au/internet/main/publishing.nsf/Content/national%20mens%20health-1. Canberra Australia. Accessed March 30, 2011.
- McNaughtonHMcPhersonKTaylorWWeatherallMRelationship between process and outcome in stroke careStroke200334371371712624296
- LukerJGrimmer-SomersKFactors influencing acute stroke guideline compliance: a peek inside the ‘black box’ for Allied Health staffJ Eval Clin Pract200915238338919335501
- LukerJAWallKBernhardtJEdwardsIGrimmer-SomersKAMeasuring the quality of dysphagia management following stroke: a systematic reviewInt J Stroke20105646647621050403
- National Stroke FoundationClinical Guidelines for Stroke Management 2010Melbourne Australia
- MantJProcess versus outcome indicators in the assessment of quality of health careInt J Qual Health Care200113647548011769750
- South Australian Department of HealthPopulation Health in South Australia: Burden of Disease and Injury Estimates 1999–2001Government of South AustraliaAdelaide Australia2005 http://www.health.sa.gov.au/burdenofdisease/DesktopDefault.aspx. Accessed November 20, 2010.