
Abstract
Purpose
BRAF V600E mutation can compensate for the low detection rate by fine-needle aspiration (FNA) and is related to aggressiveness and lymph node metastasis. This study aimed to investigate the relationship between texture analysis features based on magnetic resonance imaging (MRI) and mutations.
Methods
Retrospective analysis was performed on patients with postoperative pathology confirmed papillary thyroid carcinoma (PTC) from 2017 to 2021. One thousand one hundred and thirty-two texture features were extracted from T2-weighted imaging (T2WI) and contrast-enhanced T1-weighted imaging (CE-T1WI) separately by outlining the tumor volume of interest (VOI). Univariate, minimum redundancy maximum relevance (mRMR), and multivariate analyses were used for feature selection to construct 3 models (T2WI, CE-T1WI, and combined model) to predict mutation. The reproducibility between observers was evaluated by intraclass correlation coefficient (ICC). Receiver operating characteristic (ROC) analysis was used to assess the performance of models. The diagnostic performance of the optimal cut-off value of models were calculated and validated by 10-fold cross-validation.
Results
A total of 80 PTCs (22 BRAF V600E wild-type and 58 BRAF V600E mutant) were included in our study. Good interobserver agreement was found on texture features we selected (all ICCs >0.75). The area under the ROC curves (AUCs) for the T2WI model, CE-T1WI model, and combined model were 0.83 (95% CI: 0.75–0.91), 0.83 (95% CI: 0.73–0.90), and 0.88 (95% CI: 0.81–0.94), respectively. The accuracy, sensitivity, specificity, PPV, and NPV were 0.776, 0.679, 0.905, 0.905, and 0.679 for the T2WI model at a cut-off value of 0.674; 0.755, 0.750, 0.762, 0.808, and 0.696 for the CE-T1WI model at a cut-off value of 0.573; 0.816, 0.893, 0.714, 0.806, and 0.833 for the combined model at a cut-off value of 0.420.
Conclusion
MRI-based texture analysis could be a potential method for predicting BRAF V600E mutation in PTC preoperatively.
Introduction
Papillary thyroid carcinoma (PTC) is the most prevalent primary tumors of thyroid accounting for 89%, and its incidence is rising quickly.Citation1,Citation2 As a highly differentiated thyroid cancer, PTC has a good prognosis and low mortality rate. According to the 2015 American Thyroid Association Management Guidelines, active surveillance for low-risk PTC has become an alternative to surgery.Citation3 However, there are still some high-risk PTC patients with recurrence and metastasis.Citation4,Citation5
BRAF V600E mutation is the most common type of genetic mutation in PTC leading tumor development mainly through activation of the mitogen-activated protein kinase (MAPK) pathway.Citation6,Citation7 Many reports suggest that BRA FV600E mutation denotes a high risk of metastasis and recurrence, and is also associated with the aggressiveness of PTC.Citation8–11 These results suggest that BRAF V600E mutation may contribute to the detection of high-risk PTC.
Tissue biopsy and gene sequencing are the gold standard for BRAF V600E mutation determination. Tissue specimens are obtained through invasive approaches, mainly by FNA in the preoperative period. However, there are certain level of false-positives and false-negatives for detecting the BRAF mutation in FNA samples. The study of Zhao et alCitation12 showed the false-positive and false-negative mutations for BRAF V600E analysis in FNAC specimens were 10.1% (19/189) and 7.1% (7/98), respectively. In addition, FNA is not recommended for patients with small lesions and some patients choose to be observed conservatively. If the BRAF V600E mutation status can be known, the treatment will be adjusted whether to continue monitoring or active treatment.
Ultrasound has been a primary tool in the diagnosis of thyroid lesions.Citation13 Previous studies have extracted morphological features from ultrasound (US) images for preoperative prediction of BRAF V600E mutation.Citation14,Citation15 However, others have argued that ultrasound features are not closely associated with BRAF mutations.Citation16,Citation17 Texture analysis, also known as radiomics, is a technique utilizing high-throughput mining of quantitative image features for precision diagnosis and treatment, providing a powerful tool for modern medicine.Citation18 Several studiesCitation19,Citation20 have built a US-based radiomics model for BRAF V600E mutation prediction in PTC patients, while they found a limited value.
As a non-invasive and radiation-free imaging method, MRI provides both structural and functional images with superior soft tissue contrast, and is of great value in the evaluation of benign and malignant thyroid nodules and the preoperative aggressiveness of PTC.Citation21,Citation22 To our knowledge, there are few studies exploring the relationship between MRI-based texture analysis and BRAF V600E mutation. The purpose of this study was to investigate MRI-based texture features associated with BRAF V600E mutation, construct an MRI-based texture feature model, and evaluate its performance in the preoperative prediction of BRAF V600E mutation.
Materials and Methods
Study Population
The study was conducted in accordance with the Declaration of Helsinki and was approved by the Ethics Committee of Minhang Hospital, Fudan University (ethical review number: 2020-008-01K) and exempted from informed consent because it was a retrospective study. We retrospectively reviewed consecutive patients with pathologically confirmed PTC from August 2017 to December 2021 in our institution.
Inclusion criteria were: (1) patient underwent preoperative thyroid MRI; (2) lesion diameter >5 mm. Exclusion criteria were: (1) detection of BRAVE V600E mutation was not performed; (2) time interval between the MRI examination and subsequent surgery exceeded one month; (3) poor image quality or missing images. The flowchart for patient inclusion is shown in .
Figure 1 Study design and flowchart.
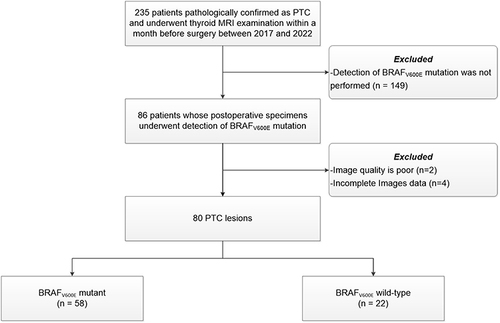
Finally, 80 lesions from 80 patients were enrolled (17 males and 63 females; aged: 43.42 ± 12.83 years; age range: 18–75 years). We divided the lesions into a BRAF V600Emutation (BRAF_MU) group and a BRAF V600E wild-type (BRAF_WT) group.
MRI Acquisition
The MRI examination was conducted on a 1.5T MRI scanner (EXCITE HD; GE Healthcare, Milwaukee, WI, USA) equipped with an 8-channel specialized neck surface coil (Chenguang Medical Technology Ltd, Shanghai, China). The MRI sequences included: 1) axial and coronal fat-suppressed T2-weighted imaging (T2WI); 2) axial T1-weighted imaging (T1WI); 3) axial diffusion weighted imaging (DWI) with single-shot spin-echo echo-planar imaging (SS-SE-EPI) acquisition at b values of 0, 800 or 1000 s/mm2; 4) axial multiphasic contrast-enhanced T1WI (CE-T1WI), gadolinium contrast agent (Magnevist; Bayer Healthcare, Berlin, Germany) was injected with a dose of 0.2 mL/kg and rate of 3 mL/s, followed by 20 mL physiological saline flush immediately. Images from six phases were obtained after injection of the contrast agent at 30s, 60s, 120s, 180s, 240s, and 300s subsequently. Patients were instructed to hold their breath during the acquisition. The detailed parameters of MRI sequences are listed in .
Table 1 Parameters of MRI Sequence
Gene Detection
Thyroid surgery was performed to obtain PTC tumor specimens, and in the case of multiple lesions, the largest lesion specimens were obtained for genetic testing. A commercial kit from AB Diagnostics was used to detect the BRAF mutations. The kit is based on the amplification-resisted mutation system (ARMS) real-time polymerase chain reaction (PCR) technology. Sanger sequencing was used to detect the V600E mutation in the BRAF gene for sequence analysis.
Volume of Interest Segmentation
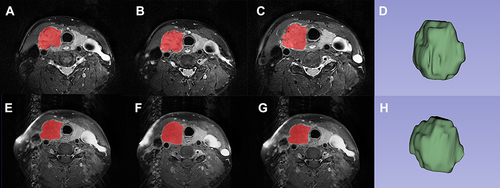
All images were first evaluated by a senior MRI radiologist (chief physician with 8 years of experience in thyroid MRI diagnosis), and the target PTC lesion (match to the lesion undergoing genetic sequencing) was outlined for each patient (for patient with multiple PTC lesions, the largest one was selected). Using the 3D slicer software (version 5.0.2; https://www.slicer.org/), two observers (with 5 years of experience in thyroid MRI diagnosis) manually delineated the volume of interest (VOI) comprising the complete lesion for each patient. In order to prevent partial volume effects, a contour slightly inward to the lesion border was segmented on each slice, and the first and last slices where the lesion was visible were discarded. To assess the interobserver agreement, VOI delineation was performed by the second observer on 30% of randomly selected lesions. Observers were blinded to BRAF V600E mutation status of the patient. displays a representative image of manual segmentation.
Figure 2 Representative example of the placement of volume of interest (VOI) on the papillary thyroid carcinoma (PTC) with BRAF V600E mutation. The red parts on the Axial T2-weighted images (A, B and C) are the PTC lesions segmented at several levels, and (D) is the three dimensional image of VOI; Axial contrast-enhanced T1WI (E, F and G) are the PTC lesions segmented at several levels, and (H) is the three- dimensional image of VOI.
Texture Feature Extraction
From the T2WI and CE-T1WI images, 1132 texture radiomics features including: 1) 14 shape features; 2) 18 first-order features; 3) 22 gray level co-occurrence matrix (GLCM) features; 4) 16 gray level run length matrix (GLRLM) features; 5) 16 gray level size zone matrix (GLSZM) features; 6) 14 gray level dependence matrix (GLDM) features; 7) 344 Laplace of Gaussian (LoG) transformed features; 8) 688 wavelet transformed features were extracted using the PyRadiomics package (http://www.radiomics.io/pyradiomics.html) implemented in Python software (version 3.5.6; https://www.python.org). Detailed information regarding these features can be found in Appendix 1.
Texture Feature Selection and Model Construction
Due to the imbalance in the number of PTC between BRAF_WT and BRAF_MU groups, we adopted the support vector machine based synthetic minority oversampling (SVM-SMOTE) algorithm to balance the dataset. Mann–Whitney U-test, univariate logistic regression, and minimum redundancy maximum relevance (mRMR) algorithms were used to select meaningful texture features between BRAF-MU and BRAF-WT groups. Multivariate logistic regression stepwise forward was performed on the remaining features to construct 3 models, which were T2WI model, CE-T1WI model and combined model, following the AIC (Akaike information criterion). To evaluate the model performance, we conducted receiver operating characteristic (ROC) analysis, and the area under the ROC curve (AUC) was recorded. AUCs between models were compared using Delong test. Diagnostic efficacy including accuracy, sensitivity, specificity, positive predictive value (PPV), and negative predictive value (NPV) were calculated at the optimal cut-off value. In addition, the prediction models were verified with 10-fold cross-validation.
Statistical Analysis
All statistical analyses were performed using SPSS statistical software (version 26.0; IBM Corpor, Armonk, NY, USA) and R software (version 4.2.0; http://www.r-project.org). Continuous variables were expressed as mean ± standard deviation (SD), and categorical variables were expressed as frequency (percentages). Independent sample t-test and chi-square test were used to compare continuous and categorical variables, respectively. Interobserver agreement was assessed using the intraclass correlation coefficient (ICC) with the following criteria: excellent, 0.75–1.00; good, 0.50–0.75; acceptable, 0.25–0.50; and poor, 0–0.25. All P < 0.05 were considered statistically significant.
Results
Patient Characteristics
The clinical characteristics of patients are summarized in . In this study, 58 (72.5%) of the 80 PTC cases were BRAFV 600E mutant and 22 (27.5%) were wild-type. In the BRAF_MU group, there were 11 (19.0%) males and 47 (81.0%) females, with an age of 43.31±11.95. There were 6 (27.3%) males and 16 (72.7%) females, with an age of 43.73 ± 15.22 in the BRAF_WT group. There were no differences in the characteristics of patients between the two groups.
Table 2 Clinical Characteristics of Patients with PTC
Texture Feature Selection and Model Construction
One thousand one hundred and thirty-two texture features were extracted from the T2WI and CE-T1WI images, separately. We removed features with poor consistency (ICC < 0.75), leaving 827 features (ICC: 0.75–0.99) in the T2WI model and 665 features (ICC: 0.75–0.99) in the CE-T1WI model. Features in the combined model were the combination of these features. After the process of univariate logistic regression and mRMR, 6 features were selected in the T2WI model, 7 features were selected in the CE-T1WI model, and 7 features were selected in the combined model. These BRAF V600E mutation-related features were included in the multivariate logistic regression, finally leaving 4 predictors (1 LoG and 3 wavelet features) to construct the T2WI model, 4 predictors (1 LoG and 3 wavelet features) to construct the CE-T1WI model, and 5 (1 first-order, 1 LoG and 3 wavelet features) predictors to construct the combined model. Univariate, mMRM and multivariate analysis results of selected features associated with BRAFV600E mutation are shown in Appendix 2 and .
Table 3 Univariate, mMRM and Multivariate Analysis to Identify Factors Associated with Mutation
Predictive Performance of Three Models
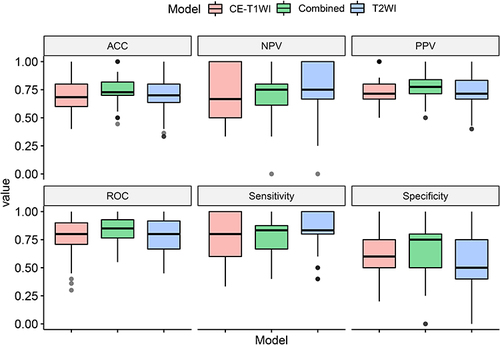
ROC curves of three models are shown in . The AUCs of the T2WI model, CE_T1WI model and combined model were 0.83 (95% CI: 0.75–0.91), 0.83 (95% CI: 0.73–0.90) and 0.88 (95% CI: 0.81–0.94), respectively. The Delong test indicated that there was no difference between AUCs of three models (P = 0.844 for T2WI vs CE-T1WI model; P = 0.282 for T2WI vs combined model; P = 0.201 for CE-T1WI vs combined model). shows the diagnostic performance of three models, and the performance was verified with 10-fold cross-validation ().
Table 4 Diagnostic Performance of the Three Models
Figure 3 The receiver operating characteristic (ROC) curves of the three prediction models.
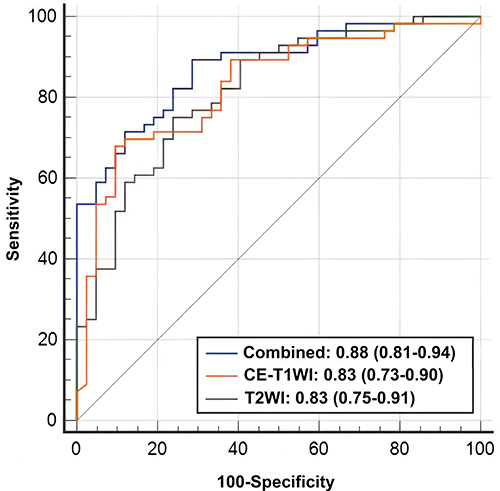
Figure 4 Boxplot of 10-fold cross-validation of the three prediction models.
Discussion
In this study, we explored the value of MRI-based texture feature model for preoperative prediction of BRAF V600E mutation status in PTC patients. Our results demonstrated that T2WI model, CE-T1WI model and combined model all exhibit good performance, with AUCs of 0.83, 0.83 and 0.88, respectively. The accuracy, sensitivity, and NPV of combined model were 0.816, 0.893, and 0.833 at a cut-off value of 0.420, respectively. At a cut-off value of 0.674, the specificity and PPV of T2WI model were both 0.905. MRI-based texture feature model provides a new approach for non-invasive and preoperative identification of BRAFV600E mutation status, helping to diagnose as well as to adjust the treatment strategy.
BRAF V600E mutation leads to abnormal activation of the MAPK pathway. The pathway causes an increase of cell proliferation and resistance to apoptosis, resulting in tumor development.Citation23 The reported probability of BRAF mutations in PTC was 56–87% in various locations, and China was the region with a high BRAF mutation rate (most of which were V600E). The mutation rate in this study was 72.5% (58/80), similar to that in previous reported.Citation24–26 However, the positive detection rate of FNA for thyroid cancer is low, and the risk of nodule malignancy is greatly increased if BRAF V600E mutation is present.Citation27,Citation28 For PTC with BRAF V600E mutation, aggressive surgical treatment is recommended, while BRAF V600E wild-type PTC combined with other clinical indicators can be selected for close follow-up in addition to surgical treatment.Citation3,Citation29 The role of BRAF V600E mutation in benign-malignant discrimination, aggressiveness, prognosis and targeted therapy has been confirmed by various studies.Citation8,Citation30–32 Li et alCitation33 suggested that BRAF V600E mutation test was highly recommended in mutation endemic areas. However, the BRAF V600E mutation status needs to be obtained by puncture biopsy or postoperative pathology, and genetic sequencing is time-consuming and expensive. Therefore, a non-invasive tool for preoperative mutation screening is required.
Previous studies have explored morphological aspects of ultrasound images with BRAF V600E mutation-related features. Kabaker et alCitation14,Citation34 collected 106 PTCs >1 cm in diameter for determining whether specific ultrasound features can reliably predict BRAF V600E mutation. They found that mutation was associated with an aspect ratio >1, blurred borders, hypoechogenicity, micro/macrocalcifications, and absent halo. When more than 3 suspicious ultrasound features were present, the mutation was predicted with a PPV of 82%. Lin et alCitation35 investigated the correlation between contrast-enhanced ultrasound (CEUS) features and BRAF V600Estatus in patients with PTC. Centripetal and no discernible enhancement were found to be predictive for the presence of BRAF V600E mutations, but with low specificity of 35.1% and 40%. These morphological features are subjective in nature and highly operator dependent. As a useful tool for modern medicine, texture analysis utilizes high-throughput mining of quantitative image features for precise diagnosis and therapyCitation18 and can compensate for the shortcomings of image morphology. For US-based texture analysis, all prediction models proposed by Kwon et alCitation19 performed moderately well in predicting the presence of BRAF V600E mutation, with a mean AUC of 0.651. This is also true in the study by Yoon et al,Citation20 who concluded that texture features extracted from US have limited value as non-invasive biomarkers for predicting PTC BRAF V600E mutation status (regardless of size).
While imaging studies of thyroid cancer mainly focused on US and computed tomography (CT) images, MRI offers excellent soft tissue contrast and is widely used in tumor diagnosis because of its non-invasive and non-radiation characteristics. Good diagnostic value of MRI in the diagnosis of benign and malignant thyroid lesion and lymph node metastasis has also been reported.Citation21,Citation22 To our knowledge, this is the first study to apply MRI-based texture analysis to the assessment of BRAF V600E mutations in patients with PTC.
MRI-based radiomics have been shown with great potential in predicting genetic mutations in tumors such as intestinal cancer, craniopharyngioma and melanoma.Citation36–38In the study of Song et al.Citation39 Firstorder_Minimum was associated with tumor aggressiveness, and it was associated with BRAF V600E mutation which imply tumor aggressiveness. In this study, first-order as well as raw texture features provided limited value, while higher-order LoG and wavelet transformed features enhanced the details of the images and were of great significance to this study. Three features, T2WI_wavelet_HHH_gldm_LargeDependenceLowGrayLevelEmphasis (LDLGLE) (OR = 0.23, P < 0.001), CE_T1WI_log_sigma_4_0_mm_3D_glcm_Imc2 (OR = 0.16, P < 0.001) and CE-T1WI_wavelet_HHH_firstorder_Uniformity (OR = 0.37, P = 0.014) are significant in combined model and the first feature (OR = 0.37, P = 0.002) was also important in T2WI model. LDLGLE represent the joint distribution of larger correlations for lower gray values, and Uniformity represents the homogeneity of the tumor which may be related to tumor heterogeneity. CE-T1WI_log_sigma_4_0_mm_3D_glcm_Imc2represents the relevance information metric of the GLCM.
This study had several limitations. Firstly, as a retrospective observational study, selection bias was inevitable. Secondly, the sample size of our study was relatively small, and although a 10-fold cross-validation was used, overfitting might still be unavoidable. Further validation groups and external validation groups will be collected in the future to validate. Finally, this study did not cover thyroid lesions smaller than 5mm. The detection of microscopic cancers may be improved by future developments in MR technology. For patients with multiple PTC, we selected only the largest lesions. More comprehensive studies that include multiple lesions of different sizes are needed.
In conclusion, the texture model based on extracted features from MRI images has good predictive value for BRAF V600E mutations in PTC. It may provide a good reference for preoperative decision-making.
Disclosure
The authors report no conflicts of interest in this work.
Acknowledgments
This work was supported by the Nature Science Foundation of Shanghai (grant number: 19ZR1446200), Science and Technology Commission of Minhang District, Shanghai (grant number: 2020MHZ034) and Shanghai Municipal Health Commission (grant number: 202140325). Tingting Zheng and Wenjuan Hu are co-first authors for this study. Jingjing Xu and Bin Song are co-correspondence authors for this study.
References
- Megwalu UC, Moon PK. Thyroid cancer incidence and mortality trends in the United States: 2000–2018. Thyroid. 2022;32(5):560–570.
- Miller KD, Nogueira L, Devasia T, et al. Cancer treatment and survivorship statistics, 2022. CA Cancer J Clin. 2022;72(5):409–436. doi:10.3322/caac.21731
- Haugen BR, Alexander EK, Bible KC, et al. 2015 American Thyroid Association management guidelines for adult patients with thyroid nodules and differentiated thyroid cancer: the American Thyroid Association guidelines task force on thyroid nodules and differentiated thyroid cancer. Thyroid. 2016;26(1):1–133. doi:10.1089/thy.2015.0020
- Ito Y, Kudo T, Kobayashi K, Miya A, Ichihara K, Miyauchi A. Prognostic factors for recurrence of papillary thyroid carcinoma in the lymph nodes, lung, and bone: analysis of 5768 patients with average 10-year follow-up. World J Surg. 2012;36(6):1274–1278. doi:10.1007/s00268-012-1423-5
- Popadich A, Levin O, Lee JC, et al. A multicenter cohort study of total thyroidectomy and routine central lymph node dissection for cN0 papillary thyroid cancer. Surgery. 2011;150(6):1048–1057. doi:10.1016/j.surg.2011.09.003
- Kwak JY, Kim EK, Chung WY, Moon HJ, Kim MJ, Choi JR. Association of BRAFV600E mutation with poor clinical prognostic factors and US features in Korean patients with papillary thyroid microcarcinoma. Radiology. 2009;253(3):854–860. doi:10.1148/radiol.2533090471
- Xing M. BRAF mutation in papillary thyroid cancer: pathogenic role, molecular bases, and clinical implications. Endocr Rev. 2007;28(7):742–762. doi:10.1210/er.2007-0007
- Chen Z, Wang W, Xu J, et al. Tumor mutation burden-assisted risk stratification for papillary thyroid cancer. Endocrine. 2022;78(2):296–305. doi:10.1007/s12020-022-03154-0
- Kurtulmus N, Ertas B, Saglican Y, Kaya H, Ince U, Duren M. BRAF(V600E) mutation: has it a role in cervical lymph node metastasis of papillary thyroid cancer? Eur Thyroid J. 2016;5(3):195–200. doi:10.1159/000448112
- Subash A, Sinha P, Singh A. BRAF mutation and age in differentiated thyroid cancer risk stratification: two sides of the same coin. Oral Oncol. 2020;106:104732. doi:10.1016/j.oraloncology.2020.104732
- Yan C, Huang M, Li X, Wang T, Ling R. Relationship between BRAF V600E and clinical features in papillary thyroid carcinoma. Endocr Connect. 2019;8(7):988–996. doi:10.1530/EC-19-0246
- Zhao CK, Zheng JY, Sun LP, Xu RY, Wei Q, Xu HX. BRAF(V600E) mutation analysis in fine-needle aspiration cytology specimens for diagnosis of thyroid nodules: the influence of false-positive and false-negative results. Cancer Med. 2019;8(12):5577–5589. doi:10.1002/cam4.2478
- Tessler FN, Middleton WD, Grant EG, et al. ACR Thyroid Imaging, Reporting and Data System (TI-RADS): white paper of the ACR TI-RADS committee. J Am Coll Radiol. 2017;14(5):587–595. doi:10.1016/j.jacr.2017.01.046
- Liu Y, He L, Yin G, et al. Association analysis and the clinical significance of BRAF gene mutations and ultrasound features in papillary thyroid carcinoma. Oncol Lett. 2019;18(3):2995–3002. doi:10.3892/ol.2019.10641
- Xu JM, Chen YJ, Dang YY, Chen M. Association between preoperative US, elastography features and prognostic factors of papillary thyroid cancer with BRAF(V600E) Mutation. Front Endocrinol. 2019;10:902. doi:10.3389/fendo.2019.00902
- Hwang J, Shin JH, Han BK, et al. Papillary thyroid carcinoma with BRAFV600E mutation: sonographic prediction. AJR Am J Roentgenol. 2010;194(5):W425–W430. doi:10.2214/AJR.09.3512
- Li Q, Yuan J, Wang Y, Zhai Y. Association between the BRAF V600E mutation and ultrasound features of the thyroid in thyroid papillary carcinoma. Oncol Lett. 2017;14(2):1439–1444. doi:10.3892/ol.2017.6276
- Lambin P, Leijenaar RTH, Deist TM, et al. Radiomics: the bridge between medical imaging and personalized medicine. Nat Rev Clin Oncol. 2017;14(12):749–762. doi:10.1038/nrclinonc.2017.141
- Kwon MR, Shin JH, Park H, Cho H, Hahn SY, Park KW. Radiomics study of thyroid ultrasound for predicting BRAF mutation in papillary thyroid carcinoma: preliminary results. Am J Neuroradiol. 2020;41(4):700–705. doi:10.3174/ajnr.A6505
- Yoon JH, Han K, Lee E, et al. Radiomics in predicting mutation status for thyroid cancer: a preliminary study using radiomics features for predicting BRAFV600E mutations in papillary thyroid carcinoma. PLoS One. 2020;15(2):e0228968. doi:10.1371/journal.pone.0228968
- Wang H, Liu K, Ren J, Liu W, Chen Y, Song B. Magnetic resonance imaging characteristics of papillary thyroid carcinoma for the prediction of cervical central compartment lymph node metastasis. J Comput Assist Tomogr. 2019;43(6):963–969. doi:10.1097/RCT.0000000000000883
- Wang H, Wei R, Liu W, Chen Y, Song B. Diagnostic efficacy of multiple MRI parameters in differentiating benign vs. malignant thyroid nodules. BMC Med Imaging. 2018;18(1):50. doi:10.1186/s12880-018-0294-0
- Xing M, Haugen BR, Schlumberger M. Progress in molecular-based management of differentiated thyroid cancer. Lancet. 2013;381(9871):1058–1069. doi:10.1016/S0140-6736(13)60109-9
- Goh X, Lum J, Yang SP, et al. BRAF mutation in papillary thyroid cancer-prevalence and clinical correlation in a South-East Asian cohort. Clin Otolaryngol. 2019;44(2):114–123. doi:10.1111/coa.13238
- Li XJ, Mao XD, Chen GF, et al. High BRAFV600E mutation frequency in Chinese patients with papillary thyroid carcinoma increases diagnostic efficacy in cytologically indeterminate thyroid nodules. Medicine. 2019;98(28):e16343. doi:10.1097/MD.0000000000016343
- Pessoa-Pereira D, Medeiros M, Lima VMS, et al. Association between BRAF (V600E) mutation and clinicopathological features of papillary thyroid carcinoma: a Brazilian single-centre case series. Arch Endocrinol Metab. 2019;63(2):97–106. doi:10.20945/2359-3997000000120
- Johnson SJ, Hardy SA, Roberts C, Bourn D, Mallick U, Perros P. Pilot of BRAF mutation analysis in indeterminate, suspicious and malignant thyroid FNA cytology. Cytopathology. 2014;25(3):146–154. doi:10.1111/cyt.12125
- Rossi ED, Adeniran AJ, Faquin WC. Pitfalls in thyroid cytopathology. Surg Pathol Clin. 2019;12(4):865–881. doi:10.1016/j.path.2019.08.001
- Patel KN, Yip L, Lubitz CC, et al. The American association of endocrine surgeons guidelines for the definitive surgical management of thyroid disease in adults. Ann Surg. 2020;271(3):e21–e93. doi:10.1097/SLA.0000000000003580
- Arora C, Kaur D, Naorem LD, Raghava GPS, Murugan AK. Prognostic biomarkers for predicting papillary thyroid carcinoma patients at high risk using nine genes of apoptotic pathway. PLoS One. 2021;16(11):e0259534. doi:10.1371/journal.pone.0259534
- Cabanillas ME, Ryder M, Jimenez C. Targeted therapy for advanced thyroid cancer: kinase inhibitors and beyond. Endocr Rev. 2019;40(6):1573–1604. doi:10.1210/er.2019-00007
- Zarkesh M, Zadeh-Vakili A, Akbarzadeh M, et al. BRAF V600E mutation and microRNAs are helpful in distinguishing papillary thyroid malignant lesions: tissues and fine needle aspiration cytology cases. Life Sci. 2019;223:166–173. doi:10.1016/j.lfs.2019.03.034
- Li X, Li E, Du J, Wang J, Zheng B. BRAF mutation analysis by ARMS-PCR refines thyroid nodule management. Clin Endocrinol. 2019;91(6):834–841. doi:10.1111/cen.14079
- Kabaker AS, Tublin ME, Nikiforov YE, et al. Suspicious ultrasound characteristics predict BRAF V600E-positive papillary thyroid carcinoma. Thyroid. 2012;22(6):585–589. doi:10.1089/thy.2011.0274
- Lin ZM, Yan CX, Song Y, et al. The features of contrast enhanced ultrasound and BRAF V600E in papillary thyroid carcinoma. J Thorac Dis. 2019;11(12):5071–5078. doi:10.21037/jtd.2019.11.78
- Shofty B, Artzi M, Shtrozberg S, et al. Virtual biopsy using MRI radiomics for prediction of BRAF status in melanoma brain metastasis. Sci Rep. 2020;10(1):6623. doi:10.1038/s41598-020-63821-y
- Wan L, Peng W, Zou S, et al. Predicting perineural invasion using histogram analysis of zoomed EPI diffusion-weighted imaging in rectal cancer. Abdom Radiol. 2022;47(10):3353–3363. doi:10.1007/s00261-022-03579-1
- Yue Q, Yu Y, Shi Z, et al. Prediction of BRAF mutation status of craniopharyngioma using magnetic resonance imaging features. J Neurosurg. 2018;129(1):27–34. doi:10.3171/2017.4.JNS163113
- Song F, Song L, Xing T, et al. A multi-classification model for predicting the invasiveness of lung adenocarcinoma presenting as pure ground-glass nodules. Front Oncol. 2022;12:800811. doi:10.3389/fonc.2022.800811