
Abstract
Background
Whether machine learning (ML) can assist in the diagnosis of Crohn’s disease (CD) and intestinal tuberculosis (ITB) remains to be explored.
Methods
We collected clinical data from 241 patients, and 51 parameters were included. Six ML methods were tested, including logistic regression, decision tree, k-nearest neighbor, multinomial NB, multilayer perceptron, and XGBoost. SHAP and LIME were subsequently introduced as interpretability methods. The ML model was tested in a real-world clinical practice and compared with a multidisciplinary team (MDT) meeting.
Results
XGBoost displays the best performance among the six ML models. The diagnostic AUROC and the accuracy of XGBoost were 0.946 and 0.884, respectively. The top three clinical features affecting our ML model’s result prediction were T-spot, pulmonary tuberculosis, and onset age. The ML model’s accuracy, sensitivity, and specificity in clinical practice were 0.860, 0.833, and 0.871, respectively. The agreement rate and kappa coefficient of the ML and MDT methods were 90.7% and 0.780, respectively (P<0.001).
Conclusion
We developed an ML model based on XGBoost. The ML model could provide effective and efficient differential diagnoses of ITB and CD with diagnostic bases. The ML model performs well in real-world clinical practice, and the agreement between the ML model and MDT is strong.
Graphical Abstract
Introduction
Inflammatory bowel disease (IBD) is a chronic inflammation of the gastrointestinal tract. Ulcerative colitis (UC) and Crohn’s disease (CD) are the principal forms of IBD. IBD is a global disease. In 2020, newly industrialized countries were at a stage where the incidence increased, and the prevalence was relatively low. The incidence of this disease is stable in Western countries, but its prevalence is rapidly increasing.Citation1 Intestinal tuberculosis (ITB) is also a chronic inflammatory gastrointestinal disease caused by mycobacterium tuberculosis. Tuberculosis is the second leading cause of death caused by an infectious disease after COVID-19, contributing to 1.5 million deaths in 2020. Intestinal tuberculosis is one of the most common forms of extrapulmonary tuberculosis.Citation2 The global burden of CD and ITB will continue to increase in future decades.
CD is a complex chronic inflammatory gastrointestinal condition with variable clinical manifestations. ITB shares many clinical features with CD. Distinguishing these two diseases can be complicated. IBD diagnosis is especially difficult at hospitals lacking medical resources and staff. This situation is even worse in some developing and newly industrialized countries.
Multidisciplinary team (MDT) meetings play an established role in managing multiple chronic diseases, including IBD and ITB. Most MDT encounters were successful from both a process and a clinical outcome perspective.Citation3 The Inflammatory Bowel Disease Group of the Chinese Gastroenterology Society strongly recommends MDT meetings, especially for patients whose diagnosis is difficult.Citation4 However, MDT meetings usually depend on experienced doctors and advanced medical equipment.
In recent years, machine learning (ML) technology has shown promising applications in gastroenterology. Based on clinical data, ML methods were able to predict upper gastrointestinal bleeding and gastric cancer risk in patients after Helicobacter pylori eradication.Citation5,Citation6 ML models outperform traditional statistical models that use routinely available clinical data for risk prediction in patients with IBD.Citation7 Waljee AK et al developed an ML model to identify patients with Crohn’s disease likely to respond durably to ustekinumab.Citation8 The ML model could substantially improve the ability to predict IBD-related hospitalization and outpatient steroid use.Citation9 However, there are still limitations in the current literature. First, few studies have investigated the differentiation of CD and ITB. Second, few studies have evaluated the performance of ML models in real-world clinical practice.
In this study, we first developed an ML model to assist in diagnosing of CD and ITB. The performance was subsequently compared with that of MDTs in real-world clinical practice.
Materials and Methods
Study Design
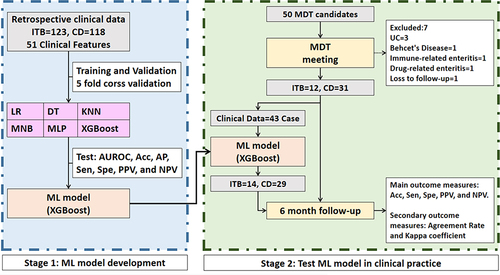
This study was divided into two stages. Stage 1: ML model development. Using six different ML methods, a training model is trained for CD and ITB differential diagnoses based on retrospective clinical data. Stage 2: Test the ML model in real-world clinical practice. After the MDT meeting, the MDT candidates were diagnosed with ITB or CD by the MDT group. The clinical data of these patients were entered into the ML model developed in stage 1, and the diagnostic results were output accordingly. After six months of follow-up, considering the effect after treatment, the final diagnosis was confirmed. The performance of the ML model was recorded, analyzed, and compared with that of the MDT model. shows the flow chart.
Figure 1 Study flow chart.
This study was conducted in the Gastroenterology Department of the Third Xiangya Hospital of Central South University. This research was conducted in accordance with the Declaration of Helsinki and national and institutional standards. The clinical research ethics committee of the Third Xiangya Hospital of Central South University (No.22272) approved the study protocol. Informed consent was obtained from all the MDT candidates. The study is complete and is registered at http://www.chictr.org.cn (ChiCTR2200066847).
Data Collection and Dataset Establishment
In the stage of ML model development, clinical data were collected from Jan 2013 to Jun 2021. The diagnosis was based on clinical performance, endoscopic and pathological characteristics, as well as the response to Crohn’s disease treatment and anti-tuberculosis therapy. All cases were confirmed based on the Chinese consensus and British guidelines for IBD by two experienced gastroenterologists.Citation10,Citation11 For ML model development, we collected 51 parameters from 123 patients with ITB and 118 patients with CD, including four demographic data points, six symptoms, 20 laboratory results, one comorbidity, two complications, 12 endoscopic characteristics and six pathological characteristics. The variables included were widely available in the diagnosis of ITB and CD. The included endoscopic and pathological characteristics were based on European consensus.Citation12,Citation13 The descriptive statistics of the clinical ML data are shown in .
Table 1 Descriptive Statistics for Machine Learning
Study Population and Sample Estimation
In stage 2, the research hypothesis is that the ML model’s area under the receiver operating characteristic curve (AUROC) is greater than 0.5 for MDT candidates. The AUC of the ML model for patients who were difficult to diagnose was 0.78 in the previous experiment, with alpha=0.05 (one-sided) and beta=0.1. Based on the relevant studies at home and abroad, the ratio between the ITB and CD groups was 1:2–1:4.Citation14,Citation15 A review of the historical records of MDT patients in our hospital revealed that the ratio of ITB to CD patients was approximately 1:3. Therefore, in this study, the ratio between the ITB and CD groups was 1:3. The sample size of this study was calculated via PASS11. The number of samples was estimated to be at least 11 ITB patients and 31 CD patients.
Fifty MDT candidates were ultimately included in the study from Sep 2021 to Oct 2022. After the MDT meeting, seven patients with other diseases were excluded, and 43 patients who were diagnosed with ITB or CD by the MDT group were included. The inclusion and exclusion criteria are as follows:
The inclusion criteria were: 1. Patients highly suspected of having CD or ITB; 2. Clinical data were complete, and the MDT was completed; 3. Post follow-up, the final diagnosis was CD or ITB.
Exclusion criteria: 1. Patients with confirmed CD or ITB who do not need an MDT; 2. Other diseases were confirmed after the MDT.
ML Method
In the ML model development stage, we tested six different mainstream ML methods, including logistic regression (LR), decision tree (DT), K-nearest neighbor (KNN), multinomialNB (MNB), multilayer perceptron (MLP), and XGBoost. LR is a process of modeling the probability of a discrete outcome given an input variable. DT learning is a predictive algorithm that uses both categorical and numerical data to assign samples to specific classes.Citation16 KNN is a non-parametric approach; for an input x, KNN identifies k objects in the training data closest to x with a predefined metric and makes a prediction by majority vote from the classes of the k objects.Citation17 MNB is a probabilistic algorithm that is commonly used to categorize text. An MLP is a feed-forward artificial neural network model that maps sets of input data onto a set of appropriate outputs. XGBoost implements ML algorithms under the gradient boosting framework; it provides parallel tree boosting that quickly and accurately solves many data science problems.Citation18
Missing data is a common problem that has a greater impact on data analysis. The multiple imputation method Miceforest is a non-parametric imputation method that can cope with different types of variables simultaneously and is widely used in medical data analysis.Citation19,Citation20 Therefore, this study uses Miceforest to input the missing data. All relevant ML methods and codes can be freely accessed at https://github.com/philiplaw1984/IBD/.
Interpretability for ML
Understanding why an AI model makes a certain prediction is important for doctors when making clinical decision. This study introduces the SHapley Additive exPlanations (SHAP) method and the Local Interpretable Model-agnostic Explanations (LIME) method to explain our ML model. SHAP is a method to explain individual predictions, and it is based on the game’s theoretically optimal Shapley values. LIME explains a prediction of an ML model (classification or regression) for a query point by finding important predictors and fitting a simple interpretable model.
MDT Group
A senior professor of Gastroenterology led the MDT group. Other members include an associate professor of Gastroenterology, a professor of gastrointestinal surgery, a professor of radiology, an associate professor of pathology, a senior IBD specialist nurse, and a coordinator in charge of management.
Experimental Settings and Evaluation Values
All the ML experiments in this study were performed on a personal computer (Windows 10). The experiments were performed in Python 3.8 via PyCharm and Jupyter Notebook Integrated Development Environment.
In stage 1, the evaluation values of the ML methods were AUROC, accuracy, average precision (AP), sensitivity, specificity, positive predictive value (PPV), and negative predictive value (NPV). The dataset used for ML model development was divided into a training set, a validation set, and a test set at a ratio of 6:2:2. A five-fold cross-validation method was adopted.
In stage 2, the primary outcome measures were accuracy, sensitivity, specificity, PPV, and NPV. The secondary outcome measures were the agreement rate and the kappa coefficient.
Statistical Analysis
Statistical analyses were performed via SPSS version 22.0 (IBM SPSS Statistics, IBM Corporation, Armonk, NY, USA). Categorical variables were described by frequencies and proportions (%), and continuous variables were described by means and standard deviations (SDs) unless otherwise stated. Continuous variables were compared via Student’s t test or one-way analysis of variance, and categorical variables were compared using the χ2 test. Non-normal data or data without variance homogeneity were analyzed using non-parametric tests (Mann–Whitney test). A two-tailed P value < 0.05 was considered statistically significant.
Results
ML Method Assists in the Diagnosis of ITB and CD Based on Clinical Data
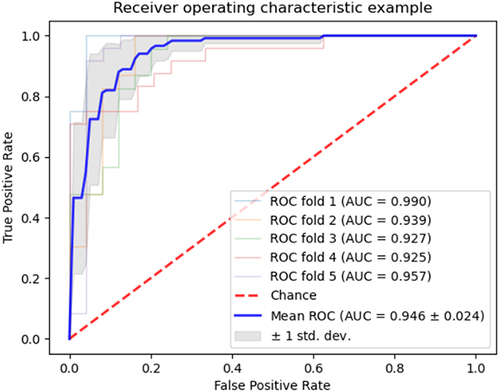
XGBoost performs the best among the six ML models. The diagnostic AUROC, accuracy, AP, sensitivity, specificity, PPV, and NPV of XGBoost were 0.946, 0.884, 0.834, 0.889, 0.878, 0.877, and 0.899, respectively. shows the average AUROC of the XGBoost method after 5-fold cross-validation. The performance of all six ML classification methods is shown in .
Table 2 Performance of All 6 ML Classification Methods
Figure 2 The average AUROC of the XGBoost method after 5-fold cross validation.
Interpretability for ML
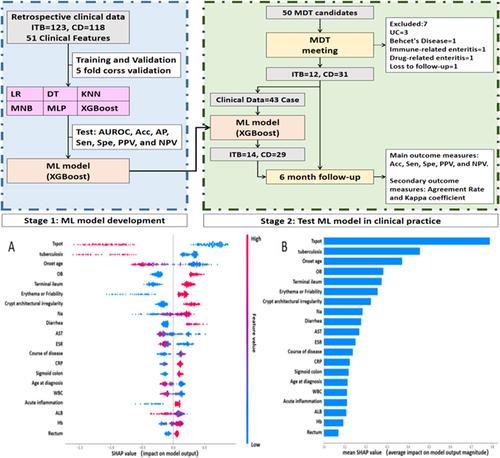
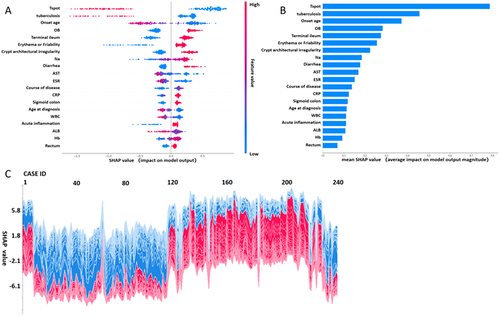
In this study, we introduce the SHAP and LIME methods to explain our ML models. shows how the SHAP method explains our ML models. As shown in , each point represents a case. ITB and CD were coded as 0 and 1, respectively in our ML experiment. A different color represents a different value of the clinical data; red indicates higher values for continuous variables, whereas blue indicates lower values. For categorical variables, red represents positive variables, and blue represents negative variables. The horizontal coordinate represents each clinical data of every case corresponding to a SHAP value. The ML model calculates all variables’ SHAP values together. In the output phase, a high SHAP value indicates that the prediction probability of CD increases. Instead, a low SHAP value indicates that the prediction probability of ITB would increase. shows the weights of all the clinical data included in the ML model. The top 5 variables that may affect result prediction in our ML model were T-spot, pulmonary tuberculosis, onset age, OB, and terminal ileum affected. is a screenshot from a global explain program based on SHAP, which can display every individual case’s predicted result and its corresponding SHAP value.
Figure 3 SHAP method to explain our ML models.
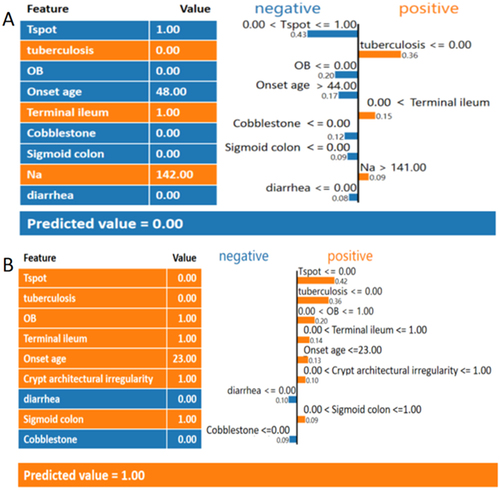
However, the SHAP method could explain how the ML model predicts every patient’s result. To better understand how our ML model works, we introduce another method of visualization and explanation called LIME. The LIME method calculates the predicted value according to the feature value and weight. shows two examples of how the LIME method predicts results. shows an ITB patient’s prediction, and shows a CD patient’s prediction. Clinical features in orange indicate that the prediction is prone to CD, and clinical features in blue indicate that the prediction is prone to ITB.
Figure 4 LIME method to explain our ML models.
ML Model in Real-World Clinical Practice
Forty-three patients were diagnosed with ITB or CD by the MDT group. The clinical data of these patients were input into the ML model. The output diagnoses were 14 ITB and 29 CD cases. The descriptive statistics of the clinical data for ML are shown in Supplementary file 1. The individual prediction results of the ML model are shown in Supplementary file 2.
After a six-month follow-up, the final diagnoses were 12 ITBs and 31 CDs. The accuracy, sensitivity, specificity, PPV, and NPV were 0.860, 0.833, 0.871, 0.714, and 0.931, respectively.
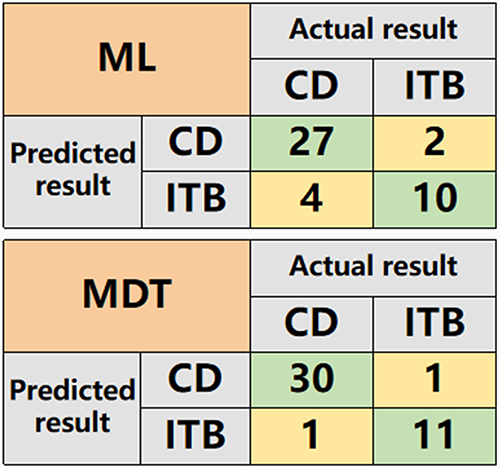
The accuracy, sensitivity, specificity, PPV, and NPV of the MDT group were 0.953%, 0.917, 0.968, 0.917, and 0.968, respectively. The results of the ML model and MDT are shown in and .
Table 3 Results of the ML Model and MDT in Clinical Practice
Figure 5 Results of the ML model and MDT in clinical practice.
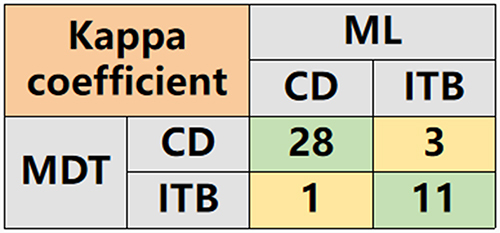
The agreement rate and kappa coefficient of the ML and MDT methods were 90.7% and 0.780, respectively (P<0.001). The confusion matrix used for calculating the kappa coefficient is shown in .
Figure 6 Confusion matrix used for calculating the kappa coefficient.
Discussion
In this study, we developed an AI method to assist in the diagnosis of ITB and CD based on an ML method and a DL method with good performance. The ML explanatory methods SHAP and LIME could help doctors understand how the ML model works. The ML model \ performed well in real-world clinical practice, and the agreement between the ML model and MDT was strong.
XGBoost achieves state-of-The-art results on many ML challenges. In this study, XGBoost outperformed the other prediction models to diagnose ITB and CD. Other studies have confirmed that XGBoost performs excellently in predicting diabetes and cardiovascular disease.Citation21,Citation22 XGBoost is a scalable end-to-end tree boosting system, a novel sparsity-aware algorithm for sparse data, and a weighted quantile sketch for approximate tree learning. In addition, it combines cache access patterns, data compression, and sharding to build a scalable tree-boosting system.Citation18 The diagnostic AUROC of our XGBoost model was 0.946. Another similar study with 160 CD and 40 ITB patients with 32 clinical features reported that the AUROC of the XGBoost model was 0.891Citation14 we speculate that this may be because our study included more ITB patients and clinical features.
ML methods revealed that the top 5 clinical features of the ML model were T-spot, pulmonary tuberculosis, age of disease onset, OB, and Terminal ileum. T-spot-positive and concomitant pulmonary tuberculosis were acknowledged features of a diagnosis of ITB. However, hematochezia is more common in patients with CD.Citation23,Citation24 Although hematochezia is not the key feature, OB positivity is an important feature that suggests CD in our model; this is probably due to the retrospective nature of the study. When patient files are reviewed, missing symptom information is more common than missing laboratory results. A ten-year hospital-based observational study in China revealed that the onset age of CD was 32.0 years, and a study in Western Hungary reported that the onset age of CD was 32.5 years.Citation25,Citation26 The age of onset for patients in our CD and ITB groups was 28.2 and 41.2 years, respectively. This discrepancy may be due to the fact that the number of pediatric and adolescent patients with CD is increasing, and tuberculosis is more common in elderly patients. Thus, age of onset could be an important feature of the ML model. A retrospective study of ITB patients in East China revealed that the rate of terminal ileum affected was 47.1%.Citation27 This result was very close to our findings. In our study, the percentage of terminal ileum affected in the ITB group (40.2%) was lower than that in the CD group (73.7%). Therefore, the terminal ileum affected may be a key variable of the ML model.
This is the first study conducted to evaluate the performance of the ML-based model for differentiating CD and ITB in MDT candidates. The results show that the ML model could differentiate between CD and ITB. However, the performance slightly decreased compared to previous retrospective clinical data; this is largely because MDT candidates are usually difficult to diagnose. An MDT meeting is recommended for patients whose diagnosis is difficult.Citation4 In this study, after the MDT meeting, the accuracy of diagnosis reached 95.3%. Compared with the MDT model, the agreement rates and kappa coefficients of the ML model and MDT model are strongly consistent. Therefore, the model could help doctors differentiate CD and ITB effectively, improve the accuracy of diagnosis, and improve the ability to identify ITB and CD in primary hospitals.
Our study had several limitations. First, in stage 1, the study was limited by its retrospective nature and was a secondary analysis of single-center medical data. Second, in stage 2, the sample size was small. Third, we did not conduct ablation experiments or LASSO regression to extract the variables. Finally, this study did not include all the clinical data, such as CT, double-balloon enteroscopy, and capsule endoscopy results.
Conclusion
In conclusion, in this study, we developed an ML model based on XGBoost. The ML model could provide effective and efficient differential diagnosis of ITB and CD with diagnostic bases. The ML model performed well in real-world clinical practice, and the agreement between the ML model and MDT was strong. The proposed model may greatly reduce the burden on doctors, relieve the suffering of patients, and improve the ability to identify ITB and CD in primary hospitals.
Abbreviations
IBD, Inflammatory bowel disease; UC, Ulcerative colitis; CD, Crohn’s disease; ITB, Intestinal tuberculosis; AI, Artificial intelligence; ML, machine learning; KNN, K nearest neighbor; MLP, Multilayer perceptron; AUROC, Area under the receiver operating characteristic curve; PPV, Positive predictive value; NPV, Negative predictive value; SHAP, SHapley Additive exPlanations; LIME, Local interpretable model-agnostic explanations.
Ethics Approval and Consent to Participate
This study was conducted in the Gastroenterology Department of the Third Xiangya Hospital of Central South University. This research was conducted in accordance with the Declaration of Helsinki and national and institutional standards. The study protocol was approved by the clinical research ethics committee of the Third Xiangya Hospital of Central South University (No.22272). Informed consent was obtained from all the MDT candidates. The study is complete and is registered at http://www.chictr.org.cn (ChiCTR2200066847).
Author Contributions
All authors made a significant contribution to the work reported, whether that is in the conception, study design, execution, acquisition of data, analysis and interpretation, or in all these areas; took part in drafting, revising or critically reviewing the article; gave final approval of the version to be published; have agreed on the journal to which the article has been submitted; and agree to be accountable for all aspects of the work.
Disclosure
The authors declare that they have no competing interests.
Acknowledgment
The authors would like to thank Mr. Ziyi Gao from the Institute of Interdisciplinary Information Science, Tsinghua University, for helpful suggestions.
Data Sharing Statement
All relevant ML methods and codes can be freely accessed at https://github.com/philiplaw1984/IBD/.
Additional information
Funding
References
- Kaplan GG, Windsor JW. The four epidemiological stages in the global evolution of inflammatory bowel disease. Nat Rev Gastroenterol Hepatol. 2021;18(1):56–66. doi:10.1038/s41575-020-00360-x.
- World Health Organization. Global Tuberculosis Report (WHO, 2020).
- Mutaz F, Lim Amanda H, Monowar H, et al. Multidisciplinary team meetings appear to be effective in inflammatory bowel disease management: an audit of process and outcomes. Intern Med J. 2018;48(9):1102–1108. doi:10.1111/imj.13965
- Jie L, Zhou H, Hong Y, et al. The consensus of multi-disciplinary team meeting for Inflammatory bowel disease diagnosis and treatment (Chinese). Chinese J Inflam Bow Dis. 2021;12(4):276–283s.
- Shung DL, Au B, Taylor RA, et al. Validation of a Machine Learning Model That Outperforms Clinical Risk Scoring methods for Upper Gastrointestinal Bleeding. Gastroenterology. Gastroenterology. 2020;158(1):160–167. doi:10.1053/j.gastro.2019.09.009
- Leung WK, Cheung KS, Li B, et al. Applications of machine learning models in the prediction of gastric cancer risk in patients after Helicobacter pylori eradication. Aliment Pharmacol Ther. 2021;53(8):864–872. DOI:10.1111/apt.16272
- Nguyen NH, Picetti D, Dulai PS, et al. Machine Learning-based Prediction Models for Diagnosis and Prognosis in Inflammatory Bowel Diseases: a systematic review. J Crohn's Colitis. Journal of Crohn’s & Colitis. 2022;16(3):398–413. doi:10.1093/ecco-jcc/jjab155
- Waljee Akbar K, Wallace Beth I, Shirley C-M, et al. Development and Validation of Machine Learning Models in Prediction of Remission in Patients with Moderate to Severe Crohn Disease. Vol. 2. JAMA Netw Open; 2019:e193721
- Waljee AK, Lipson R, Wiitala WL, et al. Predicting hospitalization and outpatient corticosteroid use in inflammatory bowel disease patients using machine learning. Inflamm Bowel Dis. 2017;24(1):45–53. doi:10.1093/ibd/izx007
- Inflammatory Bowel Disease Group, Chinese Society of Gastroenterology, Chinese Medical Association. Chinese consensus on diagnosis and treatment in inflammatory bowel disease (2018, Beijing). Chin J Dig. 2018;38(5):292–311.
- Christopher Andrew L, Kennedy Nicholas A, Tim R, et al. British Society of Gastroenterology Consensus Guidelines on the Management of Inflammatory Bowel Disease in Adults. Vol. 68. Gut; 2019:s1–s106
- Vito A, Marco D, Rutter Matthew D, et al. European evidence-based consensus for endoscopy in inflammatory bowel disease. J Crohn's Colitis. 2013;7(12):982–1018. doi:10.1016/j.crohns.2013.09.016
- Magro F, Langner C, Driessen A, et al. European consensus on the histopathology of inflammatory bowel disease. J Crohn's Colitis. 2013;7(10):827–851. doi:10.1016/j.crohns.2013.06.001
- Weng F, Meng Y, Lu F, et al. Differentiation of intestinal tuberculosis and Crohn’s disease through an explainable machine learning method. Sci Rep. Scientific Reports. 2022;12(1):1714. doi:10.1038/s41598-022-05571-7
- M CK, S KH, Y PS, et al. The changes in incidence of Crohn’s disease and intestinal tuberculosis in Korea. Korean J Gastroenterol. 2009;52(6):351–358.
- Bishop CM. Pattern Recognition and ML. In: Information Science and Statistics. New York: Springer. 2006;738.
- Zuo W, Zhang D, Wang K. On kernel difference-weighted k-nearest neighbor classification. Pattern Anal Applic. 2008;11(3–4):247–257. doi:10.1007/s10044-007-0100-z
- Chen T, Guestrin C. XGBoost: A Scalable Tree Boosting System. Proceedings of the 22nd ACM SIGKDD International Conference on Knowledge Discovery and Data Mining; 2016. doi:10.48550/arXiv.1603.02754
- Stekhoven DJ, Bühlmann P. Miss Forest--non-parametric missing value imputation for mixed-type data. Bioinformatics. 28(1):112–118. 10.1093/bioinformatics/btr597.
- Zhao X, Shen W, Wang G. Early Prediction of Sepsis Based on ML Algorithm. Comput Intell Neurosci. 2021;2021:6522633. doi:10.1155/2021/6522633
- Dinh A, Miertschin S, Young A, et al. A data-driven approach to predicting diabetes and cardiovascular disease with machine learning. BMC Med Inform Decis Mak. BMC Medical Informatics and Decision Making. 2019;19(1):211. doi:10.1186/s12911-019-0918-5
- Khera R, Haimovich J, Hurley NC, et al. Use of Machine Learning Models to Predict Death After Acute Myocardial Infarction. JAMA Cardiol. JAMA Cardiology. 2021;6(6):633–641. doi:10.1001/jamacardio.2021.0122
- Yu H, Liu Y, Wang Y, et al. Clinical, endoscopic and histological differentiations between Crohn’s disease and intestinal tuberculosis. Digestion. 2012;85(3):202–209. doi:10.1159/000335431
- Makharia GK, Srivastava S, Das P, et al. Clinical, endoscopic, and histological differentiations between Crohn’s disease and intestinal tuberculosis. Am J Gastroenterol. 2010;105(3):642–651. doi:10.1038/ajg.2009.585
- Lakatos L, Kiss LS, David G, et al. Incidence, disease phenotype at diagnosis, and early disease course in inflammatory bowel diseases in Western Hungary, 2002-2006. Inflamm Bowel Dis. Inflammatory Bowel Diseases. 2011;17(12):2558–2565. doi:10.1002/ibd.21607
- Wang H, Wu Y, Ye C, et al. Perianal disease onset age is associated with distinct disease features and need for intestinal resection in perianal Crohn’s disease: a ten-year hospital-based observational study in China. BMC Gastroenterol. 2021;211:376. 10.1186/s12876-021-01961-9.
- Cheng W, Zhang S, Li Y, et al. Intestinal tuberculosis: clinic-pathological profile and the importance of a high degree of suspicion. Trop. Med Int Health. 2019;24(1):81–90. doi:10.1111/tmi.13169