
Abstract
Purpose
Over the past 24 years, significant advancements have been made in applying artificial intelligence (AI) to musculoskeletal (MSK) diseases. However, there is a lack of analytical and descriptive investigations on the trajectory, essential research directions, current research scenario, pivotal focuses, and future perspectives. This research aims to provide a thorough update on the progress in AI for MSK diseases over the last 24 years.
Methods
Data from the Web of Science database, covering January 1, 2000, to March 1, 2024, was analyzed. Using advanced analytical tools, we conducted comprehensive scientometric and visual analyses.
Results
The findings highlight the predominant influence of the USA, which accounts for 28.53% of the total publications and plays a key role in shaping research in this field. Notable productivity was seen at institutions such as the University of California, San Francisco, Harvard Medical School, and Seoul National University. Valentina Pedoia is identified as the most prolific contributor. Scientific Reports had the highest number of publications in this area. The five most significant diseases are joint diseases, bone fractures, bone tumors, cartilage diseases, and spondylitis.
Conclusion
This comprehensive scientometric assessment benefits both experienced researchers and newcomers, providing quick access to essential information and fostering the development of innovative concepts in this field.
Graphical Abstract
Introduction
Artificial intelligence (AI) originated from John McCarthy’s concept that computers could gradually learn to perform tasks by recognizing patterns, requiring minimal human intervention.Citation1 In modern terms, AI encompasses algorithms that enable machines to solve problems that previously required human intelligence.Citation2 In 1976, Jerrold S. Maxmen predicted the “post-physician epoch” in the 21st century due to AI.Citation3,Citation4 AI has evolved from a theoretical concept to a practical application on an unprecedented scale due to rapid increases in computational power and the exponential growth of large data sets (“Big Data”).Citation1 By analyzing vast data sets in near real-time, AI has deeply integrated into various aspects of society, including autonomous vehicles (Waymo/Apollo), smartphone voice assistants (Siri/Cortana), internet chatbots (ChatGPT/Ernie Bot), and video summarization platforms (YouTube/Bilibili).
AI is an overarching term that includes various subfields, such as machine learning and deep learning.Citation5,Citation6 The goal of AI is to enable machines (computers) to perform specific tasks at levels that can rival or surpass human capabilities. Advances in computing power, data storage, and the availability of high-quality data have driven AI integration into the healthcare industry.Citation7 AI is beginning to tackle specific challenges related to musculoskeletal (MSK) diseases, such as interpreting images, assessing preoperative risks, making medical decisions, and analyzing extensive datasets like “omics” data and human gut microbiome sequencing,Citation8 while accurately categorizing MSK disease risk factors.Citation9
While numerous reviews have explored AI utilization in MSK diseases from various perspectives,Citation8,Citation10–23 these assessments often lack objective visual data. Instead, they heavily rely on researchers’ subjective understanding of the disciplinary framework. Consequently, these evaluations show variability and subjectivity, hindering a comprehensive analysis and the establishment of the current research state. This also poses challenges in identifying research focal points and determining cutting-edge directions. Unlike traditional reviews, this study provides empirical evidence supported by objective visual data, reducing subjective interpretation and variability. This approach enables a more comprehensive analysis and helps establish the current research landscape. Additionally, this study enriches existing literature through in-depth data analysis and visualization using tools like CiteSpace and VOSviewer.
This study aims to explore the following research questions (RQs): RQ1: What are the current trends in AI applications for MSK diseases? RQ2: Which countries, institutions, and researchers are most influential in this field? RQ3: What are the key publications, references, and keywords? RQ4: What are the main related diseases? This study combines quantitative and qualitative measures. Quantitative data include research themes, publication years, languages, journal scope, and details about authors, countries, institutions, journals, and citations. The qualitative evaluation focuses on mapping keywords. By establishing such a systematic and comprehensive knowledge base, researchers from various fields can more easily navigate the domain. Moreover, it serves as a valuable reference for new researchers, guiding them toward compelling research paths. To our knowledge, no prior scientometric investigations have been conducted on this subject.
Materials and Methods
Data Source & Retrieval Strategy
The Web of Science Core Collection (WoSCC) (https://www.webofscience.com/wos/) enables researchers to monitor the evolution of scientific frontiers and analyze trends in academic publications.Citation24–27 WoSCC offers scientometric software for general statisticsCitation26 and has superior accuracy in labeling document types compared to other databases.Citation28 In this study, we conducted a comprehensive online search using WoSCC to explore original research and reviews on AI applications in MSK diseases. The search included articles published from January 1, 2000, to March 1, 2024, using Medical Subject Heading terms and free words for data collection. The retrieval methodology was revised several times by a team of three researchers to enhance sensitivity and precision, as detailed in Supplementary File 1.
Inclusion & Exclusion Standards
Emphasis was placed on English-language studies evaluating AI use in MSK diseases. Dissertations, letters, comments, editorials, conference abstracts, and duplicate research published under the same title in multiple journals were excluded. Team members and peer groups extensively discussed the inclusion and exclusion criteria.
Scientometric Visualization & Data Analysis
All available data were gathered from the WoSCC database and imported into Microsoft Excel (Office 365, Microsoft). The data were then analyzed using VOSviewer 1.6.18 (Leiden University, Netherlands), Citespace version 6.3.R1 (Chaomei Chen, China), Pajek version 5.16 (University of Ljubljana, Slovenia), Scimago Graphica version 1.0.35 (https://www.graphica.app/, USA), and the chorddiag R package (R Studio, version 4.2.0).
To generate visual representations of national or regional collaboration and analyze published works, we used the chorddiag R package with VOSviewer. We conducted co-occurrence analyses involving countries/regions, institutions, authors, journals, research fields, and keywords using VOSviewer, Scimago Graphica, and Pajek. Data on countries/regions, institutions, authors, journals, co-citations, and keywords were visualized and mapped using Citespace. Additionally, the changing popularity of keywords over time was analyzed using Scimago Graphica.
Disease information was gathered from the Citexs Data Analysis Platform (https://www.citexs.com). This tool simplifies the generation of relevant visual charts, enabling a thorough examination of the current situation, key focuses, and future patterns in this field of study.
Results and Discussion
Scientific Output
The method of retrieving and collecting data is illustrated in . The research progress of a study can be indicated by the quantity of scientific reports it produces within a specified period.Citation29 From 2000 to 2024, a cumulative total of 2,716 pertinent scientific reports focusing on “AI-MSK diseases” were assembled. This compilation comprised 2,390 original articles and 326 reviews, yielding an average annual publication rate of 113.2. This highlights the substantial attention and interest directed towards this field. Starting in 2022, the annual tally of relevant publications surpassed 500, reaching its pinnacle at 824 in 2023. The diagram illustrates a dramatic increase of more than 48 times from 2013, indicating a significant surge in research efforts in this domain and underscoring its considerable research significance. The exponential equation (y = 0.6545e0.3443x) accurately captures the annual trend, where x represents the year and y represents the number of publications, with a high R2 value of 0.9828. This demonstrates the precision and meticulousness employed in data analysis, leading to a curve that fits well (). The graph suggests a projected rise in annual research activities, reflecting a growing interest in utilizing AI for MSK diseases. As a result, significant advancements are expected in this field in the upcoming years.
Figure 1 (A) Schematic representation outlining the methodology employed for literature search and selection. (B) Temporal trend analysis depicting the evolution of research focused on “artificial intelligence-musculoskeletal diseases” from 2000 to 2024.
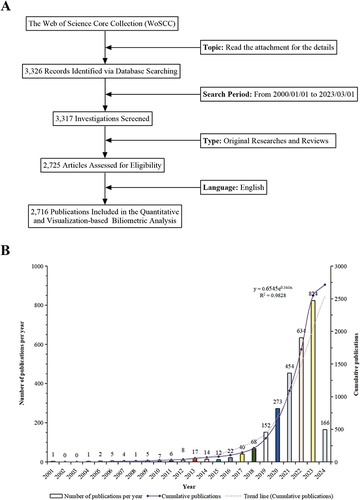
Scientists are increasingly delving into AI solutions for MSK diseases, as indicated by the surge in scientific output. The expansion of research in this area underscores its significance in academia and draws in more investigators. Based on the anticipated rise in yearly studies in this domain, there could be notable progress in treatments or diagnostic instruments for MSK diseases in the foreseeable future. Anticipated growth is expected to attract additional funding, expertise, and attention from diverse stakeholders. Entities in the business sector, such as biotech firms, will show interest in this advancement. Heightened research endeavors might lead to augmented investments and partnerships between academia and industry in AI-driven therapies for MSK diseases due to the substantial uptick in research operations.
Countries/Regions
Globally, research on “AI-MSK diseases” encompasses 80 countries/regions. In and , national collaboration networks are depicted as a tangible representation of the importance of each country or region within the domain, by setting a minimum publication count of ten from each. This offers valuable insights for strategic collaborations and knowledge exchange.Citation30 Particularly noteworthy is the USA’s leadership with 775 publications, comprising 28.53% of the total research output, highlighting its crucial role in advancing knowledge in “AI-MSK diseases”. Subsequently, China and the UK make noteworthy contributions, accounting for 25.37% (689 publications) and 8.73% (237 publications), respectively, in the global research on “AI-MSK diseases”.
Figure 2 (A) Global distribution of research on “artificial intelligence (AI)-musculoskeletal (MSK) diseases”. Each sphere represents a country, with the thickness of connecting lines indicating the level of collaboration between nations. The size of each sphere corresponds to the number of publications from that country. (B) Chord diagrams illustrating international collaborations, where each outer curve represents a country, and the thickness of the lines denotes the strength of collaboration. (C) Research output on “AI-MSK diseases” from the top 10 countries (highlighted in red, indicating increased document production).
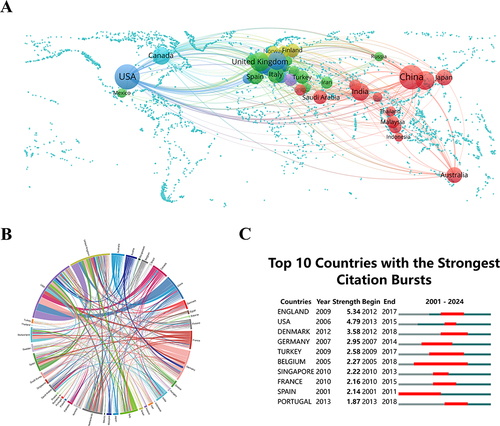
Notably, China, as the sole developing nation among the top three, plays a significant role in the global landscape of “AI-MSK diseases”. With its distinction as the most populous nation and its comparatively centralized healthcare system, China holds abundant data for training and validating AI algorithms. The matter of healthcare equity has attracted considerable focus due to the uneven allocation of resources between urban and rural areas. As a result, the introduction of AI technologies holds promise for revamping China’s healthcare system.Citation6 The swift integration of mobile technology and the expansion of Internet connectivity nationwide are anticipated to streamline the implementation of AI technologies, potentially enhancing the efficiency of patient triage and referral systems.
The peripheral curve segments in the chord diagram visually represent countries and regions. The length of each segment corresponds to the publication volume of the respective country or region.Citation31 Nations’ levels of collaboration are reflected in their levels of connectivity. In terms of global cooperation, the USA shows the most frequent instances, mainly participating in collaborations with the UK (link strength = 73) and China (link strength = 70) (). This information holds immense value for researchers seeking potential collaborators and industry practitioners aiming to stay informed about international collaborations that may impact clinical practices.Citation32
Identifying publications that have experienced substantial increases in citations over a designated time frame is crucial, and this is achieved through the recognition of citation bursts.Citation29 demonstrates the citation spikes for the top 10 countries/regions, illustrated by the intensity of each spike shown by the red line. Remarkable is the substantial increase in publication citations observed in England (strength = 5.34) from 2012 to 2017, closely trailed by the USA (strength = 4.79) and Denmark (strength = 3.58). This information provides researchers with the opportunity to delve into emerging topics, while industry practitioners can harness these insights to foresee and adjust to evolving trends in “AI-MSK diseases”.
Institutions
Valuable insights can be gained by researchers through the identification of leading institutions and the analysis of their citation surges to discover potential partners and sources of funding. The dynamic research environment is highlighted by a complex web of interconnected organizations. Over the past 24 years, there has been notable progress in the global study of “AI-MSK diseases”, involving more than 3,911 different entities. An interconnected network, shown in , was formed among these organizations, with a minimum criteria of nineteen publications for eligibility. In this network, individual institutions are represented by circles with text labels; collaboration instances are depicted by connecting lines. The thickness of the lines indicates the level of collaboration intensity, while line colors signify the overall strength of partnership between an institution and its collaborators. The circles’ sizes correlate with the amount of publications generated by each institution. As the leading contributor, the University of California, San Francisco has contributed around 2.72% (74 papers). Following closely are Harvard Medical School and Seoul National University, with contributions of 1.99% (54 papers) and 1.77% (48 papers) respectively. These institutions have been instrumental in the industry, positioning them as potential collaborators for upcoming research projects. Our assessment of collaboration between institutions highlights Boston University’s evident interest in working with others. It is worth noting that the partnership between Harvard Medical School and Brigham and Women’s Hospital is particularly robust (strength = 12). The active network of collaboration between establishments underscores a vibrant research environment in the area of “AI-MSK diseases”, enabling innovation and the sharing of expertise. This setting offers a fertile ground for the exchange of concepts, resources, and specialized capabilities. Scientists can take advantage of this setting to stay informed about recent progress, utilize communal sources, and improve the overall caliber of their research.
Figure 3 (A) Diagram of institutional cooperation intensity. The thickness of the connecting lines between circles denotes the strength of cooperation between institutions. Additionally, the size of each circle is proportionate to the number of documents issued by the respective institution. (B) Citation bursts at the top 10 institutions (red bars represent burst periods for institutions).
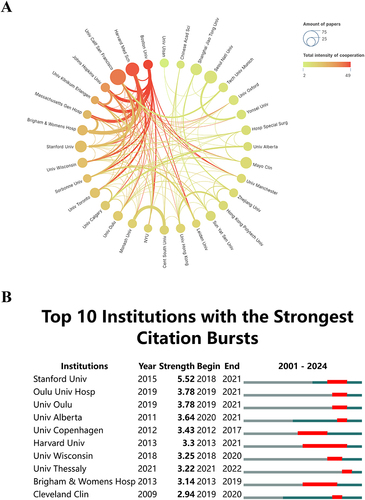
Moreover, identifying establishments undergoing a rise in citations aids scholars in pinpointing those with engaging and impactful research projects, opening up possibilities for partnerships or financial support. When evaluating potential collaborations, it is crucial to consider not just the quantity of research publications, but also the enduring influence and flexibility of research projects over time.Citation31 Through the examination of CiteSpace analysis (), this research pinpointed institutions demonstrating significant increases in citations. Stanford University witnessed citation bursts from 2018 to 2021, with a peak burst strength of 5.52. Harvard University experienced notably prolonged bursts in citations spanning from 2013 to 2021, indicating its sustained robust research capacity, prominent position, and substantial academic influence in this research domain. However, this trend showed a decline in the last three years.
Authors
Identifying leading experts and investigating their joint networks assists in pinpointing key contributors within the discipline. Experts who have exceptional citation rates and a consistent record of publications provide important insights that influence the trajectory of future research. By conducting a thorough analysis of authorship in the field of “AI-MSK diseases”, a total of 14,848 scholars were identified as significant contributors. Among them, eighteen researchers stood out for their prolific work, each authoring at least ten papers. These scholars are likely experts with significant expertise and abilities, making their input crucial for researchers in the “AI-MSK diseases” field. To further explore collaboration patterns, we employed VOSviewer software to produce visual diagrams. These diagrams were generated with a prerequisite of six publications per author. The visual displays show the nodes’ sizes, representing the publication count for each author, with various colors indicating separate author categories. The strength of the links between nodes indicates the degree of collaborative interactions. Remarkably, 71 authors exceeded the publication threshold. Notably, Valentina Pedoia and Sharmila Majumdar displayed the strongest collaborative relationships, as shown in . Additionally, Valentina Pedoia (1.03%, 28 publications), Sharmila Majumdar (0.92%, 25 publications), and Ali Guermazi (0.55%, 15 publications) were identified as prolific scholars in “AI-MSK diseases” research, underscoring their significant contributions to this scientific domain.
Figure 4 (A) Author co-occurrence map. Circles and text labels constitute a node, with different colors representing distinct clusters. (B) Temporal overlay of the author’s collaborative network. Each sphere symbolizes an author, and the combined size of overlapping spheres, representing the sum of their sizes along the yearly ring line, corresponds to the total number of authored articles. Purple-red indicates earlier publications by the author, yellow signifies recent publications, and overlapping colors denote multi-year publishing. Overlapping colors on the spheres create a ring-like pattern. Connections between nodes in temporal zones depict collaborative occurrences among authors. (C) Top 10 authors with the most significant citation bursts in publications related to “artificial intelligence-musculoskeletal diseases”.
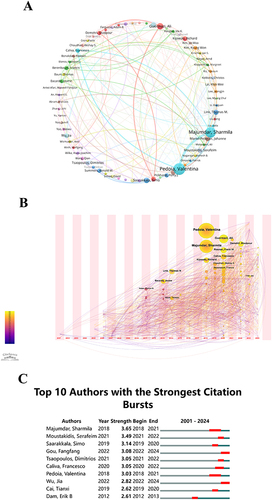
An extensive examination was carried out on various nodes during the same time period. In the diagram, every node represents a specific author, and its size reflects the extent of their literary work. The timeframe illustrated corresponds to when the author first published their work. The color purple is used to show early works, while yellow represents recent ones. When there is an overlap of colors, it suggests that there are multiple publications in the same year. A greater concentration of overlapping colors creates a yearly cycle, showcasing an author’s substantial and consistent output (). Noteworthy are the top three authors, Valentina Pedoia, Sharmila Majumdar, and Ali Guermazi, who display remarkable productivity and a longstanding track record of disseminating their findings. Markus B. Huber had a relatively high publication output in this field in the early stage but did not continue with further in-depth research thereafter.
Studying citation bursts is an important measure that shows how often authors receive citations within a specific field of study during a designated timeframe.Citation33,Citation34 ranks the top ten authors who have garnered the highest number of citations in the “AI-MSK diseases” field. From the figure, it can be observed that during this period, Sharmila Majumdar experienced a citation burst from 2018 to 2021, with the highest burst strength value of 3.65. The citation bursts of the top 10 authors mostly began after 2018, indicating a high level of interest in “AI-MSK diseases” research from 2018 to 2024; among them, the citation burst periods for Sharmila Majumdar, and Valentina Pedoia were the longest, reaching 4 years, indicating that their research results continue to be valued in the “AI-MSK diseases” field, demonstrating long-term academic influence. The foundation laid out by these scholars sets the stage for forthcoming investigations in this area, guaranteeing that future research expands upon the impactful and widely referenced studies already established. These prominent scholars provide critical guidance for individuals delving into this specific area of research. Additionally, their valuable contributions can provide insights for professionals in the field regarding key figures and developing trends, potentially impacting their collaborative efforts and strategic decisions.
Journals & Related Fields
Utilizing a visualization of journal publication data, insights into the scholarly communication landscape are provided through 851 journals featuring articles on AI applications in MSK diseases. A chart based on thermodynamics was developed to establish a minimum requirement of nine papers per journal for illustrating the distribution of documents among various journals. The intensity of colors on the chart indicates the volume of papers published in each journal (), guiding researchers in the selection of appropriate journals for their publications. Leading the rankings with the highest quantity of published documents is Scientific Reports (n = 94), followed by Diagnostics (n = 56) and Sensors (n = 54). The identification of top journals and their citation rates offers valuable information for researchers assessing the impact of their work and choosing potential outlets for publication.
Figure 5 (A) Density visualization map of journal citations. The color intensity correlates directly with the volume of publications. (B) Journal distribution based on the average publication year (blue: earlier, yellow: later). Each circle and its label together create a node, where the circle size directly relates to the frequency of the keyword’s occurrence. The color gradient of each circle in the lower right corner denotes the average year of occurrence. (C) Top 10 journals with the most significant citation bursts. (D) A dual-map overlay of journals related to artificial intelligence in musculoskeletal diseases. Each point in the graph signifies a journal, while the curves bridging the left and right parts of the graph represent citation connections. These trajectories offer insights into interdisciplinary relationships within the field and vividly showcase the inception and progression of citations. (E) Analyses of research subject areas. Various colored spheres symbolize distinct converging fields.
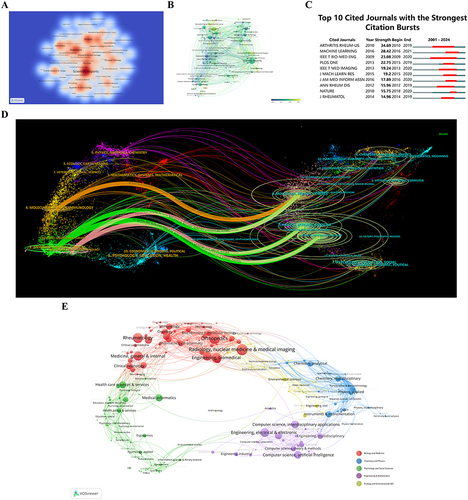
Journals of varying emergence years are depicted with different colors in . Circle size and label frequency indicate occurrence frequency, while circle color signifies the mean publication year. Notably, Osteoarthritis and Cartilage and Computers in Biology and Medicine have been publishing for an extended period. Bioengineering-Basel and Heliyon are emerging journals, highlighted in yellow. Furthermore, the top 10 journals with the most pronounced bursts in citations for research on “AI-MSK diseases” are displayed in .
The overlay of dual-maps in journals offers a valuable method to showcase the changing locations of scientific research centers and the distribution of journals across various fields.Citation35 Map labels show the various study areas encompassed by all publications. Journals cited by other works are situated to the right, whereas those referencing other sources are located on the left. The visual representation of citation pathways is depicted with distinct colored lines originating from the citation map and terminating there. The intensity of these connections is directly linked to the frequency of citations, assessed via a z-score scale.Citation26 This visualization facilitates the identification of emerging trends and shifts in scientific focus, guiding researchers in directing their efforts effectively. illustrates that research on “AI-MSK diseases” predominantly falls within eight primary categories: molecular biology, immunology, clinical medicine, neurology, ophthalmology, genetics, nursing health, and sports rehabilitation.
Utilizing the VOSviewer software, the domain categories of 2,716 articles were visually analyzed, resulting in the categorization of these papers into five primary fields. This classification allows for a deeper understanding of research domains and their interrelations, providing valuable insights for both researchers and industry professionals seeking to navigate the evolving landscape of AI in MSK diseases. The clustering is visualized in , with spheres of various colors representing different domains. The findings indicate that a considerable amount of associated research focuses on the realm of “Biology and Medicine”, with high quantity of articles categorized under “Radiology, nuclear medicine & medical imaging”, “Orthopedics”, and “Rheumatology”.
These findings contribute to advancing knowledge in the field, informing research directions, and guiding decision-making for both academia and industry, ultimately driving innovation and progress in the diagnosis, treatment, and management of MSK diseases through the application of AI.
Co-Cited References
It is crucial for researchers to recognize the significance of identifying the most frequently referenced and impactful publications in order to enhance their understanding and contribute to the progression of their respective fields. The co-citation network diagram, displayed in , illustrates the connections between publications relevant to “AI-MSK diseases” from January 1, 2000, to March 1, 2024, utilizing CiteSpace analysis. The combined sizes of the circles over yearly intervals show their co-citation frequencies. The color spectrum varies from violet, representing earlier citations, to golden, showing recent citations. When colors merge on circles, it signifies consistent citations throughout the designated years. The links between circles symbolize the co-citation connections among various publications. Noteworthy, nodes flooded in pink represent essential nodes in the network, identified by a centrality surpassing 0.1. One of the highly cited works is the original research titled “Automatic Knee Osteoarthritis Diagnosis from Plain Radiographs: A Deep Learning-Based Approach”, authored by Aleksei Tiulpin et al and published in Scientific Reports in 2018, with the highest co-citation count (n = 129).Citation36 Following closely is the 2020 paper “Sarcopenia: revised European consensus on definition and diagnosis” by Alfonso J Cruz-Jentoft et al in Age and Ageing, with 79 co-citations.Citation37 The co-citation network diagram provided in offers insights into the interconnectedness of research literature, highlighting pivotal works and their impact over time. Researchers can leverage this information to explore emerging trends and prioritize areas for further investigation.
Figure 6 (A) Co-citation analysis chart for “artificial intelligence-musculoskeletal diseases”. The sizes of the overlaid circles, corresponding to the sizes of the circles on the annual rings, are proportional to the number of citations. Purple indicates earlier citation times, yellow indicates later citation times, and overlapping colors indicate citations in corresponding years. The lines connecting the circles represent the co-citation situation of the literature, and the nodes marked in magenta are critical nodes with a centrality greater than 0.1. (B) Co-cited literature network map. The sizes of the overlaid circles, corresponding to the sizes of the circles on the annual rings, are proportional to the number of citations. Purple indicates earlier citation times, yellow indicates later citation times, and overlapping colors indicate citations in corresponding years. The lines connecting the circles represent the co-citation situation of the literature, and the nodes marked in magenta are critical nodes with a centrality greater than 0.1. (C) Top 20 references with the highest citation bursts.
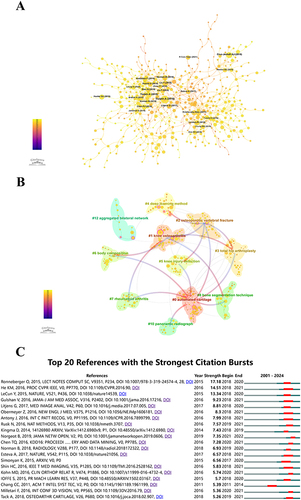
CiteSpace analyzes metrics such as Modularity (Q) and Mean Silhouette (S) to assess network structures and the clustering quality. Substantial clustering is indicated by a Q value above 0.3, while distinct and efficient clustering is denoted by an S value exceeding 0.5. Our analysis yielded Q = 0.9278 and S = 0.9709, confirming the presence of robust and cohesive clustering patterns within the network. This result underscores the reliability of the citation clustering technique employed. The examination revealed 11 unique clusters, labeled as #0 automated cartilage, #1 knee osteoarthritis, #2 osteoporotic vertebral fracture, #3 total hip arthroplasty, #4 deep learning method, #5 knee injury detection, #6 body composition, #7 rheumatoid arthritis, #8 bone segmentation technique, #10 panoramic radiograph, #12 aggregated bilateral network, as illustrated in . This clustering approach facilitates knowledge organization and enhances the understanding of research trends and priorities.
CiteSpace was used to analyze and identify citation bursts in “AI-MSK diseases” research. illustrates the impact of the top 20 references, showing significant scholarly attention.Citation38–55,Citation57,Citation58 The field experienced a significant increase in citations starting in 2016, with numerous co-citation references receiving substantial levels of citations in the subsequent years. This pattern underscores the sustained relevance of research on “AI-MSK diseases”. Notably, in 2018, 55% (11 out of 20) of references encountered citation surges, surpassing the frequencies seen in 2020 and 2019, where 20% (4 out of 20) and 10% (2 out of 20) of references experienced such bursts, respectively. The study that exhibited the most remarkable citation surge (intensity = 17.21) was ‘U-Net: Convolutional Networks for Biomedical Image Segmentation’,Citation38 followed closely by works from Yann LeCun et alCitation39 and Kaiming He et al.Citation40 By recognizing these citation bursts, researchers can gain insights into the evolving landscape of “AI-MSK diseases” research and adapt their research agendas accordingly. Additionally, industry practitioners can utilize these insights to inform decision-making processes, such as investment strategies and product development initiatives, aligning their efforts with emerging research trends and priorities.
Keywords & Related Diseases
Keyword co-occurrence clustering analysis was performed using VOSviewer software, with a minimum keyword occurrence threshold of ten instances. Only keywords that met this criterion were included in the visualization. From a total of 5,590 unique keywords (after eliminating duplicates), 108 keywords were chosen for the visual network. displays a graph illustrating word frequency trends over time, with each circle and label serving as a node. The size of a circle indicates the frequency of the keyword, while the thickness of connections between circles reflects the strength of their associations. The color of each circle, as shown in the lower right corner, changes to indicate the average year of appearance. Blue signifies earlier appearances, whereas yellow denotes later appearances. Analysis of the data presented in shows that “data mining” and “physical activity” were subjects of earlier research, while “ChatGPT” and “immune infiltration” have become recent focal points of study and exploration. By identifying prevalent keywords and their temporal patterns, researchers can better understand the shifting landscape of research interests and prioritize areas for further investigation.
Figure 7 (A) Visualization of keyword intensity overlay over time. Each circle and its label constitute a node, where the circle size corresponds positively to the frequency of keyword occurrence. The color gradient in the lower right corner denotes the average year of occurrence, with blue representing relatively early keywords and yellow indicating recently emerged keywords that may lead to new research directions. (B) Top 10 keywords with the strongest citation bursts identified by CiteSpace. (C) Co-occurrence analysis chart of keyword frequencies. The sizes of the overlaid circles, corresponding to the sizes of the circles on the annual rings, are proportional to the number of citations. Purple indicates earlier citation times, yellow indicates later citation times, and overlapping colors indicate citations in corresponding years. The lines connecting the circles represent the co-citation situation of the literature, and the nodes marked in magenta are critical nodes with a centrality greater than 0.1. (D) Temporal trends in keyword co-occurrence. The sizes of the overlaid circles, corresponding to the sizes of the circles on the annual rings, are proportional to the frequency of keywords. The lines between keywords represent co-occurrence. Purple represents the relatively early appearance time of keywords, yellow represents the later appearance time of keywords, and overlapping colors indicate that keywords appeared in the corresponding years. Magenta nodes are nodes with relatively strong centrality, located at the central position and acting as hubs. Keywords in the same cluster are placed on the same horizontal line. The first appearance time of keywords is placed at the top of the view, with time progressing towards the right.
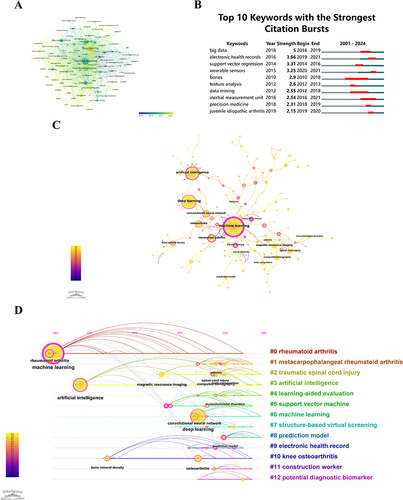
exhibits the detection of keyword bursts, especially those experiencing significant citation surges. This highlights subjects that have attracted considerable scholarly focus. Analyzing the temporal patterns of keyword bursts can inform decisions regarding investment and collaboration, facilitating alignment with prevailing research trends and fostering strategic partnerships. illustrates that the keyword with the strongest citation burst intensity is “big data”, with a burst strength value of 5, occurring between 2016 and 2019; the keyword with the longest duration of citation burst is “bones”, with a sustained surge in citations for 8 years; among the top 10 keywords with citation bursts, the majority emerged after 2014, indicating a high level of interest in “AI-MSK diseases” research between 2014 and 2024.
Analysis of co-occurrence uncovers key connections between keywords, showcasing essential themes in the field. Illustrated in the chart in are the frequencies of keywords co-occurring, examined through CiteSpace to investigate the co-occurrence of “AI-MSK diseases” between January 1, 2000, and March 1, 2024. The cumulative sizes of each year are represented by circles in the chart, highlighting the frequency of keyword usage. Earlier keyword appearances are indicated by purple circles, while yellow circles represent later ones. Mixed colors signify citations that span multiple years. The lines connecting the circles reveal co-citation relationships among sources. Nodes in magenta are used to emphasize significant nodes with centrality scores higher than 0.1. In , “machine learning” stands out as the most frequently co-occurring term, with “deep learning” and “artificial intelligence” ranking second and third, respectively. This analysis enables researchers to discern prevalent topics and concepts, facilitating knowledge synthesis and interdisciplinary collaboration.
Studying the evolving trends and key areas in “AI-MSK diseases” investigation is vital for guiding investment and partnership decisions, ensuring alignment with current research priorities. Displayed in is a timeline depicting keyword frequency clustering within key areas. The graph exhibits circles of varying sizes, with the collective size on each annual band corresponding to the keyword frequency. Links between keywords signify their mutual occurrence. The color palette offers valuable insights: violet denotes earlier keyword occurrences, while yellow indicates recent appearances, and blended hues suggest consistent keyword presence throughout time. Rose-colored nodes highlight keywords with significant centrality, underscoring their pivotal role as network focal points. Keywords within the same cluster are arranged horizontally. The sequential layout positions the initial keyword occurrence at the beginning, advancing to the right in chronological order. This visual depiction aids in grasping keyword distribution within each cluster, where a larger size signifies greater group importance. Additionally, it delineates the temporal extent of keywords within each group. The keywords are categorized into 13 distinct clusters: #0 rheumatoid arthritis, #1 metacarpophalangeal rheumatoid arthritis, #2 traumatic spinal cord injury, #3 artificial intelligence, #4 learning-aided evaluation, #5 support vector machine, #6 machine learning, #7 structure-based virtual screening, #8 prediction model, #9 electronic health record, #10 knee osteoarthritis, #11 construction worker, #12 potential diagnostic biomarker.
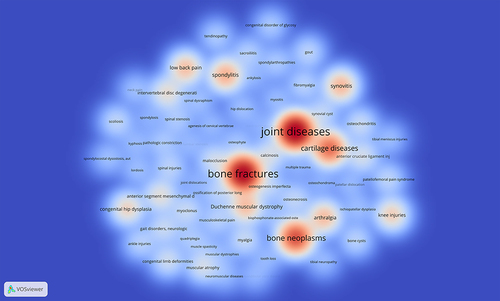
By closely examining diseases related to “AI-MSK diseases”, researchers can concentrate on specific medical conditions. Across 323 articles, the Citexs Data Platform identified 511 diseases, with each disease mentioned in at least six articles to be included in the analysis. The resulting diseases were visualized in a heatmap using VOSviewer, which depicted the frequency and relationships among diseases related to “AI-MSK diseases” research (). Among the most frequently referenced diseases are joint diseases, bone fractures, bone tumors, cartilage diseases, and spondylitis. This focused strategy could accelerate the development of tailored drugs and treatments for these diseases, ultimately improving treatment effectiveness and enhancing patient outcomes.
Figure 8 Density visualization map of associated diseases. The intensity of color is directly proportional to the frequency of occurrence of the represented disease.
Challenges & Future Recommendations
Challenges
As technology advances, many perceive AI applications’ role in MSK diseases as an inevitable evolution. Significant investment and preliminary research have explored optimizing these methods in various clinical and para-clinical fields. However, some argue that the hype surrounding AI exceeds its current practical applications.Citation57 Like other novel technologies in healthcare, where human lives are at stake, efforts must be made to ensure that AI applications recommended for clinical use are supported by evidence-based justifications for adoption, ideally demonstrating outcomes that are at least equivalent (and preferably improved) compared to traditional benchmarks.Citation59,Citation60
Currently, the costs associated with computing hardware are considerably high. In global healthcare systems facing financial constraints, cost-effectiveness often becomes a limiting factor. Many emerging research applications still need verification and validation in wider clinical contexts or replication of results beyond the original institutions.Citation61,Citation62 Clinical care remains centered around human involvement and should not be reduced to merely applying diagnostic or treatment algorithms. Patient well-being goes beyond mere statistical representation.Citation63 Relying solely on computerized processes for clinical decision-making is unreasonable and unethical.Citation16
The effectiveness of an algorithm depends entirely on the quality of its training data. AI relies solely on patient data, linking surgical accuracy to data quality. AI operates within predefined parameters and cannot understand emotions, human cognition, and reasoning needed for precise decision-making. Unlike humans, AI cannot replicate the creative thinking essential for theranostics in MSK diseases, as humans can perceive, contemplate, and make informed decisions. Supervision and data collection during treatment are crucial, and satisfactory results require reliable data.Citation64
Much of modern AI relies on machine learning, especially deep neural networks, which require extensive datasets. This highlights the need for AI developers to access sensitive medical data, raising concerns about patient privacy.Citation8 With widespread issues of hacking and data breaches, ensuring data privacy and security is a major concern in AI for medicine. To address this, new models of health data ownership must be established, empowering individuals with rights over their data, utilizing highly secure data platforms, and enacting government legislation. Without these measures, security Challenges could impede or jeopardize AI progress in medicine.Citation65
Besides privacy concerns, bias in AI is a significant issue. If training data for AI is biased, there is a risk of widespread systematic inaccuracies. For example, much historical medical data in the USA consists of records of white men.Citation66,Citation67 An algorithm trained on this data might produce less precise predictions for females, racial minorities, or other underrepresented groups. This AI bias reflects human judgment, influenced by personal experiences, leading to incorrect clinical judgments. However, widespread implementation of biased AI by healthcare providers could pose greater risks to patient well-being and healthcare quality. While some argue that algorithmic bias is less than human bias, substantial efforts are needed to eliminate embedded prejudice and strive for truly representative medical research.Citation5
Instead of harm from an individual doctor’s mistake, there is significant concern about iatrogenic harm from a machine algorithm.Citation5 This highlights the importance of systematic debugging, auditing, extensive simulation, and validation, along with prospective scrutiny, during AI integration into clinical settings. Additionally, gathering more evidence and rigorous validation is crucial to exceed the recent relaxation of regulatory requirements by the Food and Drug Administration for medical algorithm approval.Citation68 Due to its novelty, AI in medicine lacks universally accepted governance and regulatory frameworks, which need to develop to ensure safe and effective use while protecting patient data and circumstances.Citation60
Training medical professionals is another hurdle in implementing AI for MSK diseases. Physicians must thoroughly understand AI algorithms to effectively integrate them into clinical practice. However, understanding AI algorithms in depth requires access to advanced mathematical tools, which may not be readily accessible to physicians. Therefore, medical training and continuing education should be adjusted.Citation69
Future Recommendations
To meet the escalating demands of MSK diseases, AI must address diagnosis, treatment, and outcome assessment. While AI applications for MSK diseases have mainly focused on diagnostics, there is an urgent need for algorithms to help practitioners identify and intervene in adverse intraoperative outcomes. Although many MSK surgeries currently involve human assistance alongside AI, there is potential to enhance their autonomy. Implementing AI protocols during surgery can help less experienced surgeons perform complex procedures more efficiently and with fewer errors. For example, in bone neoplasms, a device should be able to discern tumor margins, facilitating margin‐negative (R0) resections. Looking ahead, envisioning an AI system capable of conducting patient interviews, diagnosing diseases, performing tests, and delivering results is realistic.
Strengths and Limitations
Compared to previous research relying heavily on meta-analyses or narrative reviews, this study’s use of scientometric tools provided broader insights into research focal areas and trends.Citation70 In the past 24 years, this study is the first to perform a scientometric analysis, delineating and describing “AI-MSK diseases” knowledge landscapes. It provides a thorough and unbiased reference for future progress, despite certain inevitable restrictions.
This study faced several constraints: Firstly, due to CiteSpace’s limitations, publications were solely extracted from WoSCC, leading to inevitable selection bias. Secondly, the citation count, used as a measure of a paper’s impact, is vulnerable to various confounding factors, affecting its accuracy. Thirdly, the large volume of papers may have compromised the study’s credibility by preventing comprehensive analysis of each paper and subfield. Fourthly, as shown by prior scientometric studies, scientometric techniques heavily rely on natural language processing, which may introduce bias.Citation56,Citation70–72 Fifthly, restricting to English texts could lead to publication bias. Lastly, due to incomplete literature collection, newly published literature and certain keywords may not have been included in the statistical analysis.
Conclusion
This comprehensive scientometric analysis details the “AI-MSK diseases” landscape over the past 24 years. The surge in academic publications reflects growing interest in this field, indicating a promising future. Global collaboration, particularly led by the USA and the UK, underscores the multinational nature and broad implications of this research. Institutions like the University of California, San Francisco, Harvard Medical School, and Seoul National University have made significant contributions. Influential figures such as Valentina Pedoia, Sharmila Majumdar, and Ali Guermazi have shaped this evolving field. Journals like Scientific Reports, Diagnostics, and Sensors are crucial platforms for this research. This analysis acknowledges limitations that present opportunities for more refined investigations and methodologies. Overall, this study provides a comprehensive overview of “AI-MSK diseases” research, outlining its trajectory and paving the way for future advancements.
Disclosure
The authors report no conflicts of interest in this work.
Acknowledgments
Special thanks to all researchers who have made valuable contributions to this field. We thank Home for Researchers (https://www.home-for-researchers.com) for language assistance and all organizations that funded this work. Figdraw (https://www.figdraw.com/static/index.html#/) was used to produce the graphical abstract.
Additional information
Funding
References
- Summers RF. Deep Medicine: How Artificial Intelligence Can Make Healthcare Human Again, Eric Topol, Hachette Book Group, New York (2019). Elsevier; 2019
- Hashimoto DA, Rosman G, Rus D, Meireles OR. Artificial Intelligence in surgery: promises and perils. Ann Surg. 2018;268(1):70–76. doi:10.1097/SLA.0000000000002693
- Naylor CD. On the Prospects for a (Deep) Learning Health Care System. JAMA. 2018;320(11):1099–1100. doi:10.1001/jama.2018.11103
- Maxmen JS. the post-physician era: medicine in the twenty-first century. J Reg Fisher Econ. 1976;1976:1.
- Topol EJ. High-performance medicine: the convergence of human and artificial intelligence. Nature Med. 2019;25(1):44–56. doi:10.1038/s41591-018-0300-7
- He J, Baxter SL, Xu J, Xu J, Zhou X, Zhang K. The practical implementation of artificial intelligence technologies in medicine. Nature Med. 2019;25(1):30–36. doi:10.1038/s41591-018-0307-0
- Kaul V, Enslin S, Gross SA. History of artificial intelligence in medicine. Gastroint Endosc. 2020;92(4):807–812. doi:10.1016/j.gie.2020.06.040
- Myers TG, Ramkumar PN, Ricciardi BF, Urish KL, Kipper J, Ketonis C. Artificial intelligence and orthopaedics: an introduction for clinicians. J Bone Joint Surg Am Vol. 2020;102(9):830–840. doi:10.2106/JBJS.19.01128
- Jahin MA, Talapatra S. A natural language processing-based classification and mode-based ranking of musculoskeletal disorder risk factors. Decis Analyt J. 2024;11:100464. doi:10.1016/j.dajour.2024.100464
- Beyaz S. A brief history of artificial intelligence and robotic surgery in orthopedics & traumatology and future expectations. Jt Dis Relat Surg. 2020;31(3):653–655. doi:10.5606/ehc.2020.75300
- Poduval M, Ghose A, Manchanda S, Bagaria V, Sinha A. Artificial intelligence and machine learning: a new disruptive force in orthopaedics. Indian J Orthop. 2020;54(2):109–122. doi:10.1007/s43465-019-00023-3
- Makhni EC, Makhni S, Ramkumar PN. Artificial intelligence for the orthopaedic surgeon: an overview of potential benefits, limitations, and clinical applications. J Am Acad Orthop Surg. 2021;29(6):235–243. doi:10.5435/JAAOS-D-20-00846
- Chen K, Stotter C, Klestil T, Nehrer S. Artificial intelligence in orthopedic radiography analysis: a narrative review. Diagnostics. 2022;12(9):1.
- Oosterhoff JHF, Doornberg JN. Artificial intelligence in orthopaedics: false hope or not? A narrative review along the line of Gartner’s hype cycle. EFORT Open Rev. 2020;5(10):593–603. doi:10.1302/2058-5241.5.190092
- Giorgino R, Alessandri-Bonetti M, Luca A, et al. ChatGPT in orthopedics: a narrative review exploring the potential of artificial intelligence in orthopedic practice. Front Surg. 2023;10:1284015. doi:10.3389/fsurg.2023.1284015
- Román-Belmonte JM, Corte-Rodríguez H, Rodríguez-Merchán EC. Artificial intelligence in musculoskeletal conditions. Front Biosci. 2021;26(11):1340–1348.
- St Mart JP, Goh EL, Liew I, Shah Z, Sinha J. Artificial intelligence in orthopaedics surgery: transforming technological innovation in patient care and surgical training. Postgrad Med J. 2023;99(1173):687–694. doi:10.1136/postgradmedj-2022-141596
- Ren M, Yi PH. Artificial intelligence in orthopedic implant model classification: a systematic review. Skel Radiol. 2022;51(2):407–416. doi:10.1007/s00256-021-03884-8
- Korneev A, Lipina M, Lychagin A, et al. Systematic review of artificial intelligence tack in preventive orthopaedics: is the land coming soon? Internat Orthopaed. 2023;47(2):393–403. doi:10.1007/s00264-022-05628-2
- Zhang X, Yang Y, Shen YW, et al. Diagnostic accuracy and potential covariates of artificial intelligence for diagnosing orthopedic fractures: a systematic literature review and meta-analysis. Eur Radiol. 2022;32(10):7196–7216. doi:10.1007/s00330-022-08956-4
- Shah RM, Wong C, Arpey NC, Patel AA, Divi SN. A Surgeon’s Guide to Understanding Artificial Intelligence and Machine Learning Studies in Orthopaedic Surgery. Curr Rev Musculosk Med. 2022;15(2):121–132. doi:10.1007/s12178-022-09738-7
- Chen H. Application progress of artificial intelligence and augmented reality in orthopaedic arthroscopy surgery. J Orthop Surg Res. 2023;18(1):775. doi:10.1186/s13018-023-04280-9
- Salimi M, Parry JA, Shahrokhi R, Mosalamiaghili S. Application of artificial intelligence in trauma orthopedics: limitation and prospects. World J Clin Cases. 2023;11(18):4231–4240. doi:10.12998/wjcc.v11.i18.4231
- Boudry C, Baudouin C, Mouriaux F. International publication trends in dry eye disease research: a bibliometric analysis. Ocular Surf. 2018;16(1):173–179. doi:10.1016/j.jtos.2017.10.002
- Zhang XL, Zheng Y, Xia ML, et al. Knowledge domain and emerging trends in vinegar research: a bibliometric review of the literature from WoSCC. Foods; 2020;9(2):1.
- Pei Z, Chen S, Ding L, et al. Current perspectives and trend of nanomedicine in cancer: a review and bibliometric analysis. J Control Release. 2022;352:211–241. doi:10.1016/j.jconrel.2022.10.023
- Ling LX, Ouyang Y, Hu Y. Research trends on nanomaterials in gastric cancer: a bibliometric analysis from 2004 to 2023. J Nanobiotechnology. 2023;21(1):248. doi:10.1186/s12951-023-02033-8
- Yeung AWK. Comparison between Scopus, Web of Science, PubMed and publishers for mislabelled review papers. Current Science. 2019;116:1909–1914. doi:10.18520/cs/v116/i11/1909-1914
- Cao S, Wei Y, Yue Y, Xiong A, Zeng H. Zooming in and out of programmed cell death in osteoarthritis: a scientometric and visualized analysis. J Inflamm Res. 2024;17:2479–2498. doi:10.2147/JIR.S462722
- Joshi MA. Bibliometric indicators for evaluating the quality of scientific publications. J Contemp Dent Pract. 2014;15:258–262. doi:10.5005/jp-journals-10024-1525
- Cao S, Wei Y, Yue Y, et al. Targeting ferroptosis unveils a new era for traditional Chinese medicine: a scientific metrology study. Front Pharmacol. 2024;15:1366852. doi:10.3389/fphar.2024.1366852
- Dara M, Sulis G, Centis R, et al. Cross-border collaboration for improved tuberculosis prevention and care: policies, tools and experiences. Int J Tuberc Lung Dis. 2017;21:727–736. doi:10.5588/ijtld.16.0940
- Jiang ST, Liu YG, Zhang L, Sang XT, Xu YY, Lu X. Immune-related adverse events: a bibliometric analysis. Front Immunol. 2022;13:1096806. doi:10.3389/fimmu.2022.1096806
- Li M, Du S. Current status and trends in researches based on public intensive care databases: a scientometric investigation. Front Public Health. 2022;10:912151. doi:10.3389/fpubh.2022.912151
- Yuan R, Tan Y, Sun P-H, Qin B, Liang Z. Emerging trends and research foci of berberine on tumor from 2002 to 2021: a bibliometric article of the literature from WoSCC. Front Pharmacol. 2023;14:1122890. doi:10.3389/fphar.2023.1122890
- Tiulpin A, Thevenot J, Rahtu E, Lehenkari P, Saarakkala S. Automatic knee osteoarthritis diagnosis from plain radiographs: a deep learning-based approach. Sci Rep. 2018;8(1):1727. doi:10.1038/s41598-018-20132-7
- Cruz-Jentoft AJ, Bahat G, Bauer J, et al. Sarcopenia: revised European consensus on definition and diagnosis. Age Ageing. 2019;48(1):16–31. doi:10.1093/ageing/afy169
- Ronneberger O, Fischer P, Brox T. U-net: convolutional networks for biomedical image segmentation. Paper presented at: Medical Image Computing and Computer-Assisted Intervention – MICCAI 2015. Cham; 2015.
- LeCun Y, Bengio Y, Hinton G. Deep learning. Nature. 2015;521(7553):436–444. doi:10.1038/nature14539
- He K, Zhang X, Ren S, Sun J. Deep residual learning for image recognition. Paper presented at: 2016 IEEE Conference on Computer Vision and Pattern Recognition (CVPR); 2016.
- Gulshan V, Peng L, Coram M, et al. Development and validation of a deep learning algorithm for detection of diabetic retinopathy in retinal fundus photographs. JAMA. 2016;316(22):2402–2410. doi:10.1001/jama.2016.17216
- Antony J, McGuinness K, Connor NEO, Moran K. Quantifying radiographic knee osteoarthritis severity using deep convolutional neural networks. Paper presented at: 2016 23rd International Conference on Pattern Recognition (ICPR); 2016.
- Norgeot B, Glicksberg BS, Trupin L, et al. Assessment of a deep learning model based on electronic health record data to forecast clinical outcomes in patients with rheumatoid arthritis. JAMA network open. 2019;2(3):e190606–e190606. doi:10.1001/jamanetworkopen.2019.0606
- Esteva A, Kuprel B, Novoa RA, et al. Dermatologist-level classification of skin cancer with deep neural networks. Nature. 2017;542(7639):115–118. doi:10.1038/nature21056
- Simonyan K, Zisserman A. Very deep convolutional networks for large-scale image recognition. Paper presented at: International Conference on Learning Representations; 2015.
- Rusk N. Deep learning. Nature Methods. 2016;13(1):35. doi:10.1038/nmeth.3707
- Chang -C-C, Lin C-J. LIBSVM: a library for support vector machines. J ACM Trans Intell Syst Technol. 2011;2(3):1.
- Milletari F, Navab N, Ahmadi SA. V-net: fully convolutional neural networks for volumetric medical image segmentation. Paper presented at: 2016 Fourth International Conference on 3D Vision (3DV); 2016.
- Kohn MD, Sassoon AA, Fernando ND. Classifications in brief: Kellgren-Lawrence classification of osteoarthritis. Clin Orthopaedics Related Res. 2016;474(8):1886–1893. doi:10.1007/s11999-016-4732-4
- Kingma D, Ba JJCS. Adam: a method for stochastic optimization. Computer Sci. 2014;2014:1.
- Chen T, Guestrin CJA. XGBoost: a scalable tree boosting system. ACM. 2016;2016:1.
- Ioffe S, Szegedy C. Batch normalization: accelerating deep network training by reducing internal covariate shift. JMLRorg. 2015;2015:1.
- Shin HC, Roth HR, Gao M, et al. Deep convolutional neural networks for computer-aided detection: CNN architectures, dataset characteristics and transfer learning. IEEE Transact Med Imag. 2016;35(5):1285–1298. doi:10.1109/TMI.2016.2528162
- Norman B, Pedoia V, Majumdar S. Use of 2D U-net convolutional neural networks for automated cartilage and meniscus segmentation of knee MR imaging data to determine relaxometry and morphometry. Radiology. 2018;288(1):177–185. doi:10.1148/radiol.2018172322
- Litjens G, Kooi T, Bejnordi BE, et al. A survey on deep learning in medical image analysis. Med Image Anal. 2017;42:60–88. doi:10.1016/j.media.2017.07.005
- Cao S, Wei Y, Yue Y, Liu P, Zeng H. Global research landscape on the crosstalk between ferroptosis and musculoskeletal diseases: a bibliometric and visualized analysis. Heliyon. 2023;9(12):e23113. doi:10.1016/j.heliyon.2023.e23113
- Obermeyer Z, Emanuel EJ. Predicting the future — big data, machine learning, and clinical medicine. New Engl J Med. 2016;375(13):1216–1219. doi:10.1056/NEJMp1606181
- Tack A, Mukhopadhyay A, Zachow S. (2018). Knee menisci segmentation using convolutional neural networks: data from the Osteoarthritis Initiative. Osteoarthritis and Cartilage.2018; 26(5): 680–688. doi:10.1016/j.joca.2018.02.907
- Haeberle HS, Helm JM, Navarro SM, et al. Artificial intelligence and machine learning in lower extremity arthroplasty: a review. J Arthropl. 2019;34(10):2201–2203. doi:10.1016/j.arth.2019.05.055
- Karnuta JM, Haeberle HS, Luu BC, et al. Artificial intelligence to identify arthroplasty implants from radiographs of the Hip. J Arthropl. 2021;36(7s):935–940. doi:10.1016/j.arth.2020.10.021
- Kurmis AP, Ianunzio JR. Artificial intelligence in orthopedic surgery: evolution, current state and future directions. Arthroplasty. 2022;4(1):9. doi:10.1186/s42836-022-00112-z
- Helm JM, Swiergosz AM, Haeberle HS, et al. Machine learning and artificial intelligence: definitions, applications, and future directions. Curr Rev Musculosk Med. 2020;13(1):69–76. doi:10.1007/s12178-020-09600-8
- Bloomfield RA, Williams HA, Broberg JS, Lanting BA, McIsaac KA, Teeter MG. Machine learning groups patients by early functional improvement likelihood based on wearable sensor instrumented preoperative timed-up-and-go tests. J Arthropl. 2019;34(10):2267–2271. doi:10.1016/j.arth.2019.05.061
- El-Hassoun O, Maruscakova L, Valaskova Z, Bucova M, Polak S, Hulin I. Artificial intelligence in service of medicine. Bratisl Lek Listy. 2019;120(3):218–222. doi:10.4149/BLL_2019_028
- Kumar V, Patel S, Baburaj V, Vardhan A, Singh PK, Vaishya R. Current understanding on artificial intelligence and machine learning in orthopaedics - A scoping review. J Orthopaed. 2022;34:201–206. doi:10.1016/j.jor.2022.08.020
- Kish LJ, Topol EJ. Unpatients-why patients should own their medical data. Nature Biotechnol. 2015;33(9):921–924. doi:10.1038/nbt.3340
- Feldman S, Ammar W, Lo K, Trepman E, van Zuylen M, Etzioni O. Quantifying sex bias in clinical studies at scale with automated data extraction. JAMA network open. 2019;2(7):e196700. doi:10.1001/jamanetworkopen.2019.6700
- Oh SS, Galanter J, Thakur N, et al. Diversity in clinical and biomedical research: a promise yet to be fulfilled. PLoS Med. 2015;12(12):e1001918. doi:10.1371/journal.pmed.1001918
- Benjamens S, Dhunnoo P, Meskó B. The state of artificial intelligence-based FDA-approved medical devices and algorithms: an online database. Npj Digital Med. 2020;3:118. doi:10.1038/s41746-020-00324-0
- Niel O, Bastard P. Artificial intelligence in nephrology: core concepts, clinical applications, and perspectives. Am J Kidn Dis. 2019;74(6):803–810. doi:10.1053/j.ajkd.2019.05.020
- Zhang J, Song L, Jia J, et al. Knowledge mapping of necroptosis from 2012 to 2021: a bibliometric analysis. Front Immunol. 2022;13:917155. doi:10.3389/fimmu.2022.917155
- Yan W-T, Lu S, Yang Y-D, et al. Research trends, hot spots and prospects for necroptosis in the field of neuroscience. Neural Regen Res. 2021;16:1628–1637. doi:10.4103/1673-5374.303032