
 ?Mathematical formulae have been encoded as MathML and are displayed in this HTML version using MathJax in order to improve their display. Uncheck the box to turn MathJax off. This feature requires Javascript. Click on a formula to zoom.
Abstract
Background
Pain catastrophizing is an exaggerated negative cognitive response related to pain. It is commonly assessed using the Pain Catastrophizing Scale (PCS). Translation and validation of the scale in a new language would facilitate cross-cultural comparisons of the role that pain catastrophizing plays in patient function.
Purpose
The aim of this study was to translate and culturally adapt the PCS into Nepali (Nepali version of PCS [PCS-NP]) and evaluate its clinimetric properties.
Methods
We translated, cross-culturally adapted, and performed an exploratory factor analysis (EFA) of the PCS-NP in a sample of adults with chronic pain (N=143). We then confirmed the resulting factor model in a separate sample (N=272) and compared this model with 1-, 2-, and 3-factor models previously identified using confirmatory factor analyses (CFAs). We also computed internal consistencies, test–retest reliabilities, standard error of measurement (SEM), minimal detectable change (MDC), and limits of agreement with 95% confidence interval (LOA95%) of the PCS-NP scales. Concurrent validity with measures of depression, anxiety, and pain intensity was assessed by computing Pearson’s correlation coefficients.
Results
The PCS-NP was comprehensible and culturally acceptable. We extracted a two-factor solution using EFA and confirmed this model using CFAs in the second sample. Adequate fit was also found for a one-factor model and different two- and three-factor models based on prior studies. The PCS-NP scores evidenced excellent reliability and temporal stability, and demonstrated validity via moderate-to-strong associations with measures of depression, anxiety, and pain intensity. The SEM and MDC for the PCS-NP total score were 2.52 and 7.86, respectively (range of PCS scores 0–52). LOA95% was between −15.17 and +16.02 for the total PCS-NP scores.
Conclusion
The PCS-NP is a valid and reliable instrument to assess pain catastrophizing in Nepalese individuals with chronic pain.
Introduction
Pain catastrophizing, which has been defined as an exaggerated negative cognitive response related to pain,Citation1 has been shown to be associated with a broad array of important quality of life domains such as pain intensity, pain interference, and psychological function in individuals with chronic pain from different cultures.Citation2,Citation3 Catastrophizing is responsive to various pain treatmentsCitation4–Citation7 and has been found to mediate the effects of many of these.Citation4,Citation8 Thus, catastrophizing remains an important psychosocial domain to assess in patients with chronic pain. The most common measure of pain catastrophizing is the 13-item Pain Catastrophizing Scale (PCS).
The PCS has three subscales assessing pain-related rumination, magnification, and helplessness.Citation1,Citation9 This three-factor structure has been confirmed in other English-speaking samples,Citation9,Citation10 although research has shown that two-factor solutions show better fit in some samples.Citation11,Citation12 Non-English translations have also been shown to yield both two and three factors.Citation13–Citation19 However, given the strong associations among the factors, researchers tend to use the total PCS score more often than the subscale scores.Citation4,Citation5,Citation7
The original English version of the PCS and its translated versions are psychometrically robust. The total score of PCS has repeatedly been shown to be reliable as evidenced by good-to-excellent internal consistencyCitation2,Citation3,Citation10,Citation14–Citation17,Citation20,Citation21 and excellent test–retest reliability.Citation2,Citation14,Citation17,Citation20–Citation22 Standard error of measurement (SEM) and minimal detectable change (MDC) of the PCS range from 1.6 to 4.6Citation14,Citation15,Citation21,Citation22 and 8.8 to 12.8,Citation14,Citation15,Citation17,Citation21 respectively. Concurrent validity of the PCS is supported via moderate-to-strong correlations (ie, r≥0.30) with measures of depression,Citation2,Citation14,Citation16,Citation17 anxiety,Citation1,Citation2,Citation14,Citation17 and pain intensity.Citation1,Citation2,Citation10,Citation11,Citation14,Citation16,Citation17
The PCS has been translated into a number of different languages (https://eprovide.mapi-trust.org/instruments/pain-catastrophizing-scale#languages). The availability of translated measures is critical to facilitate research examining the role that language and culture may play in how catastrophizing is related to patient function. Thus, the aim of this study was to translate the PCS into another language – this time, Nepali (Nepali version of PCS [PCS-NP]) – and assess its clinimetric properties. Consistent with the extant research, we hypothesized that the PCS-NP would demonstrate either a two-factor structure or a three-factor structureCitation1,Citation12 and that the factors would be strongly associated with one another, supporting the use of the total scale in this population. We further hypothesized that the PCS-NP scales would demonstrate 1) good-to-excellent internal consistencies (ie, Cronbach’s a≥0.70),Citation2,Citation14–Citation17,Citation20,Citation21,Citation23,Citation24 2) excellent 2-week test–retest stability (ie, intraclass correlation coefficient [ICC] ≥0.75),Citation14,Citation15,Citation17,Citation20–Citation22,Citation24 3) SEM between 1.6 and 4.6,Citation14,Citation15,Citation21,Citation22 4) MDC between 8.8 and 12.8,Citation14,Citation15,Citation17,Citation21 and 5) concurrent validity via moderate-to-strong correlations (ie, r≥0.30) with measures of depression, anxiety, and pain intensity.Citation2,Citation14,Citation16,Citation17
Methods
We first translated the PCS to Nepali and performed cognitive debriefing of the instructions and items to ensure that the items were culturally appropriate in 30 individuals with musculoskeletal pain. Next, we evaluated the clinimetrics of the PCS-NP in two independent samples. Ethical approval of the research was obtained from the Institutional Review Committee of the Kathmandu University School of Medical Sciences, Dhulikhel, Nepal (reference number: 105/14), and the study complies with ethical guidelines of the Declaration of Helsinki. Written informed consent was obtained from all the research participants before data collection. Those participants who could not read or provide a written signature provided a verbal consent, and a witness signed on their behalf.
Translation procedure
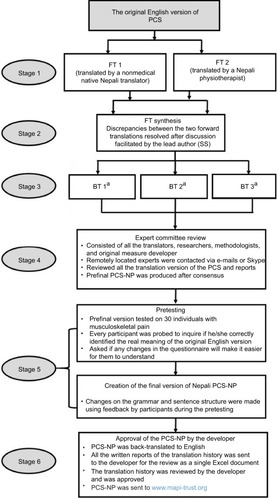
Translation of PCS into Nepali was performed using standard guidelines.Citation25 First, we obtained permission from the developer (Professor Michael Sullivan) to translate the PCS into Nepali. Then, two forward translators translated the PCS into Nepali. The two forward translated versions were synthesized to a single first translated (FT) version. The FT version was then back-translated into English by three independent native English speakers. An expert committee meeting was held, which comprised language experts, translators (who were available for a face-to-face meeting), and research methodologist. Any discrepancies were discussed, and Nepali version of the PCS that is simple and comprehensible was finalized during the meeting. Translators remotely located were contacted via e-mails and Skype, and any important suggestions were noted. The final Nepali version was back-translated into English, which was sent to the last author (MPJ) for review.
The resultant version was tested in a sample of 30 individuals with either acute musculoskeletal pain or persistent musculoskeletal pain for cognitive debriefing. Minor changes were made in sentence structure, and simpler words replaced difficult words so that most participants could understand the final PCS-NP. The final Nepali version, its back-translation, and translation history were sent to the developer, who reviewed and approved it. The Nepali version is licensed and distributed by Mapi Research Trust, and researchers intending to use PCS-NP should contact Mapi Research Trust for its use (https://eprovide.mapi-trust.org/instruments/pain-catastrophizing-scale). The translation history is summarized in .
Figure 1 Translation history of PCS-NP.
Abbreviations: BT, backward translation; FT, forward translation; PCS, Pain Catastrophizing Scale; PCS-NP, Nepali version of PCS.
Clinimetric evaluation
Participants
Two independent adult (age ≥18 years) samples of Nepali-speaking individuals with chronic pain (pain lasting for >3 months) were recruited. The first sample included individuals with chronic pain (N=144) recruited from a tertiary care hospital (n=44; consecutive patients) and a community (n=100; by door-to-door survey) in rural Nepal with pain intensity ≥4 out of 10 on a 0–10 numerical pain rating scale (NPRS) (0= “no pain” and 10= “maximum pain”). The second sample, also consisted of individuals with chronic pain (N=275) who were required to report ≥3 out of 10 pain on an NPRS, was recruited mostly from the community (n=252). The reminder (n=23) of the sample was recruited from the same hospital as that used to recruit the first sample. All the participants in both samples provided data via interview.
Measures
Participants in the first sample were administered the PCS-NP once, and participants in the second sample were administered the PCS-NP twice (2 weeks apart), with 244 (90%) of original sample providing retest data. A summary of the measures used in the study is provided in and described in more detail later.
Table 1 Nepali versions of PROMs used in the study
Beck Anxiety Inventory (BAI)
The 21-item BAI was used to assess perceived anxiety in the first sample.Citation26 Each item is scored on a 4-point Likert scale ranging from 0 to 3 where 0= “not at all” and 3= “severely, I could barely stand it”. Total score can range from 0 to 63, with higher scores indicating more anxiety. The Nepali version of BAI – the version used in this study – has been shown to be reliable (Cronbach’s a=0.89Citation27 and ICC =0.88Citation28). The BAI demonstrated excellent internal consistency (Cronbach’s a=0.90) in the current sample.
Beck Depression Inventory (BDI)
The 21-item BDI was used to assess depression in the first sample.Citation29 Each item in the scale has four unique response options designed for that item. Severity of depression symptoms is rated on the 4-point scale, ranging from 0 to 3. Total score can range from 0 to 63, with higher scores indicating more depression. The Nepali version of BDI is a reliable measure (Cronbach’s a=0.90Citation30 and ICC =0.84Citation28) and demonstrated excellent internal consistency (Cronbach’s a=0.90) in the current sample.
Patient-Reported Outcomes Measurement Information System (PROMIS) pain intensity
The PROMIS average pain intensity over the past 7 days was assessed in the second sample on a 5-point Likert scale where 1= “no pain”, and 5= “very severe pain”, with higher scores indicating more intense pain (http://www.healthmeasures.net). Test–retest stability (ICC) of the Nepali version of PRO-MIS pain intensity scale is 0.71 in the current second sample.
Global Rating of Change (GRoC)
The Nepali version of GRoC was used to assess global impression of perceived change in their chronic pain-related problems in the second sample on a 7-point Likert scale ranging from 1 to 7.Citation31–Citation33 Score 4 represents “no change”, scores >4 indicate improvement, and scores <4 indicate worsening. The GRoC was used to categorize the sample to “improved” and “stable” groups, considering 1-point change as significant improvement.Citation32,Citation33 We classified participants with a GRoC score of 4 as stable and participants with GRoC scores of 5–7 as improved. Using this classification, participants in the stable group were used for computing the test–retest stability, SEM, MDC, and limits of agreement statistics.Citation34
Other measures
Demographics information collected included age, sex, religion, ethnicity, education, and occupation. Additionally, total duration of chronic pain was recorded in months and pain site was assessed using a pain diagram.
Statistical analyses
Factor analyses
We performed an exploratory factor analysis (EFA) in the first sample (hereafter referred to as the EFA sample) using maximum likelihood for factor extraction. Factor rotation was performed using oblique rotation (Direct Oblimin; delta =0), allowing the factors to correlate with each other. Next, we performed a series of confirmatory factor analyses (CFAs) in the second sample (hereafter referred to as the CFA sample) to compare the results of the EFA from the first sample with 1) a one-factor solution including all the 13 items as a single factor, 2) the two-factor solution obtained from the largest English-speaking sample published,Citation11 and 3) the original three-factor solution found by Sullivan et alCitation1 using AMOS for Statistical Software for Social Sciences (SPSS) 24. Model fit was evaluated using the chi-square goodness-of-fit index, the ratio of chi-square value to degree of freedom, the root mean square error of approximation (RMSEA), comparative fit index (CFI), and parsimony goodness-of-fit index (PGFI). Better fit is indicated by 1) chi-square value and the ratio of chi-square to degree of freedom values closer to zero, 2) lower values of RMSEA, 3) larger values of CFI, and 4) larger value of PGFI, which indicates more parsimonious fit.Citation35
Reliability
To evaluate reliability, we assessed internal consistency, test–retest stability, SEM, MDC, and created Bland–Altman Plots. We computed internal consistencies of the PCS-NP scales for both samples, using Cronbach’s a. We considered values of Cronbach’s a<0.70 as inadequate, values between 0.70 and 0.79 as adequate, values between 0.80 and 0.89 as good, and values ≥0.90 as excellent.Citation24 Two-week test–retest stability was evaluated using the ICC in the stable group (GRoC =4). We considered the values of ICC between 0.40 and 0.59 as fair, values between 0.60 and 0.74 as good, and values ≥0.75 as excellent.Citation24
To further evaluate reliability, we also computed the SEM, which is an indication of how repeated administration of a measure tends to be distributed around the “true” score. SEM is important to consider because two measurements obtained at different times will not yield exactly the same score, either because of the variation in the participants being assessed or because of the variation in the measurement process, or both.Citation36 Thus, it is possible that a measure may have large test–retest stability indicating excellent reliability but may also have a large measurement error. Therefore, the SEM compliments test–retest stability and is a recommended parameter to assess and report in clinimetric studies.Citation37 Larger scores indicate large variability, and smaller scores indicate minimal variability. We calculated SEM using the following formula: SEM = SDchange × √(1- ICC),Citation38 where SDchange is the standard deviation for the mean change of PCS-NP scores. Using the SEM value, we further calculated MDC for 95% confidence interval (MDC95%) of the PCS-NP using the following formula: MDC95% =1.96×√2× SEM.Citation37,Citation38 A Bland–Altman plot was created to complement the measurement error and indicates the levels of agreement between the baseline and follow-up assessments.Citation38,Citation39 The plot was drawn with change of PCS-NP scores from baseline to follow-up (Y-axis) versus mean score of PCS-NP between baseline and follow-up assessments (X-axis). Limits of agreement with 95% confidence interval (LOA95%) were computed by using the following formula: mean difference ±1.96× SDchange.Citation39,Citation41
Validity
We evaluated the concurrent validity of the PCS-NP scales by computing Pearson’s correlation coefficients between the PCS-NP scale scores and the scores from Nepali versions of BDI, BAI administered to participants in the EFA sample, and PROMIS pain intensity short-form 3a measure administered to CFA sample. We considered correlation coefficients (r) <0.30 as weak, coefficients between 0.30 and 0.49 as moderate, and coefficients ≥0.50 as strong.Citation42 We excluded the participants for all analysis if there were any missing values on the PCS items.
Results
The PCS-NP succeeded in retaining the semantic, idiomatic, experiential, and conceptual equivalence. The reporting of the clinimetric properties is guided by COSMIN recommendations.Citation40 Scores of PCS-NP were normally distributed in both the EFA and CFA samples. A total of 0.7% (n=1) and 2.6% (n=7) in EFA and CFA samples, respectively, scored 0/52 total score, and 0.7% (n=1) and 1.1% (n=2) in EFA and CFA samples, respectively, scored 52/52 total score.
Demographic characteristics
The majority of study participants were women (65% and 73% in the EFA and CFA samples, respectively) and were Hindu in religion (92% and 85%). Almost half of the participants in both the samples had pain in multiple body parts (42% and 47%), followed by pain in the low back and pelvis (22% and 18%) and knee(s) (21% and 19%), respectively. All the participants in the EFA sample were individuals with chronic musculoskeletal pain; however, 4% of the CFA sample had chronic headache. Descriptive information for the two samples is presented in .
Table 2 Description of the study participants
Of the 144 participants in the EFA sample and 275 participants in the CFA sample who were administered PCS-NP at the baseline assessment, there were missing items in the data completed by one and three participants, respectively, in the two samples. We excluded the participants with missing items in all analyses from EFA and CFA samples; thus, there were N=143 participants in EFA sample and N=272 participants in the CFA sample for all analyses.
Factor analyses
Results of EFA in the EFA sample (N=143) using maximum likelihood with Oblimin rotation for factor extraction and the Kaiser criterion (ie, eigenvalues >1.0) to determine the number of factors indicated a two-factor solution. As can be seen in the pattern matrix from the EFA analysis (), Factor 1 comprised items 2, 3, 4, 5, 9, 12, and 13 and Factor 2 comprised items 1, 6, 7, 8, 10, and 11. Given the items that were loaded on each factor, we labeled Factor 1 “helplessness” and Factor 2 “pain focus”.
Table 3 Pattern matrix after maximum likelihood factor extraction and Oblimin rotation
These two factors explained 50% of variance in the items (). The two factors, however, were very strongly associated with one another (r=0.91). The two-factor solution found in the first sample demonstrated an acceptable fit in the CFA sample (). In addition, the one-factor, another two-factor extracted by Chibnall and Tait,Citation11 and the three-factor extracted by Sullivan et alCitation1 also had adequate fit, comparable to the two-factor solution extracted from the EFA sample. Attempts to improve each of these models further by allowing up to two pairs of error terms to correlate resulted in only modest improvements in the fit of each model ().
Figure 2 Path diagram after CFAs, two-factor model (upper), and one-factor model (lower) with adjustment for covariance of error terms in CFA sample (N=272).
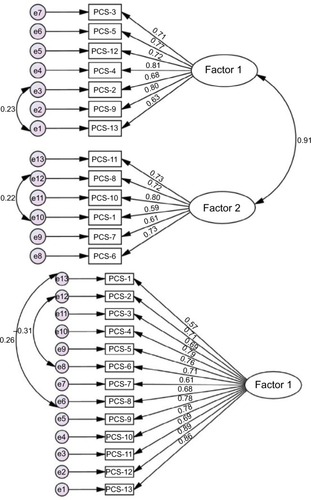
Table 4 Results of the confirmatory factor analyses for the PCS-NP in the CFA sample (N=272)
Reliability
Results of the analyses evaluating the reliability of PCS-NP total score and two subscale scores (computed using the results of the factor analyses as a guide) are presented in . The PCS-NP demonstrated good-to-excellent internal consistency (range 0.83–0.93) in the two samples. Two-week test–retest reliability on the stable sample was excellent 0.90 (95% CI: 0.85, 0.93). SEM and MDC for the total score of PCS-NP were 2.52 and 6.98, respectively. LOA95% ranged from −15.17 to 16.02 for the total PCS-NP scores. The LOA95% of the sub-scales is presented in . Bland–Altman plot, which shows the limits of agreement for the total PCS items and the two factors, separately, is presented as .
Figure 3 Bland–Altman plots for total PCS (A), PCS Factor 1 (B), and PCS Factor 2 (C).
Abbreviations: GRoC, Global Rating of Change; PCS, Pain Catastrophizing Scale; PCS-NP, Nepali version of Pain Catastrophizing Scale.
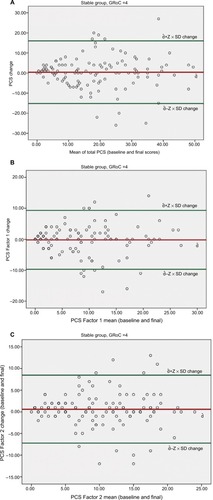
Table 5 Reliability of the PCS-NP
Validity
Both the total score and subscale scores were positively, moderately, and significantly associated with the criterion variables assessing depression, anxiety, and pain intensity. Concurrent validity of PCS-NP total scores and subscales is presented in .
Table 6 Validity of the PCS-NP
Discussion
The PCS-NP was successfully translated and adapted to Nepali and validated in Nepalese with chronic pain. The findings support its reliability and validity. Specifically, we extracted two-factor solution (Factor 1= helplessness and Factor 2= pain focus) from the EFA in the EFA sample and confirmed this solution by CFA in an independent sample. The reliability of the PCS-NP total score and two subscale scores was supported by excellent internal consistencies and test–retest stability over a 2-week period. Concurrent validity was supported via moderate-to-strong associations with measures assessing depression, anxiety, and pain intensity, as hypothesized.
Factor analysis
The factor analysis of the PCS-NP items yielded two factors in our sample. Although three factors are more common,Citation2,Citation14–Citation16,Citation18,Citation20,Citation22,Citation43 two factors sometimes emergeCitation11,Citation12,Citation19,Citation44 in different samples of individuals with chronic pain. The differences in the factor structure of these items across different samples may be related to cultural differences in how catastrophizing thoughts relate to each other (and possibly impact function) in different countries. In our sample, helplessness was largely retained as a unique factor, but distinct “rumination” and “magnification” factors did not emerge as they had in the original English version of the PCSCitation45 or many other samples.Citation2,Citation14–Citation16,Citation18,Citation20,Citation22,Citation43 Instead, the second factor appeared to reflect thoughts related to a focus on pain.
At the same time, the two factors that emerged in this study were strongly associated with each other, suggesting that they may both be assessing the same overarching construct. This conclusion is also supported by the similar pattern of associations between the two PCS-NP subscale scores and the criterion variables. Many other studies have also shown strong between-factor associations in both two-factorCitation11,Citation12,Citation19 and three-factor models.Citation3 Also, of note, even though there is a large degree of overlap in how the PCS items load onto different factors across studies, rarely if ever do the exact same PCS items load on the same two- or three-factor models in any pair of studies.Citation3,Citation11,Citation12,Citation14,Citation17 As a group, these findings support the conclusions that 1) the PCS items tend to reflect more than one (but strongly intercorrelated) subdomain of catastrophizing, 2) the specific subdomains reflected in the items vary to some degree across different populations, and 3) there exists a single overarching domain assessed by the PCS that is reliable and consistent across populations. Practically, these findings indicate that the PCS total score (but not necessarily the subdomain scores) may be most appropriate for cross-cultural research.
Reliability
The internal consistencies of the PCS-NP total score in this study (a range =0.90–0.93) lie within the ranges previously reported. They are higher than the original English and the Catalan versions (a=0.87 in both)Citation16,Citation32 and Hindi version (a=0.76),Citation22 similar to those found in samples who speak other languages such as Malay, Korean, Chinese, Italian, and German (a range =0.90–0.93)Citation2,Citation3,Citation14,Citation17,Citation20 and less than those found in a sample of patients from South Africa (a=0.97–0.98).Citation21
Similarly, we found that the 2-week stability of the PCS-NP was excellent in our test–retest sample, consistent with our a priori hypothesis. Two weeks is considered optimal for the assessment of reproducibility of a measure, because it is long enough to limit potential recall bias and also short enough to limit real change.Citation40 Additionally, it is important to compute test–retest stability in the sample reporting that did they not perceive a change in their pain problem. Thus, in the current study, we assessed test–retest stability in those participants who reported no change in their pain problem using the GRoC as an external anchor.Citation38 Numerous previous studies either assessed test–retest stability in short periods (range 1–7 days),Citation15,Citation17,Citation20,Citation22 which may have been resulted in findings that have recall bias,Citation40 or assessed using longer epochs (3–4 weeks).Citation3,Citation15,Citation21 To our knowledge, only two studies assessed the test–retest reliability of the PCS using a 2-week time period, the results of which are comparable to our study.Citation14,Citation16 Additionally, we reported test–retest stability in a stable sample who reported no change in their pain-related problems. Most of the studies evaluating the psychometric properties of the PCS have not computed the test–retest reliability in a stable sample. This is especially true for those studies reporting longer follow-up for retest assessment.Citation3,Citation15,Citation21 The participants in these studies were more likely to have changed with respect to their pain problem (and catastrophizing scores). Thus, the stability of the PCS may be underestimated in these studies. Support for this possibility is found in one study, which computed test–retest stabilities in both a subsample of stable patients with low back pain and the total sample and found better temporal stability in the stable group (ICC =0.92, n=34) versus the total group (ICC =0.85, n=60).Citation15
Measurement error
The measurement error parameters we found met our a priori hypothesis for SEM, but we found lower MDC values than previously reported. Both the SEM and MDC are dependent on the test–retest coefficient. As previously indicated, the stability assessed is influenced by the sample chosen (ie, stable sample versus total sample). Not many studies have reported measurement error parameters, which are now recommended by the COSMIN checklist for clinimetric studies.Citation37 The value of SEM we found for the total score (2.52) is larger than the Hindi version (SEM =1.60)Citation22 and smaller than other versions (SEM =3.30–4.60).Citation14,Citation15,Citation20,Citation21 The SEM is influenced by the SD of change of PCS score (SDchange) and the ICC (refer to the formula we used to calculate SEM in the “Methods” section). The smaller SEM values in our study are likely related to our use of the stable group to compute test–retest stability and measurement error, as opposed to other studies that used total group to compute test–retest stability and SEM. Thus, we obtained smaller SDchange and larger ICC values, giving us more precise value of SEM. The authors of the Hindi version study included the SD of the baseline measurement instead of the SDchange, which may have accounted for their very low SEM.Citation22
The MDC value of 6.98/52 observed in our sample provides a cut-point for determining the reliability of changes in the PCS score. The MDC computed from our sample is smaller than those observed in other samples (range 8.83–13).Citation14,Citation17 This is due to the smaller variability in the catastrophizing scores (as represented by the standard deviation) and larger test–retest reliability coefficient (ICC) in our sample, relative to those in previous studies.Citation14,Citation17 The MDC statistics is useful as a guide to indicate whether or not a change in PCS score is greater than measurement error; that is, if the change represents true change and not just random error. For the PCS-NP, a change of 7/52 can be viewed as representing true change in the total PCS score beyond measurement error.
The results of LOA95% and Bland–Altman plotsCitation39 () provide further information regarding measurement error.Citation38,Citation40 The Bland–Altman plots show agreement between test and retest scores for every study participant, that is, how far each participant deviates from the mean change score between the baseline and final measurements. In the current study, LOA95% indicates that for 95% of participants, a measurement at follow-up assessment would be between 15.17 points less and 16.02 points greater (out of a total of 52 points) than the baseline measurement.
Validity
The validity of PCS-NP is supported by 1) its comprehensibility and negligible missing items, 2) structural validity interpreted by factor analyses, 3) cross-cultural validity by adherence to high standards of translation guidelines,Citation46 and 4) concurrent validity by testing a priori hypotheses. We adapted and adhered to translation and cross-cultural adaptation guidelines by Beaton,Citation46 which assured high standards in translation methodology. Importantly, we confirmed the concurrent validity of the PCS-NP based on our a priori hypotheses that PCS-NP would correlate moderately to strongly and significantly with the criterion variables. Association of PCS-NP with measure of depression in the current sample (r=0.56) is within the range previously reported (r=0.40–0.61).Citation2,Citation14–Citation17,Citation20 It is larger than those reported by the Chinese (r=0.40),Citation2 similar to Korean (r=0.53),Citation14 but smaller than Catalan (r=0.61, BDI).Citation16 As the association with depression, PCS-NP in the current sample showed moderate negative associations with the measures of anxiety and lies in the range that is previously reported (r=0.53–0.82).Citation2,Citation14,Citation15,Citation17,Citation20 Similarly, association of PCS-NP with measure of pain intensity is moderate, which also lies within the range previously reported (r=0.25–0.45).Citation2,Citation14–Citation17,Citation20–Citation22 As the a priori hypotheses regarding expected correlations of PCS-NP with criterion variables were met in the current study, concurrent validity of the PCS-NP is supported.
Strengths and limitations
One strength of the study is that it was conducted and reported using the COSMIN checklist as a guide.Citation37,Citation40 As per the COSMIN recommendations, we used an adequate sample size (>100) and we confirmed participants’ stability during the interim period by the use of GRoC. However, the study also has limitations, which should be considered when interpreting the results. One limitation is the use of cross-sectional design. Given that the correlations of the PCS-NP with the criterion variables presented are based on cross-sectional data, we are not able to draw any causal conclusions regarding the impact of catastrophizing on pain intensity, depression, or anxiety, or vice versa. Instead, the findings support the possibility that catastrophizing may play as large a role in patient functioning in Nepal as found in Western countries. This indicates that research examining the causal relationships in this population is warranted. Furthermore, the study design was not a clinical trial, in which catastrophizing was systematically manipulated. This would have allowed us to evaluate the responsiveness of the PCS-NP to treatment and link changes in the PCS-NP scores with treatment outcomes. Future research to evaluate the responsiveness of the PCS-NP to treatment, as well as to better understand the meaning of change in the PCS-NP scores (eg, the change that represents a minimum important change) would be useful. Finally, we did not assess divergent (discriminant) validity of the PCS-NP, which is another important measure of construct validity. Research to evaluate this validity domain for the PCS-NP would be useful.
Summary and conclusion
Here, we developed a comprehensible, culturally appropriate, valid, and reliable PCS-NP for the use in Nepalese with chronic musculoskeletal pain or headache. The availability of this measure will facilitate more cross-cultural comparative study of the role that catastrophizing plays in patient with chronic pain. For the clinical use of the PCS-NP, clinicians should consider PCS change score ≥7 as a true change beyond the measurement error. Future research should evaluate the discriminant validity of as well as the minimum important changes in the PCS-NP that is meaningful to patients, in order to better understand the validity and clinical significance of the PCS-NP.
Author contributions
SS contributed to the conception, study design, data collection, data analysis, drafting of the first manuscript, and revision and approval of the final version. PT contributed to the conception, study design, and final approval of the manuscript. JHA contributed to the review of manuscript drafts and final approval of the manuscript. MPJ contributed to the conception, study design, and revisions and final approval of the manuscript. All authors contributed toward data analysis, drafting and critically revising the paper and agree to be accountable for all aspects of the work.
Acknowledgments
The authors of the study would like to acknowledge: 1) the International Association for the Study of Pain (IASP) for providing a developing country collaborative research grant to SS and MPJ, which supported this study; 2) the developer of the PCS, Professor Michael Sullivan, for granting permission to translate the PCS to Nepali, reviewing the translation history, and approving the final version; 3) all the translators for volunteering to translate the scale; 4) the physiotherapy students (Anupa Pathak, Dipendra Thakur, Jyoti Jha, Manisha Lakhey, Riju Maharjan, Shree Krishna Shilpakar, and Soniya Maharjan) at Kathmandu University School of Medical Sciences who assisted with the data collection; and 5) all the study participants who volunteered to participate in the study and investing their time for the completion of questionnaires.
This project was supported in part by “Developing Countries Collaborative Research Grant” from the International Association for the Study of Pain awarded to MPJ and SS.
Disclosure
The authors report no conflicts of interest in this work.
References
- SullivanMJLBishopSRPivikJThe Pain Catastrophizing Scale: development and validationPsychol Assess199574524532
- YapJCLauJChenPPValidation of the Chinese Pain Catastrophizing Scale (HK-PCS) in patients with chronic painPain Med20089218619518298701
- Mohd DinFHHoeVCChanCKMuslanMACultural adaptation and psychometric assessment of Pain Catastrophizing Scale among young healthy Malay-speaking adults in military settingsQual Life Res20152451275128025373928
- TrompetterHRBohlmeijerETFoxJPSchreursKMPsychological flexibility and catastrophizing as associated change mechanisms during online Acceptance & Commitment Therapy for chronic painBehav Res Ther201574505926409158
- DayMAThornBERubinNJMindfulness-based cognitive therapy for the treatment of headache pain: a mixed-methods analysis comparing treatment responders and treatment non-respondersComplement Ther Med201422227828524731899
- VallejoMAOrtegaJRiveraJComecheMIVallejo-SlockerLInternet versus face-to-face group cognitive-behavioral therapy for fibromyalgia: a randomized control trialJ Psychiatr Res20156810611326228408
- ThornBEPenceLBWardLCA randomized clinical trial of targeted cognitive behavioral treatment to reduce catastrophizing in chronic headache sufferersJ Pain200781293894917690017
- CarmodyTPDuncanCLHugginsJTelephone-delivered cognitive-behavioral therapy for pain management among older military veterans: a randomized trialPsychol Serv201310326527523244028
- SullivanMJLTrippDARodgersWMStanishWCatastrophizing and pain perception in sport participantsJ Appl Sport Psychol2000122151167
- OsmanABarriosFXGutierrezPMKopperBAMerrifieldTGrittmannLThe Pain Catastrophizing Scale: further psychometric evaluation with adult samplesJ Behav Med200023435136510984864
- ChibnallJTTaitRCConfirmatory factor analysis of the Pain Catastrophizing Scale in African American and Caucasian Workers’ Compensation claimants with low back injuriesPain2005113336937515661446
- OsmanABarriosFXKopperBAHauptmannWJonesJO’NeillEFactor structure, reliability, and validity of the Pain Catastrophizing ScaleJ Behav Med19972065896059429990
- Van DammeSCrombezGBijttebierPGoubertLVan HoudenhoveBA confirmatory factor analysis of the Pain Catastrophizing Scale: invariant factor structure across clinical and non-clinical populationsPain200296331932411973004
- ChoSKimHYLeeJHValidation of the Korean version of the Pain Catastrophizing Scale in patients with chronic non-cancer painQual Life Res20132271767177223180163
- FernandesLStorheimKLochtingIGrotleMCross-cultural adaptation and validation of the Norwegian pain catastrophizing scale in patients with low back painBMC Musculoskelet Disord20121311122726668
- MiroJNietoRHuguetAThe Catalan version of the Pain Catastrophizing Scale: a useful instrument to assess catastrophic thinking in whiplash patientsJ Pain20089539740618226964
- MonticoneMBaiardiPFerrariSDevelopment of the Italian version of the Pain Catastrophising Scale (PCS-I): cross-cultural adaptation, factor analysis, reliability, validity and sensitivity to changeQual Life Res20122161045105021912846
- SehnFChachamovichEVidorLPCross-cultural adaptation and validation of the Brazilian Portuguese version of the pain catastrophizing scalePain Med201213111425143523036076
- IlcinNGurpinarBBayraktarDCross-cultural adaptation and validation of the Turkish version of the pain catastrophizing scale among patients with ankylosing spondylitisJ Phys Ther Sci201628129830326957778
- MeyerKSprottHMannionAFCross-cultural adaptation, reliability, and validity of the German version of the Pain Catastrophizing ScaleJ Psychosom Res200864546947818440399
- MorrisLDGrimmer-SomersKALouwQASullivanMJCross-cultural adaptation and validation of the South African Pain Catastrophizing Scale (SA-PCS) among patients with fibromyalgiaHealth Qual Life Outcomes20121013723173637
- BansalDGudalaKLavudiyaSGhaiBAroraPTranslation, adaptation, and validation of Hindi version of the Pain Catastrophizing Scale in patients with chronic low back pain for use in IndiaPain Med201617101848185826893110
- CronbachLEssentials of Psychological TestingNew YorkHarpers-Collins Publishers. Inc1990
- CicchettiDVGuidelines, criteria, and rules of thumb for evaluating normed and standardized assessment instruments in psychologyPsychol Assess199464284290
- BeatonDEBombardierCGuilleminFFerrazMBGuidelines for the process of cross-cultural adaptation of self-report measuresSpine (Phila Pa 1976)200025243186319111124735
- BeckATEpsteinNBrownGSteerRAAn inventory for measuring clinical anxiety: psychometric propertiesJ Consult Clin Psychol19885668938973204199
- KohrtBAKunzRDKoiralaNRSharmaVDNepalMKValidation of the Nepali version of the Beck Anxiety InventoryJ Inst Med200325114
- KohrtBASpeckmanRAKunzRDCulture in psychiatric epidemiology: using ethnography and multiple mediator models to assess the relationship of caste with depression and anxiety in NepalAnn Hum Biol200936326128019381985
- BeckATWardCHMendelsonMMockJErbaughJAn inventory for measuring depressionArch Gen Psychiatry1961456157113688369
- KohrtBAKunzRDKoiralaNRSharmaVDNepalMKValidation of a Nepali version of the Beck Depression InventoryNepalese J Psychiatry200224123130
- SharmaSPalanchokeJReedDHaxby AbbottJTranslation, cross-cultural adaptation and psychometric properties of the Nepali versions of numerical pain rating scale and global rating of changeHealth Qual Life Outcomes201715123629202878
- KamperSJMaherCGMackayGGlobal rating of change scales: a review of strengths and weaknesses and considerations for designJ Man Manip Ther200917316317020046623
- SharmaSPalanchokeJAbbottJHCross-cultural adaptation and validation of the translated Nepali version of the patient-specific functional scaleJ Orthop Sports Phys Ther2018In Press
- HeffordCAbbottJHBaxterGDArnoldROutcome measurement in clinical practice: practical and theoretical issues for health related quality of life (HRQOL) questionnairesPhys Ther Rev2011163155167
- HuLTBentlerPMCutoff criteria for fit indexes in covariance structure analysis: conventional criteria versus new alternativesStruct Equ Model199961155
- BlandJMAltmanDGMeasurement errorBMJ199631370597448819450
- MokkinkLBTerweeCBPatrickDLThe COSMIN checklist for assessing the methodological quality of studies on measurement properties of health status measurement instruments: an international Delphi studyQual Life Res201019453954920169472
- de VetHCWTerweeCBMokkinkLBKnolDLMeasurement in Medicine: A Practical GuideCambridge, UKCambridge University Press2011
- BlandJMAltmanDGStatistical methods for assessing agreement between two methods of clinical measurementLancet1986184763073102868172
- MokkinkLBTerweeCBPatrickDLCOSMIN Checklist Manual2012 Available from http://www.cosmin.nl
- BlandJMAltmanDGApplying the right statistics: analyses of measurement studiesUltrasound Obstet Gynecol2003221859312858311
- CohenJStatistical Power Analysis for the Behavioral SciencesHilsdale, NJLawrence Earlbaum Associates19882
- KarpinskiACDzurecLCFitzgeraldSMBromleyGEMeyersTWExamining the factor structure of the Pain Catastrophizing Scale (PCS) as a measure of victim response to the psychological pain of subtle workplace bullyingJ Nurs Meas201321226428324053056
- HuijerHAFaresSFrenchDJThe development and psychometric validation of an Arabic-language version of the Pain Catastrophizing ScalePain Res Manag20172017147279228190958
- European Burns Association 14th Annual CongressBurns201137Suppl 1S1S29
- BeatonDEUnderstanding the relevance of measured change through studies of responsivenessSpine (Phila Pa 1976)200025243192319911124736