
Abstract
Objective
The study objective was to determine use of pain-related health care resources and associated direct and indirect costs over a two-year period in cardiac surgery patients who developed chronic post-surgical pain (CPSP).
Methods
This multicentric observational prospective study recruited patients prior to cardiac surgery; these patients completed research assistant-administered questionnaires on pain and psychological characteristics at 6, 12 and 24 months post-operatively. Patients reporting CPSP also completed a one-month pain care record (PCR) (self-report diary) at each follow-up. Data were analyzed using descriptive statistics, multivariable logistic regression models, and generalized linear models with log link and gamma family adjusting for sociodemographic and pain intensity.
Results
Out of 1,247 patients, 18%, 13%, and 9% reported experiencing CPSP at 6, 12, and 24 months, respectively. Between 16% and 28% of CPSP patients reported utilizing health care resources for their pain over the follow-up period. Among all CPSP patients, mean monthly pain-related costs were CAN$207 at 6 months and significantly decreased thereafter. More severe pain and greater levels of pain catastrophizing were the most consistent predictors of health care utilization and costs.
Discussion
Health care costs associated with early management of CPSP after cardiac surgery seem attributable to a minority of patients and decrease over time for most of them. Results are novel in that they document for the first time the economic burden of CPSP in this population of patients. Longer follow-up time that would capture severe cases of CPSP as well as examination of costs associated with other surgical populations are warranted.
Summary
Economic burden of chronic post-surgical pain may be substantial but few patients utilize resources. Health utilization and costs are associated with pain and psychological characteristics.
Introduction
Pain after surgery is one of the most common causes of chronic pain.Citation3 Prevalence estimates of chronic post-surgical pain (CPSP) range from 10% to 70% up to one year after surgery, based on the type of surgical procedure studied and the definition of CPSP.Citation25,Citation41
The direct and indirect costs associated with chronic pain from any cause in the USA are estimated to range from US$560 to US$635 billion yearly, which is almost twice as much as for cardiovascular diseases or cancer.Citation13 These cost estimates are proportionally similar to those of European countries such as Ireland (€5.34 billion per year)Citation39 and Sweden (€32 billion per year).Citation20 Direct health-related costs (health care expenditures such as hospitalizations, drugs, physicians’ feesCitation10 are primarily fueled by hospitalization while indirect costs (associated with loss of life or livelihood such as absence from work, caregiver time)Citation10 are fueled primarily by social benefits (disability allowance, unemployment benefits).Citation39 In a Canadian study of patients waiting for multidisciplinary pain treatment, median 30-day pain-related direct and indirect costs were CAN$1,462 with time costs (defined in this study as all paid and unpaid time lost due to their pain valued in monetary terms) accounting for 84% of overall total costs.Citation15
Some data exist on the costs of surgical procedures or acute post-operative pain management. For example, average costs per patient associated with inadequate pain management following ambulatory surgeries have been estimated at US$1,869 for emergency visits and at US$13,902 for inpatient visits.Citation9 A thorough literature search did not provide any data on the economic burden (both direct and indirect) associated with CPSP exclusively. The rare studies that have estimated CPSP costs have typically used generic chronic pain economic data derived from general chronic pain population,Citation21,Citation22 used a mixed population of surgical and trauma patients,Citation36 or relied on medico-administrative databases with no precise CPSP diagnoses and no accounts of indirect costs.Citation53 For example, the institutional costs associated with CPSP at a major city university health network hospital have been estimated to range between CAN$2.5 million and CAN$4.1 million yearly.Citation22 Yearly direct and indirect costs associated with neuropathic pain months to years following trauma/surgery averaged at US$11,846 and US$29,617, respectively.Citation36
Some studies have examined predictors of health care costs among chronic pain patients but not specifically in those suffering from CPSP. While results are heterogeneous, persistent pain, pain interference, depressive symptoms, quality of life (QOL), previous health care costs and comorbidities have all been identified as significant predictors of high pain-related health care costs.Citation2,Citation11,Citation24 In addition, theoretical models, such as the Behavioral Model of Health Services Use,Citation1 can provide some useful guidance in the identification of predictors of health care costs.
The objectives of this study were 1) to determine pain-related direct and indirect costs over a two-year period among a cohort of patients who underwent cardiac surgery and experienced CPSP and 2) to identify predictors of health care use and costs. A cardiac surgical population was chosen given the high rates of CPSP typically associated with this type of major surgery.Citation19
Methods
Participants
The CARD-PAIN study has been previously described.Citation7 This observational longitudinal prospective study recruited participants from four Canadian-university affiliated cardiac surgery centers (ie, the Montreal Heart Institute, the Peter Munk Cardiac Center, the Institut universitaire de cardiologie et de pneumologie de Québec, and the Maritime Heart Center) between February 2005 and September 2009.Citation7 To be eligible to participate in the study patients had to: be aged 18 years or older; undergo coronary aortic bypass graft surgery and/or valve replacement using a median sternotomy approach; be seen at the preadmission surgery clinic; and be fluent in spoken and written French and/or English. Patients were excluded if they had a prior thoracotomy or mastectomy or if they were cognitively or physically unable to provide informed consent and/or to complete questionnaires.
Procedures and measures
The research ethics board of all four participating centers approved the study. Consecutive patients were screened for eligibility prior to surgery during the preadmission visit between February 8, 2005 and September 1, 2009. All participants provided written informed consent. Details of study procedures can be found elsewhereCitation7 and are briefly described below.
A costing evaluation was carried out on patients who reported CPSP. CPSP has been defined as pain at the surgery site present at least 3–6 months after surgery that was not present before surgery or a worsening of the pain post-operatively, that impacts on the patient’s life and that cannot be attributed to causes other than surgery.Citation54
Follow-ups
Participants completed questionnaires administered by a research assistant 6, 12 and 24 months post-operatively to measure pain intensity (11-point Numeric Rating Scale (NRSCitation23), QOL (SF-12v2 Health Survey (SF12v2),Citation51,Citation52 depression and anxiety (Hospital Anxiety and Depression Scale (HADS),Citation29,Citation42,Citation56 pain catastrophizing (Pain Catastrophizing Scale (PCS),Citation12,Citation46 and disability (Pain Disability Index (PDI)).Citation38
Pain Care Record (PCR)
The PCR was used to document patients’ utilization of health care resources specifically for their CPSP and associated costs (eg, drugs, physician visits). At 6, 12, and 24 months following surgery, patients who self-reported the presence of CPSP were mailed the PCR along with a pre-stamped envelope and asked to fill it on a daily basis over a period of one month. Patients were requested to report all medications and supplies they consumed due to CPSP and their costs (if applicable), appointments outside of their home for their CPSP (type of appointment, amount paid, method of travel, parking costs, distanced traveled), emergency room visits, hospitalizations, required household help, and time patients and/or their caregivers devoted to receiving and providing care for CPSP (total of hours, number of hours taken away from employment, type of care, etc.). Upon completion of the PCR, a research assistant contacted patients by phone to validate and ensure completeness of the information provided.
The PCR is an adapted version of the Ambulatory and Home Care Record©17 which assesses health care utilization for patients with both short-term and long-term care needs.Citation16,Citation18,Citation28,Citation45 The PCR has been used in an earlier study and was found to be a very useful instrument for measuring chronic pain costs.Citation15
Costing
Physician and laboratory resource use was based on the PCR with unit prices determined using fee-for-service rate schedules from the Ontario Ministry of Health and Long Term Care.Citation31 Hospitalization costs were derived from the data within the Ontario Case Costing Initiative for fiscal year 2010–2011.Citation32 Drug costs were based on the cost reported by patients’ PCR. The cost of travel by car was calculated by multiplying the distance to and from the health care provider by the cost per kilometer (CAN$0.43/km) reported by the Canadian Automobile Association.Citation5
Remaining costs included participants’ out-of-pocket expenses, insurance reimbursements and time costs. The cost of all remaining expenses (eg, over-the-counter medications, visits to health care professionals not covered, other travel costs, privately financed health care appointments, and household help) was determined using the self-reported dollar value on the PCR. A total out-of-pocket cost was calculated for each patient by summing the amounts reported and then subtracting any reimbursements received by the care recipient or the family from insurance plans. Reimbursements were then subsequently differentiated as being either publicly or privately financed.
Time costs, defined as all paid and unpaid time lost by the patients and/or their caregiver due to patients’ CPSP valued in monetary terms, were determined by assigning a monetary value to each unit of time using a human capital approach.Citation40,Citation49 This approach applies current average earnings to lost time. To value time lost by patients, we multiplied the 2016 average hourly wage rate for Non-Aboriginal Canadians by the number of hours they reported losing due to CPSP.Citation43 Time costs incurred by caregivers were estimated by multiplying the average hourly rate by the number of hours lost by caregivers due to the patients’ CPSP. All costs were inflated using published Consumer Price Indexes and reported in 2016 Canadian dollars (CAN$).Citation44
Data analysis
All analyses were conducted using SAS (version 9.4, SAS Institute Inc., Cary, NC). Differences between CPSP patients who did and did not complete the PCR at 6-, 12- and/or 24-month follow-ups in terms of sociodemographic and pain-related outcomes were examined using chi-square tests and t-tests. Patients’ resource utilization due to CPSP at each follow-up was examined as: 1) absolute and relative frequencies and 2) mean (standard deviation [SD]) costs incurred (monetary value) by patients and/or their caregivers due to CPSP. Results were also stratified according to patients’ reported pain intensity (ie, mild [1–3 on a 10-point NRS] vs moderate to severe [4–10 on a 10-point NRS]).Citation14
The proportions of individuals utilizing resources as a function of their pain intensity were compared using chi-squared tests or Fisher’s exact test. The relationships between predictors of resource utilization and their total monetary value were examined with the use of three distinct models, one for each follow-up time point. A multi-variable logistic regression model was used to assess the relationships between the use of resources and selected independent predictors. A generalized linear model with a log link and gamma family was used to examine the relationships between the monetary value of the utilized resources and independent predictors selected based on the existing literature on risk factors for the development of CPSP;Citation4,Citation25 they included: participants’ age, sex, tendency to catastrophize in the face of pain (PCS scores) and pain intensity at the follow-up time point. In addition, for regression models examining the use and monetary value of resources utilized at 12 and 24 months, resource use at the previous follow-up time point(s) was included using a categorical variable (ie, prior use; no prior use; or not applicable for individuals reporting no CPSP at the previous follow-up).
As a sensitivity analysis, multiple imputation of missing data utilizing chained equations was performed (more details regarding the imputation method and results are provided in Supplementary material).Citation55
Results
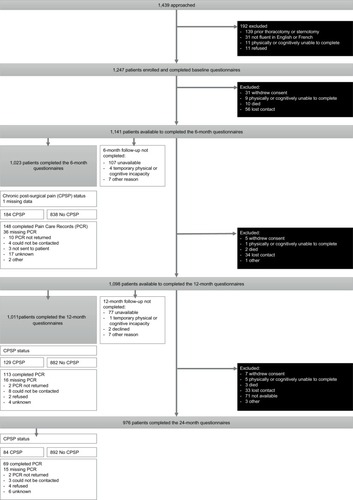
A total of 1,247 patients participated in the CARD-PAIN studyCitation7 and 1,071 completed at least two time points.Citation35 The CARD-PAIN sample was predominantly male (79%), with a mean age of 61.9 years (SD=10.2), and most participants underwent a coronary artery bypass grafting (CABG) procedure with or without a valve replacement (VR) (77%). A detailed description of these patients is available elsewhere.Citation35 Only patients who reported suffering from CPSP at the 6-, 12- and/or 24-month follow-ups were included in the present study, and data collected at each time point were analyzed independently to maximize sample size. Briefly, 18%, 13% and 9% of patients reported suffering from CPSP at 6-, 12-, and 24-month follow-ups, respectively ().
Figure 1 Study flow diagram.
shows the sociodemographic and pain characteristics of each subset of patients. Results reveal that about two thirds of participants who reported CPSP were not actively employed at the time of follow-up and just over half reported suffering from moderate to severe CPSP at each of the three follow-ups (53%, 54% and 48% at the 6-, 12- and 24-month follow-ups, respectively). While 22% of the overall study sample were females, 30% of patients who reported having CPSP were female.
Table 1 Characteristics of patients reporting chronic post-surgical pain who have completed the pain care record at the 6-, 12- and/or 24-month follow-up
Resource utilization and time lost due to CPSP
PCR response rate
Respectively, 80%, 88% and 82% of the patients who reported suffering from CPSP at 6-, 12- and/or 24-month follow-ups answered the PCR. Respondents and non-respondents did not show any significant differences in terms of socio-demographics, pain characteristics, and health-related QOL (all P>0.05) (data not shown).
Categories of resource utilization and time lost due to CPSP
provides the proportion of patients who reported health care resource utilization and loss of time due to their CPSP. Time lost included time lost from paid work and leisure for patients and time lost from leisure and due to household work for patients’ caregivers. A total of 21%, 28% and 16% of participants at the 6-, 12- and 24-month follow-ups, respectively, reported time losses due to their CPSP. At all three time-points, pain medication paid out-of-pocket was the most commonly reported resource (15%, 20% and 15% of the patients).
Table 2 Proportion of individuals utilizing health care resources or reporting time lost due to chronic post-surgical pain at the (A) 6-, (B) 12- and (C) 24-month follow-up
When patients were stratified according to CPSP severity, no significant difference was found at 6-month follow-up in the proportion of those reporting health care resource utilization and time lost (mild pain: 16% vs moderate to severe pain: 26%, P=0.14; ). However, resource utilization and time lost were greater in patients suffering from moderate to severe pain than in patients with mild pain at both 12-month follow-up (41% vs 14%, P<0.01; ) and 24-month follow-up (27% vs 6%, P=0.02; ).
Direct and indirect care costs
shows the monthly mean monetary values of resource utilization and time lost in patients reporting CPSP at the 6-, 12- and 24-month follow-ups. Results indicate that these values dropped over time, from CAN$207.26 at 6-month to CAN$100.13 at 12-month and CAN$7.68 at 24-month follow-up. When focusing solely on patients who utilized resources, the economic burden of CPSP is substantially higher (monthly mean cost of CAN$989.52, CAN$353.60 and CAN$48.17 at the 6-, 12- and 24-month follow-ups, respectively). Breakdowns within cost components indicate that time costs were the most important ones at both 6- and 12-month follow-ups, accounting for 83% and 69% of the total costs, respectively. At 24-month follow-up however, out-of-pocket expenses accounted for 83% of total costs while time costs accounted for only 10%.
Table 3 Monthly costs in patients suffering from chronic post-surgical pain at the 6-, 12- and/or 24-month follow-up
Costs at the 6-, 12- and 24-month follow-ups were also stratified according to patients’ pain intensity (). At all follow-up times, expenses reported by patients suffering from moderate to severe pain were greater than in patients with mild pain (at the 6-month follow-up, CAN$377 [CAN$1,362] vs CAN$18 [CAN$61], P<0.01; at the 12-month follow-up, CAN$183 [CAN$815] vs CAN$3 [CAN$12], P<0.01; at the 24-month follow-up, CAN$14 [CAN$37] vs CAN$2 [CAN$12], P< 0.01).
Predictors of resource utilization, time lost and costs
Results of the regression models indicated that the independent factors that predicted the use vs non-use of resources and reported time lost and those predicting care and time lost costs among users and non-users differed at each of follow-up time (). At the 6-month follow-up, women and patients with a greater tendency to catastrophize in the face of pain were more likely to have utilized resources/lost time for CPSP care. Significant predictors of higher costs included greater levels of pain catastrophizing and greater pain severity ().
Table 4 Predictors of resource use/time lost (logistic regression model results) and overall costs (generalized linear model with a gamma family and log link function results)
At 12-month follow-up, patients reporting moderate to severe pain were more likely to utilize resources for their CPSP. Use of health care resources at 6 months was also a significant predictor of patients’ use at 12 months. However, none of the examined predictors of costs reached statistical significance (all P≥0.245; ).
At 24-month follow-up, greater pain intensity was the only statistically significant predictor of resource utilization (). With regard to direct/indirect costs, they were higher in patients exhibiting greater levels of pain catastrophizing. Finally, presence of CPSP and use of health care resources at 12 months were both significant predictors of costs at 24 months.
Multiple imputation
Results of the multiple imputation were aligned with the non-imputed results and supported our conclusions (–).
Discussion
Between 16% and 28% of patients with CPSP reported utilizing health care resources for their pain over the follow-up period. Among all CPSP patients, mean monthly pain-related direct and indirect costs were CAN$207 at 6 months and decreased thereafter. One important finding pertains to the low proportion of CPSP patients who reported costs. When focusing solely on patients who reported health-related costs/time losses, the financial burden of CPSP is substantially higher (monthly mean cost of CAN$990 at 6-month followup). While cost estimates appear low, it remains an important economic burden considering that 2.46 million surgeries are performed on average per year in Canada.Citation47
Low overall health care use and time lost at all time points
The low proportion of CPSP patients who reported health-related costs/time losses could reflect demographic, etiologic or health status characteristics. First, patients in this cardiac surgery study were older (mean age =62 years old) compared to another study of economic burden of chronic pain (mean age = 49 years old).Citation15 One may speculate that when patients get older, they tend to consider that pain is a “normal” part of agingCitation30,Citation48 and may be less likely than younger patients to access health care resources. In addition, patients in this study had a cardiac condition that led to the surgical procedure. It is possible that they may be more preoccupied by their cardiac condition (as may be their physician) than by their CPSP. The impact of the CPSP on patient QOL might also have influenced patterns of resource utilization. In this study, cardiac CPSP patients reported lower overall and physical health-related QOL compared to the general USA populationCitation52 but higher than that of other chronic pain populations.Citation6,Citation26 Mental health-related QOL in this study however appeared comparable to that of the general USA population.Citation52 Better overall health-related QOL than most chronic pain populations could thus also explain, at least in part, lower care costs found in this study.
Low overall costs associated with CPSP
Overall costs reported in this study are lower than those reported in other chronic pain populations. As stated previously, average costs across all CPSP patients are very low (CAN$207), mainly because a large proportion of these patients are not utilizing resources or losing time due to their CPSP. This might be because their QOL is not significantly impacted by their CPSP experience. Study results showed that costs of CPSP over the first two years following surgery are also much lower than those of patients waiting for chronic pain multidisciplinary treatments obtained using the same data collection tool (PCR), with median monthly cost approximating CAN$1,462.Citation15 Study results highlight that a subset of study patients account for the vast majority of reported costs. Those high health care utilizers might be the ones who will later on continue to be high health care utilizers and contribute to the high health care costs of chronic pain found in these other studies.Citation13,Citation15 In fact, a recent study of costs associated with treatment of neuropathic pain among post-trauma and post-surgery patients showed monthly direct and indirect costs totaling on average US$3,455 per patient.Citation36 More than 90% of these patients were recruited from medical settings and were more than 2 years post-trauma or surgery. Although these US long-term costs may not directly reflect the long-term Canadian values, they highlight the potential long-term importance of our findings.
Utilization trends
Beyond the relatively low utilization of resources, a more important result regards its evolution over time; at 6 months, one in five patients (21%) reported utilizing resources/losing time due to their CPSP; this fraction increases to a high of over one in four (28%) at 12 months, and drops to a low of one in six (16%) at 24 months (). Such a relation may be explained by the fact that, at 6 months, patients still consider CPSP as “normal” and therefore do not address the issue. When pain lingers for a few additional months however, patients might become more pro-active in managing CPSP and attempt to resolve it. Finally, by two years post-surgery, many treatment options may have been exhausted; patients still suffering from CPSP may revert to a passive approach to their pain and refrain from further consultations or ineffective treatments. It is also possible that the decreased proportion of CPSP patients who report moderate to severe CPSP influence health care utilization over time. This is an important consideration in light of the association between pain intensity and health care utilization at 12 and 24 months.
Primary sources of reported costs
Types of resources utilized by patients suffering from CPSP also warrant further discussion. Indeed, we notice that drugs paid-out-of-pocket were the most commonly utilized resource at all three follow-ups. This makes sense given that pharmacological approaches to managing peri- and acute postoperative pain are the central elements to treatment.Citation8 While drugs paid-out-of-pocket was the most commonly utilized resource, it was not the most costly. Indeed, the most significant contributor to the overall cost associated with CPSP was patients’ time loss from work (CAN$124). This was also the case in the study of Guerriere et alCitation15 (CAN$1,613). In addition to differences in recruitment sites (surgical vs waitlist of tertiary care multidisciplinary pain settings) and pain duration (median pain duration of 5 years), one factor that might contribute to this cost difference is the employment status differences between the two samples. In the current study, 37% of patients were retired while this was the case for only 14% of patients in the study of Guerriere et al.Citation15
Predictors of health care utilization/time lost and associated costs
With regards to predictors of use vs non-use of health care resource utilization and direct/indirect costs, none of the variables examined in this study was a consistent predictor of either outcome at the three follow-up time points. Nevertheless, we were able to identify several significant predictors at each follow-up time point.
Pain intensity
Consistent with other studies among chronic pain patients,Citation13,Citation27,Citation37 pain intensity was associated with health care utilization and other incurred costs. For example, in a study of 1,703 neuropathic pain patients, pain intensity significantly predicted total pain-related health care costs, direct costs, and indirect costs.Citation37
Prior health care utilization
Prior health care utilization has also been found to predict future health care costs among chronic pain patients.Citation2 It is possible that patients with prior pain who do not respond to treatment will continue to access the health care system in an attempt to find a solution that will provide them with pain relief.
Catastrophizing
A greater tendency to catastrophize in the face of pain was also a significant predictor of higher health care utilization and costs. This construct has been associated with many different aspects of the patient pain experience. Increased pain-related distress among individuals with high levels of pain catastrophizing might be a strong motivator for health care consultations. In fact, anxiety generally has been associated with health care utilization.Citation50
Study limitations
Our study has several limitations that we must acknowledge. First, results pertain to the economic burden of CPSP following cardiac surgery and cannot be generalized to other types of CPSP. Second, patients completed a one-month PCR at three distinct time points. Deriving costs using a one-month data collection may have resulted in overestimation or underestimation of expenses, as resource utilization rates may change over time. Third, our results were based on patient-reported data that could be subject to recall and information biases that could have over- or under-estimated costs. However, it is important to point out that research assistants carefully reviewed all completed PCR at the three time points and contacted on each occasion all participants by phone to validate and ensure completeness of the information or clarify certain points. Last, despite the overall large study sample size, results of our regression analyses used to identify significant predictors of resource utilization due to CPSP and direct/indirect costs are based on a relatively small sample size that may have reduced the power of our statistical analyses. Though we recognized this limit, this cohort of patients represents the largest Canadian sample of cardiac surgery patients suffering from CPSP to date.
Conclusion
This is the first study to have examined pain-related direct and indirect costs in a large sample of cardiac surgery patients who have developed CPSP. Despite low average costs among patients reporting CPSP, results reveal that most of these costs were attributed to a small proportion of patients. Costs of CPSP peaked one year after surgery and were mainly due to patients’/care givers’ time devoted to receiving and providing care. Health care utilization patterns and costs seem to depend not only on CPSP pain severity but also on psychological factors (pain catastrophizing). These results highlight the need to better understand how CPSP, psychological characteristics and their associations with health care utilization and costs evolve over time and how such characteristics can help to identify heavy health care utilizers. It will also be important to investigate these issues in other surgical populations.
Acknowledgments
The CARD-PAIN study was supported by grants received from the Canadian Institutes of Health Research (CIHR grant no MOP-69065) as well as from the Research Foundation of the Montreal Heart Institute. MGP was a recipient of a CIHR post-doctoral research fellowship.
Supplementary materials
Description of the multiple imputation sensitivity analysis
Given the modest sample size, the variables at 6, 12 and 24 months were imputed separately. Moreover, some categories of categorical variables (ie, participants’ work status) and cost categories (ie, total public costs, total out-of-pocket costs, total private insurance costs and total costs) were collapsed to obtain convergence of the imputation models. For each imputation model, only the data for subjects reporting any pain were considered.
The variables included in the imputation models were participants’ sex, age, work status (full- or part-time job, retired, other), education, pain intensity in the past 7 days, QOL physical summary, QOL mental summary, PDI score, PCS score, depression, anxiety, total public costs, total out of pocket expenses, total private insurance costs, total time cost, and resource utilization at prior visit (no, yes, not applicable – only for the 12- and 24-month models). Work status was imputed using a multinomial logistic regression model with a generalized logit link; education was imputed using an ordinal logistic regression model with a cumulative logit link; all continuous variables were imputed using predictive mean matching based on a linear regression model; and resource utilization at prior visit was imputed using a multinomial logistic regression model with a generalized logit link and performing data augmentation. This data augmentation adds a few pseudo observations to the data in a manner that biases associations towards the null and improves the stability of the estimation when data are sparse. One hundred imputed datasets were produced for each model.
Table S1 Average monetary value of resource utilized and time lost due to chronic post-surgical pain at the (A) 6-, (B) 12- and (C) 24-month follow-up, stratified by pain intensity
Table S2 Proportion of individuals utilizing medical resources or reporting time losses at the (A) 6-, (B) 12- and (C) 24-month followup obtained through multiple imputations
Table S3 Per patient average cost of resource utilized and time lost due to pain at the 6, 12 and 24 month follow-up obtained through multiple imputations
Table S4 Per patient average cost of medical resource utilized and time lost due to pain at the (A) 6, (B) 12 and (C) 24 month followup, stratified by pain level and obtained through multiple imputation
Table S5 Results obtained through multiple imputations for the two-part models for the probability of utilizing resources and the monetary value of the utilized resource at the (A) 6, (B) 12 and (C) 24 month follow-up
Disclosure
The authors report no conflicts of interest in this work.
References
- AndersenRMDavidsonPLImproving access to care in America: Individual and contextual indicatorsChanging the US Health Care System: Key Issues in Health Services, Policy, and ManagementAndersenRRiceTKominskiESan FranciscoJossey-Bass2001330
- AntakyELalondeLSchnitzerMEIdentifying heavy health care users among primary care patients with chronic non-cancer painCan J Pain2017112236
- BreivikHCollettBVentafriddaVCohenRGallacherDSurvey of chronic pain in Europe: prevalence, impact on daily life, and treatmentEur J Pain200610428733316095934
- BurnsLCRitvoSEFergusonMKClarkeHSeltzerZKatzJPain catastrophizing as a risk factor for chronic pain after total knee arthro-plasty: a systematic reviewJ Pain Res20158213225609995
- Canadian Automobile Association [webpage on the Internet]CAA Driving Costs Calculator2017 Available from: http://caa.ca/car_costsAccessed March 9, 2017
- ChoinièreMWareMAPagéMGDevelopment and Implementation of a Registry of Patients Attending Multidisciplinary Pain Treatment Clinics: The Quebec Pain RegistryPain Res Manag2017812381228280406
- ChoinièreMWatt-WatsonJVictorJCPrevalence of and risk factors for persistent postoperative nonanginal pain after cardiac surgery: a 2-year prospective multicentre studyCMAJ20141867E213E22324566643
- ChouRGordonDBde Leon-CasasolaOAManagement of Postoperative Pain: A Clinical Practice Guideline From the American Pain Society, the American Society of Regional Anesthesia and Pain Medicine, and the American Society of Anesthesiologists’ Committee on Regional Anesthesia, Executive Committee, and Administrative CouncilJ Pain201617213115726827847
- ColeyKCWilliamsBADaposSVChenCSmithRBRetrospective evaluation of unanticipated admissions and readmissions after same day surgery and associated costsJ Clin Anesth200214534935312208439
- EisenbergJMClinical economics. A guide to the economic analysis of clinical practicesJAMA198926220287928862509745
- EngelCCvon KorffMKatonWJBack pain in primary care: predictors of high health-care costsPain1996652–31972048826507
- FrenchDJNoëlMVigneauFFrenchJACyrCPEvansRTA French-language, French-Canadian adaptation of the Pain Catastrophizing ScaleCan J Behav Sci200537181192
- GaskinDJRichardPThe economic costs of pain in the United StatesJ Pain201213871572422607834
- GerbershagenHJRothaugJKalkmanCJMeissnerWDetermination of moderate-to-severe postoperative pain on the numeric rating scale: a cut-off point analysis applying four different methodsBr J Anaesth2011107461962621724620
- GuerriereDNChoinièreMDionDThe Canadian STOP-PAIN project - Part 2: What is the cost of pain for patients on wait-lists of multidisciplinary pain treatment facilities?Can J Anaesth201057654955820414821
- GuerriereDNTullisEUngarWJEconomic burden of ambulatory and home-based care for adults with cystic fibrosisTreat Respir Med20065535135916928148
- GuerriereDNUngarWJCoreyMEvaluation of the ambulatory and home care record: Agreement between self-reports and administrative dataInt J Technol Assess Health Care200622220321016571196
- GuerriereDNWongAYCroxfordRLeongVWMcKeeverPCoytePCCosts and determinants of privately financed home-based health care in Ontario, CanadaHealth Soc Care Community200816212613618290978
- Guimarães-PereiraLReisPAbelhaFAzevedoLFCastro-LopesJMPersistent postoperative pain after cardiac surgery: a systematic review with meta-analysis regarding incidence and pain intensityPain2017158101869188528767509
- GustavssonABjorkmanJLjungcrantzCSocio-economic burden of patients with a diagnosis related to chronic pain – register data of 840,000 Swedish patientsEur J Pain201216228929922323381
- HoganMETaddioAKatzJShahVKrahnMHealth utilities in people with chronic pain using a population-level survey and linked health care administrative dataPain2017158340841627902568
- HuangAAzamASegalSChronic postsurgical pain and persistent opioid use following surgery: the need for a transitional pain servicePain Manag20166543544327381204
- JensenMPKarolyPSelf-report scales and procedures for assessing pain in adultsTurkDCMelzackRHandbook of Pain Assessment2nd edNew YorkGuilford Press20011534
- JonsdottirTJonsdottirHLindalEOskarssonGKGunnarsdottirSPredictors for chronic pain-related health care utilization: a cross-sectional nationwide study in IcelandHealth Expect20151862704271925059634
- KatzJSeltzerZTransition from acute to chronic postsurgical pain: risk factors and protective factorsExpert Rev Neurother20099572374419402781
- LaméIEPetersMLVlaeyenJWKleefMPatijnJQuality of life in chronic pain is more associated with beliefs about pain, than with pain intensityEur J Pain200591152415629870
- LangleyPCThe societal burden of pain in Germany: health-related quality-of-life, health status and direct medical costsJ Med Econ20121561201121522835007
- LeongVWGuerriereDNCroxfordRCoytePCThe Magnitude, Share and Determinants of Private Costs Incurred by Clients (and Their Caregivers) of In-home Publicly Financed CareHealthc Policy200731e14115919305748
- LépineJPGodchauMBrunPLempérièreTEvaluation of anxiety and depression among patients hospitalized on an internal medicine serviceAnn Med Psychol19851432175189
- MakrisUEHigashiRTMarksEGAgeism, negative attitudes, and competing co-morbidities – why older adults may not seek care for restricting back pain: a qualitative studyBMC Geriatr2015153925887905
- Ministry of Health and Long-Term Care Ontario [webpage on the Internet]OHIP Schedule of Benef its and Fees2016 [cited April 3, 2017] Available from: www.health.gov.on.ca/en/pro/programs/ohip/sobAccessed October 2, 2018
- Ministry of Health and Long-Term Care Ontario [webpage on the Internet]Health Data Branch Web Portal2017 [cited April 14, 2017] Available from: https.//hsim.health.gov.on.ca/hdbportal/
- MurphyBMElliottPCHigginsROAnxiety and depression after coronary artery bypass graft surgery: most get better, some get worseEur J Cardiovasc Prev Rehabil200815443444018677168
- MurphyBMElliottPCWorcesterMUTrajectories and predictors of anxiety and depression in women during the 12 months following an acute cardiac eventBr J Health Psychol200813Pt 113515317535492
- PagéMGWatt-WatsonJChoinièreMDo depression and anxiety profiles over time predict persistent post-surgical pain? A study in cardiac surgery patientsEur J Pain201721696597628185371
- ParsonsBSchaeferCMannREconomic and humanistic burden of post-trauma and post-surgical neuropathic pain among adults in the United StatesJ Pain Res2013645946923825931
- PérezCNavarroASaldañaMTWilsonKRejasJModeling the predictive value of pain intensity on costs and resources utilization in patients with peripheral neuropathic painClin J Pain201531327327924762867
- PollardCAPreliminary validity study of the pain disability indexPercept Mot Skills19845939746240632
- RafteryMNRyanPNormandCMurphyAWde La HarpeDMcGuireBEThe economic cost of chronic noncancer pain in Ireland: results from the PRIME study, part 2J Pain201213213914522300900
- RiceDPMacKenzieJJonesASCost of injury in the United States: a report to CongressSan FranciscoInstitute for Health and Aging, University of California Injury Prevention Centre, Johns Hopkins University1989
- SchugSAPogatzki-ZahnEMChronic Pain after Surgery or InjuryPain2011XIX115
- SnaithRPZigmondASThe Hospital Anxiety and Depression Scale -ManualWindsor, UKNFER-Nelson1994
- Statistics Canada [webpage on the Internet]Average hourly wages of employees by selected characteristics and occupation, unadjusted data, by province (monthly) (Canada)2017 [cited February 10, 2017] Available from: http://www.statcan.gc.ca/tables-tableaux/sum-som/l01/cst01/labr69a-eng.htmAccessed October 2, 2018
- Statistics Canada [webpage on the Internet]Consumer Price Index, historical summary (1997 to 2016) 2017 [cited September 29, 2017 Available from: http://www.statcan.gc.ca/tables-tableaux/sum-som/l01/cst01/econ46a-eng.htmAccessed August 1, 2018
- StevensBGuerriereDMcKeeverPEconomics of home vs. hospital breastfeeding support for newbornsJ Adv Nurs200653223324316422722
- SullivanMJLBishopSRPivikJThe Pain Catastrophizing Scale: Development and validationPsychol Assess199574524532
- The Lancet Commission on Global Surgery [webpage on the Internet]Number of surgical procedures2017 [cited October 26, 2017] Available from: https://data.worldbank.org/indicator/SH.SGR.PROC.P5?locations=CAAccessed October 2, 2018
- ThielkeSSaleJReidMCAging: are these 4 pain myths complicating care?J Fam Pract2012611166667023256096
- TorgersonDJDonaldsonCReidDMPrivate versus social opportunity cost of time: valuing time in the demand for health careHealth Econ1994331491557921058
- VerstappenSMVerkleijHBijlsmaJWDeterminants of direct costs in Dutch rheumatoid arthritis patientsAnn Rheum Dis200463781782415194577
- WareJKosinskiMKellerSDA 12-Item Short-Form Health Survey: construction of scales and preliminary tests of reliability and validityMed Care19963432202338628042
- WareJEKosinskiMTurner-BowkerDMGandekBHow to Score Version 2 of the SF-12 Health Survey2004Boston, MAQualityMetric Inc, Lincoln: RI and Health Assessment Lab
- WeirSSamnalievMKuoTCThe incidence and healthcare costs of persistent postoperative pain following lumbar spine surgery in the UK: a cohort study using the Clinical Practice Research Datalink (CPRD) and Hospital Episode Statistics (HES)BMJ Open201779e017585
- WernerMUKongsgaardUEI. Defining persistent post-surgical pain: is an update required?Br J Anaesth201411311424554546
- WhiteIRRoystonPWoodAMMultiple imputation using chained equations: Issues and guidance for practiceStat Med201130437739921225900
- ZigmondASSnaithRPThe hospital anxiety and depression scaleActa Psychiatr Scand19836763613706880820