Abstract
Pain drawings are often utilized in the documentation of pain conditions. The aim here was to investigate intra- and inter-rater reliability of area measurements performed on pain drawings consecutively, using the computer program Quantify One. Forty-eight patients with chronic nonmalignant pain had shaded in their experienced pain on the front and back views of a pain drawing. The templates were scanned and displayed on a 17-inch computer screen. Two independent examiners systematically encircled the shaded-in areas of the pain drawings with help of a computer mouse, twice each on two separate days, respectively. With this method it is possible to encircle each marked area and to obtain immediate details of its size. The total surface area (mm2) was calculated for each pain drawing measurement. Each examiner measured about 2400 areas, and as a whole, the number of areas measured varied only by 3%. The intra-rater reliability was high with intraclass correlation coefficients 0.992 in Examiner A and 0.998 in Examiner B. The intra-individual absolute differences were small within patients within one examiner as well as between the two examiners. The inter-rater reliability was also high. Still, significant differences in the absolute mean areas (13%) were seen between the two examiners in the second to fourth measurement sessions, indicating that one of the examiners measured systematically less. The measurement error was ≤10%, indicating that use of the program would be advantageous both in clinical practice and in research, but if repeated, preferably with the same examiner. Since pain drawings with this method are digitized, high quality data without loss of information is possible to store in electronic medical records for later analysis, both regarding precise location and size of pain area. We conclude that the computer program Quantify One is a reliable method to calculate the areas of pain drawings.
Introduction
Pain drawings are often utilized in the assessment, diagnosis, and documentation of pain conditions both regarding physical and psychological components,Citation1–Citation11 or evaluating a particular treatment.Citation12 However, further information such as taking a history and performing a physical examination,Citation5,Citation13 is usually necessary and must be added.
Pain drawings vary in design, but are all based on the same principle: a human line drawing usually anterior and posterior views. Patients are asked to shade-in the body areas where they experience pain using a pencil,Citation5,Citation6 or to mark the areas with different colorsCitation7 or symbols for pain.Citation10,Citation14 To assess exactly how large an area is pain-affected and to see the precise delineations can be difficult.
There are different methods of rating a pain drawing.Citation15 One of the first assesses the patient according to a point scale where 0–2 points is deemed normal, and above 2 indicates an abnormal or excessive pain manifestation.Citation10 Margolis and coworkers,Citation6 split up the drawing into 45 areas and assess which and how many are marked. Another method places a squared overlay on the drawing and assesses the number of shaded-in squares,Citation16 and thereby the extent of the painful area. These manual methods have demonstrated a high intra- and inter-rater reliability, also in a test–retest situation.Citation14,Citation17 However, the described methods are complicated and time consuming, and the calculated area is not precise. In spite of this, many pain clinics use qualitative assessments of pain drawings in their clinical work, and if using quantitative assessments these are usually backed by manikin templates.Citation18
There are indications that computer programs rate pain drawings with higher accuracy than a subjectively performed manual rating. For this reason, a number of different software programs have been developed that can help with the evaluation of pain drawings.Citation5,Citation13,Citation19 Quantify OneCitation20 is a computerized measuring instrument, developed to use in the rating of pain drawings to interpret research results and in clinical practice.Citation21 Pain drawings may well be evaluated by a number of different examiners and at varying intervals; it is thus extremely important that the rating be reliable.
To our knowledge, no reliability tests of this program have been performed. The aim of the present study was to investigate the intra- and inter-rater reliability of measurements performed on pain drawings, using the computer program Quantify One on two different occasions by two examiners. If its reliability was found to be high, and the time consumption was limited, the method would facilitate the registration of pain drawings in the clinic and increase the possibility of documenting and communicating results quantitatively and electronically.
Material and methods
Pain drawings
The material consisted of 48 pain drawings filled in by consecutive patients referred to a specialist university pain clinic for evaluation of chronic nonmalignant pain conditions. The patients had participated in an earlier study on pain outcome measures. The pain diagnoses were categorized as: myalgia, psychalgia, neuralgia, lumbago, thoracalgia, cervicalgia, and other. The painful shaded-in areas were assessed by ALP, a physiotherapist experienced in pain management, who also clarified the areas that were not distinctly demarcated. The main purpose was to create a set of pain drawings from clinical data testable for computerized surface area estimation.
Computer program Quantify One
Quantify OneCitation20 is a computer program, developed for the purpose of performing fast and repeated calculations of area, length, and perimeter on scanned surfaces of lab results by moving a cursor on the computer screen with the help of a computer mouse. The program runs on a standard personal computer with at least an 80 GB hard disc, processor speed Pentium 4, and Microsoft Windows XP Professional.
Computer settings
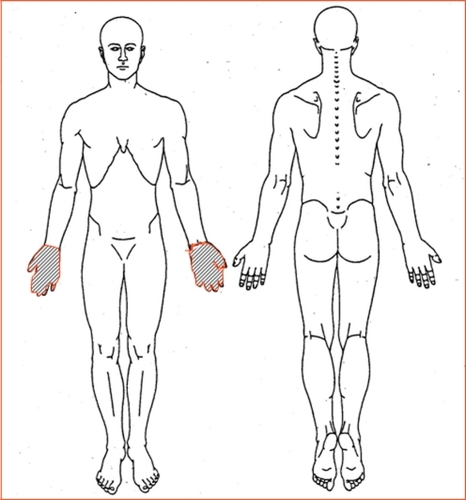
The shaded-in A4 size pain drawings were scannedCitation22 (HP Scanjet 5530, screen resolution 2400 dpi × 4800 dpi) into the Quantify One program. The pain drawing () outline was adjusted to be displayed in whole at maximum screen size (17-inch screen), which made it 86% of the original outline size (14.5 cm). The scanning resolution was set to 100 dpi, and the scale to body height 175 cm equaled 14.5 cm. To facilitate control of the mouse’s movements, the speed level was specified by choosing speed level 4 out of 10 possible levels. The mouse hardware was a Microsoft PS/2 HID-compliant mouse, and a plastic blue desk pad size 50 cm × 65 cm was used as a mouse-pad. There was a one to one relation (standard) between the movement of the mouse and the cursor movement on the screen. We chose the mode “continuous area” to mark the shaded areas.
Figure 1 The pain drawing used for this study.
Examiner training session
All measurements were carried out by two physiotherapy students (Examiner A and Examiner B), both of whom took part in a preliminary training session to practice using the method and to familiarize themselves with the apparatus. On this occasion, five pain drawings were marked, and calculations showed that it took about 1 minute per drawing to perform a measurement.
Protocol
Before the project measurement sessions were started, it was agreed that the examiners should encircle the shaded areas systematically from the top downwards on the screen, from head to feet and from left to right on the figure. Once a drawing had been marked, the next one was brought up and dealt with in the same way. After marking five drawings, the examiner took a short break before dealing with the next five, and continued in this way until all 48 drawings had been dealt with. On day 1, Examiner A first dealt with all 48 pain drawings alone and unassisted. She brought up the drawings on the screen, one at a time, and encircled the shaded-in areas. With the help of the mouse, each shaded part was then encircled, and its area in mm2 was displayed on the screen and saved in a Microsoft Excel file. Examiner B then took over and performed the same procedure, also alone and unassisted. The total shaded-in area for each pain drawing was used for presenting the results. The software has an option where it is possible to correct the first lines drawn with the mouse in an enlarged correction mode, but that was not used here due to time constraints. Four measurement sessions were then performed on the same day, twice by each examiner alternately, ie, ABAB. This procedure was repeated 1 week later in reverse order, giving in total eight measurement sessions.
Statistical analysis
The areas of the shaded-in regions on the pain drawings were calculated by the computer program and recorded in mm2. Mean values and 95% confidence intervals (95% CI) were calculated. Student’s paired t-test was used for group comparisons. The P-value was set to 0.01.
In research, the term reliability means ‘repeatability’ or ‘consistency’. We estimated the reliability as the correlation between four observations of the same measure. The intraclass correlation coefficient (ICC) with 95% CI was used to measure test–retest reliability between each examiner’s four measurements and inter-rater reliability between the two examiners’ measurements. The measurement error was analyzed and then presented as the absolute maximal difference between the mean values for examiners A and B together with ±1 standard deviation (SD) for all four sessions. To compensate for possible learning effects, calculations not including the first set of measurements were also made. The data were analyzed with the help of Statistical Package for the Social Sciences (SPSS, version 15).
Results
Pain drawings
The number of areas that had been shaded-in on a single pain drawing varied between 1 and 26 areas. Each of the two examiners performed four measurement sessions on the 48 drawings. In total, 384 drawings were measured, and each examiner measured about 2400 areas. Hence each drawing contained on the average 6.25 separate areas. However, a control inspection of the pain drawings after all of the measurements had been carried out revealed that the two examiners had arrived at a somewhat different number of areas on a few of the drawings, considering two adjacent areas as one, but as a whole, the number of areas measured varied by only 3%.
Individual pain areas
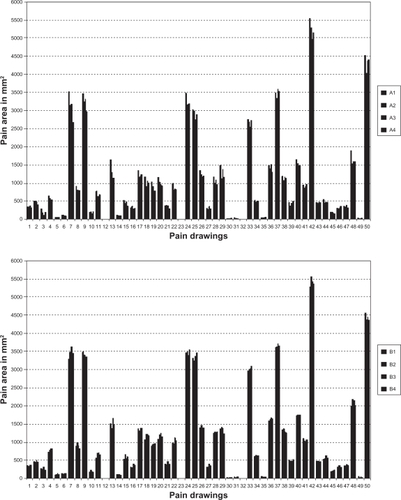
The individual areas, calculated in mm2 of the 48 patients’ pain drawings, are shown in and for the two examiners. Each column represents a measurement of the shaded-in areas on the same pain drawing as numbered on the x-axis and contains the four measurements for Examiner A () and Examiner B (). From the individual graphs, it can be seen that the intra-individual absolute differences were small within patients for each examiner, respectively. When comparing the two examiners, it can be seen that Examiner A’s values are often somewhat lower.
Figure 2 All individual pain area measurements of the 48 patients’ pain drawings: A) Examiner A; and B) Examiner B. Each cluster represents the same pain drawing as numbered on the x-axis and contains the four measurements.
Intra-rater reliability
In and , the ICC with a 95%CI, the absolute mean maximal differences, and ±1 SD are presented. When all four sessions were included in the analysis, a high intra-rater reliability was found for both examiners (ICC = 0.992 and 0.998), respectively (). The absolute mean difference in mm2 for Examiner A was almost double the size of Examiner B.
Table 1 Intra- and inter-rater reliability presented as ICCs with 95% CIs, absolute mean maximal differences mm2, and ±SD for “All 4 measurements” and for “Measurements 2, 3 and 4” (first measurement excluded) for Examiners A and B (n = 48)
When the first session was excluded (), the intra-rater repeatability increased for Examiner A. The absolute mean difference decreased for both examiners, by 72 mm2 for Examiner A and by 22 mm2 for Examiner B. In view of the fact that the size of the mean pain areas varied between 1062 mm2 and 1236 mm2, it means that the method with one examiner has a measurement error of 6.5%–9.1%.
Inter-rater reliability
The inter-rater reliability was high in both analyses. The measurement error calculated as the absolute difference between the mean values for the two examiners in all four measurements was 10.1% (117 mm2), and for measurements two, three, and four, it was 13% (151 mm2).
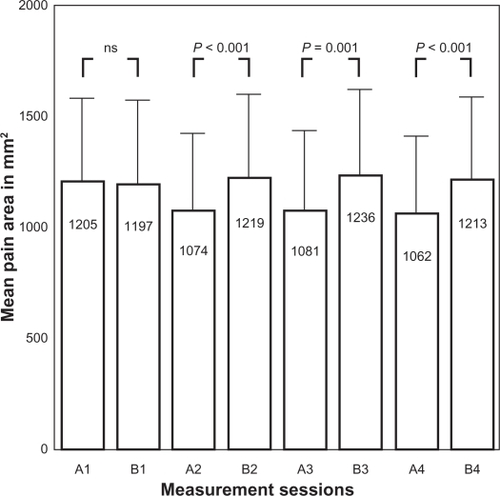
Thus, it appears that a significant difference (13%) in the size of absolute mean areas was seen between the two examiners in the second, third, and fourth measurement sessions, indicating that even if the ICC was high, one examiner measured systematically lower values, as can be seen from the mean area calculations from the eight measuring sessions ().
Figure 3 Bars show the mean measured area in mm2 for Examiners A and B on measuring sessions 1, 2, 3, and 4. Error bars show 95%CI of mean; (n = 48; Student’s paired t-test).
Discussion
Reliability
Using the computer program Quantify One, we found high intra-rater repeatability (ICC) with a mean maximal difference of only 6%–9% of the measurements consecutively performed on 48 pain drawings on two different occasions by two examiners when the measurements from their first session were excluded from the calculations. Our interpretation is that the first session served as a learning session, since this was the case for both examiners, although to a somewhat higher degree for Examiner A. The inter-examiner difference was somewhat higher, 13% between examiners. Across a wide range of pain surface areas measured (from 100 mm2 to 5500 mm2), the absolute mean maximal difference was close to 100 mm2, ie, a measurement error of 10% as compared with the mean pain areas. The measurement error can therefore be considered highly acceptable.
That pain drawings are reliable instruments both for assessment and as test–retest situations has been found earlier,Citation14,Citation16,Citation17,Citation23 but those studies have been performed with manual and not computer-aided interpretation methods. In a study by Finnerup et al,Citation24 however, two assessors blinded to patient history used Quantify One to calculate lesion areas shaded on MRI (magnetic resonance imaging) images of patients with spinal cord injuries. They also found a high correlation between assessors (Pearson’s correlation coefficient r = 0.98, P < 0.01), but they did not analyze mean absolute values to support their results.
Preciseness
A control inspection of the pain drawings after all of the measurements had been made revealed that the examiners had performed a somewhat different number of measurements on each of the four sessions, but the differences were very small, considering that, in all, each examiner measured about 2400 areas. Lacey et al,Citation23 studied the inter-rater reliability between eight evaluators who rated the number of areas (and thereby what percentage of body area) patients had shaded-in on 50 different pain drawings. The pain drawings were estimated to have an average of 10.2–11.3 shaded areas, and the inter-rater reliability was at least 78%. Since their pain drawings had 48 areas already marked, and all that was needed was to count the filled-in squares, these results cannot be directly compared with ours. They do show, however, that a factor of importance is whether the pain drawing is already squared or not (as in the present study).
Comparisons of the pain areas calculated from the individual pain drawings on the eight sessions revealed that they were not identical. In previous studies, when calculating surface area, a squared overlay has been placed on top of the filled-in pain drawing, and those squares containing shading have been included in the calculation.Citation6,Citation16,Citation25 Margolis et al,Citation6 made use of a so-called ‘grid system’ and divided the outline body into 45 sections. In certain cases, this sectioning is not detailed enough to obtain a correct figure for the actual area of the body in which the patient experiences pain, especially where small areas are concerned, since even when a square is only partly shaded, it is rated as a whole square. For this reason, several grid systems have been developed, with a varying number of squares that range from 200Citation25 to 560Citation16 squares, which specify more exactly the size of the total shaded body pain area. Even so, it is not likely that calculations can ever be exact. Instead it has been shown that evaluators often overestimate the area in rating a pain drawing.Citation26 The present technique enables the possibility to express pain areas also in percentage of the total body area, which could be valuable when studying the effect of pain treatment in groups of individuals as well as clinically on single cases. The validity of quantifying pain drawings has been demonstrated earlier.Citation19,Citation27
Using Quantify One, it is possible to encircle more precisely each area marked by the patient, and to obtain immediate details of its size. It is evident that Quantify One, in comparison with grid systems, should make it possible to obtain far more exact information on how large an area of the body is experienced to be in pain. Wenngren and StålnackeCitation21 recently published a pilot study using the first version of Quantify One to assess pain drawings in chronic pain. The clinical implications they suggested were that the method could be useful for systematic comparisons of repeated measures over time or when relating pain areas to other instruments.
On each measuring day, the 48 filled-in pain drawings were dealt with twice by each examiner (once in the morning, once in the afternoon). Since great concentration was required to measure a large number of drawings in succession, it is possible that individual measurements were affected by variations in the examiners’ attention. Despite this possibility, there is a very high correlation between all the measurements. The pain drawing outline on the computer screen was adjusted to be 86% of its original size. With a larger format, less precision would perhaps have been demanded of the examiner, but then it would not have been possible to show the whole drawing on the screen. The whole procedure would, on the other hand have been more time consuming, and if a method is to be introduced in clinical practice it should be easy to use and feasible.
Since the pain drawings with this method are digitized, high quality data without loss of information is possible to store in electronic medical records for later analyses, both regarding precise location and size of pain area, whereas the template method has unsatisfactory preciseness with respect to pain location. It is also possible to analyze pain drawings from a multicenter study at the same occasion and in one center.
Since the dominating storage form of medical records today is currently electronic, the Quantify One method is a suitable technique to integrate scanned and quantified pain drawings into modern records, both for clinical and scientific use. As apart from applying manikins or written questions, the present technique offers both precise location for diagnosis and precise area quantification for therapeutic follow-up.
Conclusion
Our results show that the computer program Quantify One is a reliable method to calculate marked areas of pain drawings. Both intra- and inter-rater reliability were high, and the measurement error was 10% or less, indicating that use of the program would be advantageous both in clinical practice and in research, but if repeated, preferably with the same examiner.
Disclosure
The authors declare no conflict of interest in relation to this work.
References
- BertilsonBGrunnesjöMJohanssonSEStrenderLEPain drawing in the assessment of neurogenic pain and dysfunction in the neck/shoulder region: inter-examiner reliability and concordance with clinical examinationPain Med20078213414617305685
- DahlBGehrchenPMKiaerTBlymePTøndevoldEBendixTNonorganic pain drawings are associated with low psychological scores on the preoperative SF-36 questionnaire in patients with chronic low back painEur Spine J200110321121411469731
- GioiaFGorgaDNaglerWThe value of pain drawings in the care of neck and back painJ Back Musculoskel199783209214
- HildebrandtJFranzCEChoroba-MehnenBTemmeMThe use of pain drawings in screening for psychological involvement in complaints of low-back painSpine19881366816852972073
- JamisonRNFanciulloGJBairdJCUsefulness of pain drawings in identifying real or imagined pain: accuracy of pain professionals, nonprofessionals, and a decision modelJ Pain20045947648215556825
- MargolisRBTaitRCKrauseSJA rating system for use with patient pain drawingsPain198624157652937007
- MasferrerRPrendergastVHagellPColored pain drawings: preliminary observations in a neurosurgical practiceEur J Pain20037321321712725843
- OhnmeissDDVanharantaHEkholmJRelationship of pain drawings to invasive tests assessing intervertebral disc pathologyEur Spine J19998212613110333151
- ParkerHWoodPLMainCJThe use of the pain drawing as a screening measure to predict psychological distress in chronic low back painSpine19952022362437716631
- RansfordAOCairnsDMooneyVThe pain drawing as an aid to the psychologic evaluation of patients with low-back painSpine197612127134
- ToomingasACharacteristics of pain drawings in the neck-shoulder region among the working populationInt Arch Occup Environ Health19997229810610197481
- GrunnesjöMBogefeldtJBlombergSDelaneyHSvärdsuddKThe course of pain drawings during a 10-week treatment period in patients with acute and sub-acute low back painBMC Musculoskelet Disord200676516901354
- SandersNWMannNH3rdAutomated scoring of patient pain drawings using artificial neural networks: efforts toward a low back pain triage applicationComput Biol Med200030528729810913774
- OhnmeissDDRepeatability of pain drawings in a low back pain populationSpine (Phila Pa 1976)200025898098810767812
- SchottGDThe cartography of pain: the evolving contribution of pain mapsEur J Pain201014878479120079670
- BrynerPExtent measurement in localised low-back pain: a comparison of four methodsPain19945922812857892026
- MargolisRBChibnallJTTaitRCTest-retest reliability of the pain drawing instrumentPain198833149513380550
- Van den HovenLHGorterKJPicavetHSMeasuring musculoskeletal pain by questionnaires: the manikin versus written questionsEur J Pain201014333533819699125
- JamisonRNFanciulloGJBairdJCComputerized dynamic assessment of pain: comparison of chronic pain patients and healthy controlsPain Med20045216817715209971
- K:L:O:N:K Quantify Image [homepage on the internet] Available from: http://www.quantifyimage.net/1home.aspx. Accessed February 16, 2011.
- WenngrenAStålnackeBMComputerized assessment of pain drawing area: a pilot studyNeuropsychiatr Dis Treat2009545145619721724
- SandersNWMannNH3rdSpenglerDMPain drawing scoring is not improved by inclusion of patient-reported pain sensationSpine2006312327352741 discussion2742274317077744
- LaceyRJLewisMJordanKJinksCSimJInterrater reliability of scoring of pain drawings in a self-report health surveySpine20053016E455E45816103839
- FinnerupNBGyldenstedCNielsenEKristensenADBachFWJensenTSMRI in chronic spinal cord injury patients with and without central painNeurology200361111569157514663044
- GatchelRJMayerTGCapraPDiamondPBarnettJQuantification of lumbar function. Part 6: The use of psychological measures in guiding physical functional restorationSpine198611136422939568
- RamsayBLawrenceCMMeasurement of involved surface area in patients with psoriasisBr J Dermatol199112465655702064940
- OhlundCEekCPalmbaldSAreskougBNachemsonAQuantified pain drawing in subacute low back pain. Validation in a nonselected out-patient industrial sampleSpine (Phila Pa 1976)199621910211030 discussion10318724085