Abstract
The goal of this study was to investigate whether certain metabolites, specific to neurons, glial cells, and the neuronal-glial neurotransmission system, in the primary somatosensory cortex (SSC), are altered and correlated with clinical characteristics of pain in patients with chronic low back pain (LBP). Eleven LBP patients and eleven age-matched healthy controls were included. N-acetylaspartate (NAA), choline (Cho), myo-inositol (mI), and glutamine/glutamate (Glx) were measured with proton magnetic resonance spectroscopy (1H-MRS) in left and right SSC. Differences in metabolite concentrations relative to those of controls were evaluated as well as analyses of metabolite correlations within and between SSCs. Relationships between metabolite concentrations and pain characteristics were also evaluated. We found decreased NAA in the left SSC (P = 0.001) and decreased Cho (P = 0.04) along with lower correlations between all metabolites in right SSC (P = 0.007) in LBP compared to controls. In addition, we found higher and significant correlations between left and right mI (P < 0.001 in LBP vs P = 0.1 in controls) and between left mI and right Cho (P = 0.048 vs P = 0.6). Left and right NAA levels were negatively correlated with pain duration (P = 0.04 and P = 0.02 respectively) while right Glx was positively correlated with pain severity (P = 0.04). Our preliminary results demonstrated significant altered neuronal-glial interactions in SSC, with left neural alterations related to pain duration and right neuronal-glial alterations to pain severity. Thus, the 1H-MRS approach proposed here can be used to quantify relevant cerebral metabolite changes in chronic pain, and consequently increase our knowledge of the factors leading from these changes to clinical outcomes.
Introduction
The most prevalent and debilitating chronic pain condition is low back pain (LBP), affecting 85% of adults in US.Citation1 Chronic LBP, defined by the presence of pain for longer than 3 months, is associated with significant physical and psychological disability that results in work absenteeism and economic burden, costing $86 billion annually.Citation2–Citation4 Since the spinal imaging findings are poorly correlated with clinical characteristics of pain,Citation5 brain imaging studiesCitation6–Citation9 have attempted to gain a better understanding of pain neurobiology. Recently, the spectacular development of imaging techniquesCitation10–Citation12 has improved this understanding even more.
Accumulating evidence suggests that chronic pain is due to central nervous system changes.Citation6 Specifically, animal studies have shown spinalCitation13,Citation14 and corticalCitation15,Citation16 sensitization in various chronic pain conditions. Human imaging studies have also revealed pathophysiological changes in brain regions involved in both affective-motivational and sensorial aspects of pain processing in chronic LBP. For instance, proton magnetic resonance spectroscopy (1H-MRS) studies have shown low N-acetylaspartate (NAA), a marker of neuronal integrity,Citation17,Citation18 in the dorsolateral prefrontal cortex (DLPFC), anterior cingulate cortex (ACC) and anterior insula in chronic LBP.Citation7–Citation9 Further, low NAA in the DLPFC has been correlated with pain severity and associated symptoms, such as anxiety and depression.Citation7,Citation9 Another 1H-MRS metabolite, myo-inositol (mI), a glial marker,Citation18 was also decreased in the ACC and thalamus.Citation10 Finally, glutamate, the major brain excitatory neurotransmitter, was also decreased in the ACC.Citation10 Taken together, these studies suggested alterations of neuronal-glial interactions in brain regions involved in the affective-motivational aspect of pain. No such studies have been reported that relate to the primary somatosensory cortex (SSC), a major cortical region involved in sensory-discrimination and nociception integration.
Here, we focus on the SSC, as an extensive reorganization of this area has been reported in chronic LBP. Specifically, an increased activity and an expansion of the back cortical representation into leg and foot representationsCitation19 were reported in these patients. This finding was also confirmed in people with high catastrophic behavior (illness behavior) and positive Waddell signs following chronic LBP.Citation20 Further evidence comes from morphometric studies that showed a decrease in the SSC gray matter volume in chronic LBP.Citation21
These SSC functional/morphometric changes are probably accompanied by chemical alterations. Therefore, the goals of the present study were (i) to determine whether 1H-MRS-visible metabolites specific to neuronal-glial interactions are altered within the SSC in chronic LBP; and (ii) to investigate whether changes in these metabolites relate to clinical level of pain. Based on the essential role of neuronal-glial interactions in extracellular ionic homeostasis, neurotransmission and ultimately in neuronal function,Citation18 we analyzed the following metabolites: NAA; choline (Cho), reflecting cell membrane integrity; mI; and glutamate/glutamine (Glx), reflecting the neuronal-glial neurotransmission system. These measurements were acquired in radiologically normal-appearing grey matter of the SSC.
Methods
Participants
Eleven subjects diagnosed with chronic LBP and eleven healthy age-matched subjects participated in the study. All participants signed informed consent in accordance with the Human Subjects Committee Review Board of the University of Kansas Medical Center. Subjects were included if they (i) had a medical diagnosis of chronic LBP (>3 months), (ii) experienced pain intensity of at least 4 on a verbal numeric pain rating scale (range 0 = no pain; to 10 = the worst pain ever experienced), (iii) had no brain abnormalities on T2-weighted MRI, (iv) were aged between 21 and 60 yrs, and (v) were able to understand simple instructions in English. Exclusion criteria were: (i) spinal cord compression, tumor, or infection, (ii) psychiatric diseases, (iii) current drug or alcohol abuse, or (iv) other neurological or neuromuscular patologies that might interfere with our data. Five out of eleven patients were on pain therapy. Healthy controls, without neurological, psychiatric or pain disorders, MRI contraindications, and with normal T2-weighted images, were recruited.
Clinical measurements
Chronic LBP participants completed a physical examination comprised of lumbar range of motion and neurological examination. If the subjects did not present with motor nerve root compression or acute spinal pathology, they proceeded to complete self-reported questionnaires of pain and disability, such as the Short Form McGill Pain Questionnaire (SF-MPQ), Modified Oswestry Disability Scale (MODS), Fear-Avoidance Belief Questionnaire (FABQ), and Back Depression Inventory Scale (BDIS).
SF-MPQ,Citation22 a reliable and valid scale,Citation23 contains 15 pain items, 11 sensory and 4 affective. Each item is rated on an intensity scale with 0 = none, 1 = mild, 2 = moderate, and 3 = severe. The questionnaire also includes the present pain intensity (PPI) index and a visual analog scale (VAS, 0 = no pain, 10 = the worst pain ever experienced) for pain. The MODS, the gold standard test for assessing the disabling effects of lumbar spine pain, consists of 10 sections; each section is scored from 0 = minimum, 5 = maximum. Higher scores indicate greater disability. The FABQ has items related to fear about physical (items 2–5) and work (items 6, 7, 9–12, 15) activities and items not in either physical or work scale (items 1, 8, 13, 14, 16); each item is scored from 0 to 6 with a higher number indicating increased fear of activity or work.Citation24 The BDIS contains 21 items, each indicating a response from 0 = does not apply to 3 = applies very much to me, with the intensity of depression calculated based on the total score.Citation25
Magnetic resonance imaging (MRI) measurements
MRI assessments were performed on a 3 Tesla scanner (Siemens Medical Solutions, Erlangen, Germany) and total scan duration was about 30 minutes. A detailed description of these assessments has been reported previously.Citation26
In brief, whole-brain 3D T1-weighted MRI was acquired to estimate brain tissue volume in spectroscopic voxels (MPRAGE; TR = 2300 ms; TE = 3 ms; FOV = 240 mm; matrix = 256 × 256; resolution = 1 × 1 × 1 mm3). An axial proton density/T2-weighted MRI (TR = 4800 ms; TE1/TE2 = 18/106 ms; FOV = 240 mm; matrix size = 256 × 256; slice thickness = 5 mm, no gap) was acquired to exclude undiagnosed brain pathology in all participants.
One spectroscopic imaging slab (SIS) was selected in the frontal and parietal lobes sampling both gray matter (GM) and white matter (WM) of our region of interest, the SSC. The SIS was positioned according to the SSC anatomical landmarksCitation27 applied on T2-weighted images (Brodmann area 3, 1, and 2; or post-central gyrus), and as posteriorly as possible to avoid the poorer magnetic field homogeneity of anterior regions that are not relevant to this study. To minimize the possible lipid artifact, eight outer voxel suppression bands (thickness = 30 mm) were prescribed around and above the SIS. SIS was acquired using a point-resolved spectroscopy sequence (PRESS; TE = 30 ms; TR = 1500 ms; matrix size = 16 × 16; FOV = 160 mm2; slice thickness = 15 mm; in-plane resolution = 5 × 5 mm2; spectral width = 1200 Hz). Automated and then manual shimming was performed to achieve full-width at half maximum of <20 Hz of the water signal from the entire excitation volume.
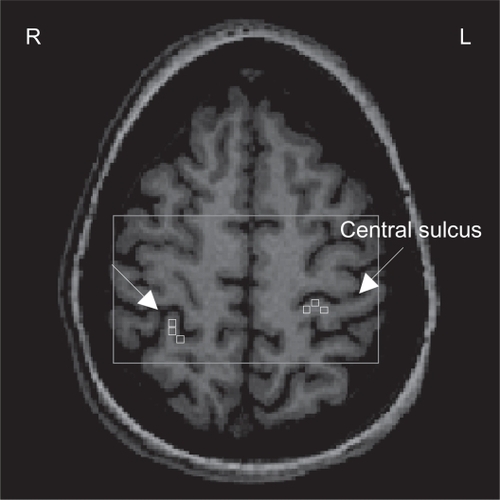
Metabolite concentrations were calculated using LCModelCitation28 (a linear combination of model spectra using a basis set included in the package), using a radio-frequency coil loading factor. The T1-weighted images were segmented in GM, WM, and cerebrospinal fluid (SPM5, Welcome Department of Cognitive Neurology, London, UK). As previously shown,Citation26 by using custom-designed software (Matlab v7.1, 2005), we overlaid the LCModel output and the segmented T1-weighted images on the SIS grid. This graphical interface is used to display spectra, brain fraction from segmentation, and the metabolite concentrations from LCModel in the spectroscopic voxels corresponding to cortical representation of the back in each SSC. Three spectroscopic voxels were selected in each SSC (see ) and each voxel contained GM > 75%, yielded a signal-to-noise ratio >10, and had Cramer-Rao bounds <20% for studied metabolites. Metabolite concentrations were brain tissue-corrected by normalizing the LCModel output as follows: c = cLCModel*[1/EFBT], where c is final concentration; cLCModel is metabolite concentration from LCModel output; and EFBT is the estimated brain tissue (GM + WM) fraction. Finally, the corrected concentrations for all three voxels were averaged to provide a mean concentration (millimoles/kilogram wet weight, mM) for NAA, Cho, mI, and Glx in each SSC.
Figure 1 1Proton magnetic resonance spectroscopy (H-MRS) analysis: Axial view of the spectroscopic imaging slab (rectangle) superimposed on T1-weighted image. Three spectroscopic voxels (squares) were selected in each somatosensory cortex (SSC). The arrows indicate the central sulcus.
Statistical analysis
The analysis focused on four metabolites (NAA, Cho, mI, and Glx) in each SSC (left and right) and four clinical measures (pain, SF-MPQ; disability, MODS; fear, FABQ; depression, BDIS). Means and standard deviations were computed for each outcome variable.
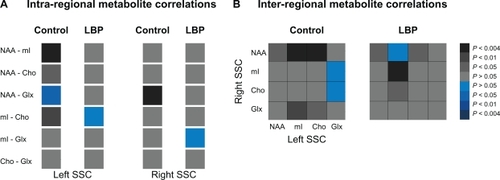
The overall differences in metabolite concentrations between groups were analyzed by using independent sample t-test with unequal variance (2-tails). Individual metabolite differences between groups were also calculated with independent sample t-test (2 tails, unequal variance when indicated). Pearson correlation coefficient was used to examine correlations among metabolites within SSC (intra-regional) and between left and right SSC (inter-regional). Distribution of original data (correlations strength) for goodness of fit was assessed using the K-S test. Using a custom-designed routine (Matlab v7.1, 2005), the computed correlation coefficients were assigned to the following categories P < 0.004 (r = 1–0.77), 0.004 < P < 0.01 (r = 0.76–0.70), 0.01 < P < 0.05 (r = 0.69–0.61), P > 0.05 (r < 0.60). Similar categories were used for the negative correlations. The respective correlation coefficients were then transformed into gray (for positive) and blue (for negative) values to get a more straightforward visualization of the connectivity between different metabolites (see ). Pearson correlation coefficient was also used to study the correlations between metabolites and clinical measures. Differences were considered significant at P < 0.05 (SPSS 18.0, SPSS Inc, Chicago, IL).
Figure 2 Metabolite connectivity pattern within (A, intra-regional) and between (B, inter-regional) somatosensory cortices (SSCs) in controls (left panels) and chronic low back pain (LBP) patients (right panels). The correlation values (Pearson’s correlation coefficients) are presented as color gradients (grey-positive, blue-negative) and the side legend represent the corresponding P-values.
Results
Participants
LBP and healthy controls did not significantly differ with respect to age (mean ± SD, 33.6 ± 10.6 yrs vs 31.4 ± 13.9 yrs, P = 0.1). In the LBP group, the mean duration of symptoms was 10.6 ± 8.3 yrs, with an average pain intensity of 5.9 ± 1.4 on VAS. Out of 11 subjects, seven reported radiating leg pain and four reported localized LBP. Five participants were on regular pain therapy (three on opiate analgesics, such as Oxycontin; two on anticonvulsant therapy, such as Neurotin, for pain control). In addition, three subjects took nonsteroidal anti-inflammatory drugs on an as-needed basis (average one medication per week). All but three subjects were carrying fulltime regular work responsibilities. The clinical characteristics of pain, disability, and depression are shown in . In summary, our subjects suffered long duration of pain symptoms, experienced moderate levels of pain intensity and disability, perceived high levels of fear of movement, and displayed mild depression.
Table 1 Clinical scores (mean ± SD) in LBP participants
Spectral quality
1H-MRS spectra with good signal-to-noise were obtained consistently from both LBP and controls (left SSC, 11.8 ± 1.6 vs 11.8 ± 2.0, P = 0.9; right SSC, 12.4 ± 1.9 vs 12.3 ± 2.5, P = 0.9). Similar percentages of brain tissue within SSC were found between LBP and controls (left, 90.7 ± 3.9 vs 87.1 ± 4.8, P = 0.1; right 86.2 ± 5.4 vs 82.8 ± 6.5, P = 0.2).
1H-MRS findings
Normal distribution for individual metabolites was verified with frequency and Q-Q plots, and the assumption of normal distribution was met. Overall metabolite concentrations were lower in both SSCs (left, −5.0%, t = 2.7, P = 0.07; right, −8.1%, t = 4.4, P = 0.02) in LBP compared to controls. Follow-up analysis showed significantly low NAA in the left SSC and low Cho in the right SSC (see ). mI and Glx concentrations in either left or right SSC were not statistically different between the groups ().
Table 2 Metabolite concentrations (mM) in left and right somatosensory cortices (SSCs) in controls and LBP participants
The strength of correlations was normally distributed in both groups (P = 0.02 for each group). Lower correlations between all metabolites were detected in the right SSC in LBP (mean of correlation coefficients, 0.21 ± 0.19) than in controls (0.55 ± 0.14, t = 2.3, P = 0.007, ). Although the mean correlation coefficient was not altered in the left SSC (t = 2.2, P = 0.1), individual correlations between NAA-mI, NAA-Cho and mI-Cho became lower and insignificant in LBP compared to controls (r = 0.26, P = 0.4 vs r = 0.83, P = 0.001; r = 0.48, P = 0.14 vs r = −0.81, P = 0.03; r = −0.05, P = 0.87 vs r = 0.73, P = 0.01 respectively; ). Further, higher and significant correlations between left mI and right Cho and between left and right mI were detected in LBP compared to controls (r = 0.61, P = 0.05 vs r = 0.17, P = 0.6; and r = 0.84, P = 0.00 vs r = 0.50, P = 0.1 respectively; ).
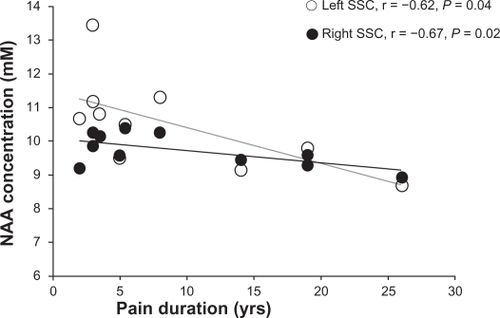
Pain duration was negatively correlated with NAA levels in both left (r = −0.62, P = 0.04) and right (r = −0.67, P = 0.02) SSC ().
Figure 3 Correlations between N-acetylaspartate (NAA) concentrations (mM) and duration of pain (years) in right (white circles) and left (black circles) somatosensory cortices (SSCs) in participants with low back pain.
Although Glx concentrations were not significantly changed in LBP compared to controls (see ), the right Glx was positively correlated with pain severity (as measured by SF-MPQ, r = 0.62, P = 0.04). No other correlations were found to be significant between SSC metabolites and clinical measures of disability, fear of movement, and depression.
Discussion
In the present study, two questions were investigated: (i) are cerebral metabolites altered in the SSC in chronic LBP? (ii) are these alterations related to clinical characteristics of pain? Our results suggest an overall decrease in metabolite levels in the right SSC and to a lesser degree in the left SSC, as well as altered intra- and inter-SSC metabolite correlations in LBP patients compared to controls. In addition, certain SSC metabolites were correlated with pain duration and severity.
Our findings are consistent with previous LBP studies, in which metabolites were decreased overall in cortical regions involved in the affective-motivational aspect of pain.Citation7–Citation9 For instance, a decrease of 6.5% in total metabolite concentrations has been found in the DLPFC.Citation9 We also found a similar overall metabolite decrease (6.5%) in each SSC in our patients. An anatomical substrate for this overall metabolite change could be the decrease in gray matter volume, as previously reported in these patients.Citation21 However, we corrected the metabolite concentrations for brain tissue fraction in each spectroscopic voxel and no significant differences in brain tissue were found between groups (see Results). Therefore, we can conclude that the metabolite alterations described here are not due to decreased grey matter volume in LBP. Finally, our overall SSC metabolite change might underlie the pain-related functional SSC alterations, such as expansion and shift in the representation of low back in the SSC.Citation19,Citation20,Citation29 However, no studies have addressed whether the cortical functional reorganization in chronic LBP results from changes in brain chemistry. Such finding will improve our understanding of the neural substrates of chronic pain in humans.
Our finding of low NAA in the left SSC is also in agreement with previous studies. Low NAA have been consistently found in the DLPFCCitation7,Citation9 and anterior insulaCitation10 in chronic LBP, as well as in other chronic pain conditions, such as pain following spinal cord injury.Citation30,Citation31 Recently, low NAA reported in the hippocampus of individuals who suffered from chronic widespread fibromyalgia painCitation32,Citation33 was attributed to neuronal or axonal metabolic dysfunction. Therefore, the low NAA reported here might indicate altered neuronal mitochondrial metabolism, although other mechanisms such as pain medication or brain atrophy might contribute too. However, we do not attribute our results to medication use since we did not find metabolite changes in both hemispheres. Further, by excluding the five patients taking medications on a regular basis from analysis, in the remaining patients (n = 6), NAA was decreased by 11.9% in the left and 12% in the right SSC compared to controls. Finally, the presence of the relationships between NAA levels and pain duration (see ) provide support for NAA as a marker of neuronal mitochondrial depression as a result of long-term nociceptive input to the SSC.
We also report low Cho in the right SSC. Since Cho is thought to be involved in membrane synthesis and degradation, low Cho can be interpreted as an alteration in cell membrane integrity, as indicated by other authors in patients with fibromyalgia pain.Citation32 Low Cho might also reflect changes in brain osmolarity.Citation34 Since mI, another major brain osmolyte,Citation35 was not significantly increased (P = 0.6), it is unlikely that low Cho was driven by hyperosmolarity, which would increase mI. Since Cho resonance is composed of choline, phosphocholine and glycerol-phosphocholine, a down-regulation of genes from enzymes responsible for metabolism of free choline, phosphocholine and phosphatidylcholineCitation36 could explain the low Cho reported here. However, further studies are needed to determine the exact mechanisms underlying low Cho in chronic pain.
Although no 1H-MRS measurements have been reported in the SSC, one study reported no metabolite changes in the sensory-motor cortex in chronic LBP.Citation9 The use of metabolite ratios to creatineCitation9 can partially explain the discrepancy in the individual metabolite findings since creatine is not a reliable denominator.Citation37 Indeed, we found significantly low creatine in the left SSC and a trend to low creatine in the right SSC in LBP compared to controls (6.8 ± 0.8 mM vs 7.5 ± 0.6 mM, P = 0.048; 10.8 ± 2.1 mM vs 11.9 ± 3.2, P = 0.3). Perhaps a more fundamental reason for the discrepancy is that we studied only the SSC compared to the sensory-motor cortex examined in the previous study.Citation9
In contrast to previous studies reporting low ACC Glx in LBP,Citation10 we did not find significant Glx changes in the SSC in our LBP patients compared to controls (see ). Although right Glx was not significantly altered in LBP, we found a positive relationship between Glx levels and pain severity. Since glutamate is related to chronic pain sensitizationCitation38 and it is the major component of Glx, we speculate that Glx might be involved in chronic pain-related SSC changes. However, further studies are required to confirm or reject this finding.
Since the SSC is involved in the sensory discrimination process of pain rather than the affective-motivational pain aspect, as expected, we did not find significant correlations between metabolite concentrations and the clinical measures of fear avoidance and depression.
The neuronal network exists through a close relationship among various metabolites at physiological levels; a relationship that can be disturbed in pathologies. For example, the metabolite correlations within the DLPFC, ACC and thalamus were altered in chronic LBP.Citation9 In agreement with these findings, we report weaker (or depression in) correlations between all metabolites in both SSC, predominantly in the right (see ), in our patients than in the controls. Indeed, right SSC shows important changes of Cho, mI, and Glx concentrations (relative to controls, see ), which might affect the correlation strengths between metabolites in this region. In contrast, stronger and significant correlations were found across hemispheres, specifically between left mI and right mI and between left mI and right Cho (see ). This inter-hemispheric increased metabolite connectivity may be considered as an adaptive process, which might be necessary to preserve optimal SSC metabolism when metabolite concentrations are low. These findings highlight the dynamic nature of changes not only in metabolite concentrations but also in their “communication” in chronic pain.
A limitation of our study is that we studied a small sample size (n = 11), and therefore we did not control for multiple comparisons, as in any pilot study. Despite this limitation, we observed changes in several brain metabolites as well as alterations in metabolite correlations that may potentially explain pain persistence.
Conclusion
In summary, we report the presence of SSC metabolite alterations, reflective of altered neuronal-glial interactions that correlate with clinical characteristics of pain. These changes may contribute to the persistent nature of pain without obvious pathology. Our results add to the current understanding of the neural substrate of cortical sensitization in chronic pain.
Acknowledgements
This work was supported by the following funding sources: American Heart Association (0860041Z to CMC), KUMC Clinical Pilot and Lied Endowed Basic Science Program (to NKS), and 5 T32 HD57850 (to AL). The Hoglund Brain Imaging Center is supported by a generous gift from Forrest and Sally Hoglund. The authors like to thank Ali Bani-Ahmed and Anda Popescu for their assistance in data acquisition and analysis.
Disclosure
The authors report no conflicts of interest in this work.
References
- AnderssonGBEpidemiological features of chronic low-back painLancet1999354917858158510470716
- RitzwollerDPCrounseLShetterlySRubleeDThe association of comorbidities, utilization and costs for patients identified with low back painBMC Musculoskelet Disord200677216982001
- WasiakRKimJPranskyGWork disability and costs caused by recurrence of low back pain: longer and more costly than in first episodesSpine (Phila Pa 1976)200631221922516418644
- MartinBIDeyoRAMirzaSKExpenditures and health status among adults with back and neck problemsJAMA2008299665666418270354
- JensenMCBrant-ZawadzkiMNObuchowskiNModicMTMalkasianDRossJSMagnetic resonance imaging of the lumbar spine in people without back painN Engl J Med1994331269738208267
- GieseckeTGracelyRHGrantMAEvidence of augmented central pain processing in idiopathic chronic low back painArthritis Rheum200450261362314872506
- GrachevIDRamachandranTSThomasPSSzeverenyiNMFredricksonBEAssociation between dorsolateral prefrontal n-acetyl aspartate and depression in chronic back pain: an in vivo proton magnetic resonance spectroscopy studyJ Neural Transm2003110328731212658377
- GrachevIDFredricksonBEApkarianAVBrain chemistry reflects dual states of pain and anxiety in chronic low back painJ Neural Transm2002109101309133412373563
- GrachevIDFredricksonBEApkarianAVAbnormal brain chemistry in chronic back pain: an in vivo proton magnetic resonance spectroscopy studyPain200089171811113288
- GussewARzannyRGullmarDScholleHCReichenbachJR1h-mr spectroscopic detection of metabolic changes in pain processing brain regions in the presence of non-specific chronic low back painNeuroimage20105421315132320869447
- WrigleyPJPressSRGustinSMNeuropathic pain and primary somatosensory cortex reorganization following spinal cord injuryPain20091411–2525919027233
- HendersonLAGustinSMMaceyPMWrigleyPJSiddallPJFunctional reorganization of the brain in humans following spinal cord injury: evidence for underlying changes in cortical anatomyJ Neurosci20113172630263721325531
- SharmaNKRyalsJMLiuHLiuWWrightDEAcidic saline-induced primary and secondary mechanical hyperalgesia in miceJ Pain200910121231124119592308
- CuiJGO’ConnorWTUngerstedtULinderothBMeyersonBASpinal cord stimulation attenuates augmented dorsal horn release of excitatory amino acids in mononeuropathy via a gabaergic mechanismPain199773187959414060
- BementMKSlukaKACo-localization of p-creb and p-nr1 in spinothalamic neurons in a chronic muscle pain modelNeurosci Lett20074181222717395373
- TilluDVGebhartGFSlukaKADescending facilitatory pathways from the rvm initiate and maintain bilateral hyperalgesia after muscle insultPain2008136333133917764841
- GovindarajuVYoungKMaudsleyAAProton NMR chemical shifts and coupling constants for brain metabolitesNMR Biomed200013312915310861994
- SiegelGJBAgranoffBWAlbersGWFisherSKUhlerMDBasic Neurochemistry: Molecular, Cellular and Medical AspectsOxford, UKAcademic Press2005
- FlorHBraunCElbertTBirbaumerNExtensive reorganization of primary somatosensory cortex in chronic back pain patientsNeurosci Lett19972241589132689
- LloydDFindlayGRobertsNNurmikkoTDifferences in low back pain behavior are reflected in the cerebral response to tactile stimulation of the lower backSpine (Phila Pa 1976)200833121372137718496351
- Schmidt-WilckeTLeinischEGanssbauerSAffective components and intensity of pain correlate with structural differences in gray matter in chronic back pain patientsPain20061251–2899716750298
- MelzackRThe short-form McGill pain questionnairePain19873021911973670870
- ZinkeJLLamCSHardenRNFoggLExamining the cross-cultural validity of the English short-form McGill pain questionnaire using the matched moderated regression methodologyClin J Pain201026215316220090443
- WaddellGNewtonMHendersonISomervilleDMainCJA fear-avoidance beliefs questionnaire (FABQ) and the role of fear-avoidance beliefs in chronic low back pain and disabilityPain19935221571688455963
- BeckATSteerRAInternal consistencies of the original and revised Beck depression inventoryJ Clin Psychol1984406136513676511949
- CirsteaMCBrooksWMCraciunasSCPrimary motor cortex in stroke – a functional MRI-guided proton MR spectroscopic studyStroke20114241004100921330627
- ConstableRTSkudlarskiPMenclEQuantifying and comparing region-of-interest activation patterns in functional brain MR imaging: methodology considerationsMagn Reson Imaging19981632893009621970
- ProvencherSWEstimation of metabolite concentrations from localized in vivo proton NMR spectraMagn Reson Med19933066726798139448
- MoseleyGLWidespread brain activity during an abdominal task markedly reduced after pain physiology education: FMRI evaluation of a single patient with chronic low back painAust J Physiother2005511495215748125
- FukuiSMatsunoMInubushiTNosakaSN-acetylaspartate concentrations in the thalami of neuropathic pain patients and healthy comparison subjects measured with (1)H-MRSMagn Reson Imaging2006241757916410181
- PattanyPMYezierskiRPWiderstrom-NogaEGProton magnetic resonance spectroscopy of the thalamus in patients with chronic neuropathic pain after spinal cord injuryAJNR Am J Neuroradiol200223690190512063213
- FayedNGarcia-CampayoJMagallonRLocalized 1H-NMR spectroscopy in patients with fibromyalgia: a controlled study of changes in cerebral glutamate/glutamine, inositol, choline, and n-acetylaspartateArthritis Res Ther2010124R13420609227
- WoodPBLedbetterCRGlabusMFBroadwellLKPattersonJC2ndHippocampal metabolite abnormalities in fibromyalgia: correlation with clinical featuresJ Pain2009101475218771960
- BosmanDKDeutzNEDe GraafAAChanges in brain metabolism during hyperammonemia and acute liver failure: results of a comparative 1H-NMR spectroscopy and biochemical investigationHepatology19901222812901975248
- HeiligCWStromskiMEBlumenfeldJDLeeJPGullansSRCharacterization of the major brain osmolytes that accumulate in salt-loaded ratsAm J Physiol19892576 Pt 2F1108F11162603957
- LiZVanceDEPhosphatidylcholine and choline homeostasisJ Lipid Res20084961187119418204095
- LaaksoMPHiltunenYKononenMDecreased brain creatine levels in elderly apolipoprotein e epsilon 4 carriersJ Neural Transm2003110326727512658375
- HarrisRESundgrenPCCraigADElevated insular glutamate in fibromyalgia is associated with experimental painArthritis Rheum200960103146315219790053