 ?Mathematical formulae have been encoded as MathML and are displayed in this HTML version using MathJax in order to improve their display. Uncheck the box to turn MathJax off. This feature requires Javascript. Click on a formula to zoom.
Abstract
Purpose
Pain rating scales are widely used for pain assessment. Nevertheless, a new tool is required for pain assessment needs in retrospective studies.
Methods
The postoperative pain episodes, during the first postoperative day, of three patient groups were analyzed. Each pain episode was assessed by a visual analog scale, numerical rating scale, verbal rating scale, and a new tool – pain point system scale (PPSS) – based on the analgesics administered. The type of analgesic was defined based on the authors’ clinic protocol, patient comorbidities, pain assessment tool scores, and preadministered medications by an artificial neural network system. At each pain episode, each patient was asked to fill the three pain scales. Bartlett’s test and Kaiser–Meyer–Olkin criterion were used to evaluate sample sufficiency. The proper scoring system was defined by varimax rotation. Spearman’s and Pearson’s coefficients assessed PPSS correlation to the known pain scales.
Results
A total of 262 pain episodes were evaluated in 124 patients. The PPSS scored one point for each dose of paracetamol, three points for each nonsteroidal antiinflammatory drug or codeine, and seven points for each dose of opioids. The correlation between the visual analog scale and PPSS was found to be strong and linear (rho: 0.715; P < 0.001 and Pearson: 0.631; P < 0.001).
Conclusion
PPSS correlated well with the known pain scale and could be used safely in the evaluation of postoperative pain in retrospective studies.
Introduction
Pain is a common symptom of any illness, and is defined by the International Association for the Study of Pain as “an unpleasant sensory and emotional experience associated with either actual or potential tissue damage, or described in terms of such damage.”Citation1,Citation2 The alerting function of pain evokes protective responses and is intended to keep tissue damage to a minimum.Citation3 Postoperative pain is an expected and inevitable symptom in a surgical patient associated with surgical tissue damage, the presence of drains and tubes, postoperative complications, or a combination of the above mentioned.Citation2,Citation4,Citation5 The physiological consequences comprise the activation of the “stress response,”Citation2 evoking respiratory, cardiovascular, thromboembolic, gastrointestinal, musculoskeletal, and psychological complications.Citation2,Citation6–Citation12 To ease recovery, functional ability, and to reduce postoperative morbidity, pain should be treated as adequately as possible. Careful monitoring by the surgeon or anesthesiologist can result in more effective control of postoperative pain.Citation13 Pain is a subjective sensation that can be described according to several relevant features or attributes such as quality, location, intensity, aversiveness, emotional impact, and frequency.Citation13 Among these attributes, intensity is recognized as one of the relevant clinical dimensions of the pain experience.Citation14 Various rating scales have been described to measure pain intensity that are partially subjective, with difficulties in administration to patients with special needs.Citation15 Such scales include the visual analog scale (VAS), numerical rating scale (NRS), and verbal rating scale (VRS).
The pain point system scale (PPSS) was introduced to overcome the drawbacks involved in postoperative pain intensity assessment and when objective pain assessment is desired for study purposes but there is no available data (due to lack of communication with patient or patient’s inability to recall). The PPSS inputs the type of analgesics administered and scores each given dose separately. The total postoperative pain score or the score of each pain episode can be used for evaluation. The scoring system is based on the analgesic ladder proposed by the World Health Organization as a step approach to pain management.Citation16 It classifies analgesics into three groups. The first group comprises nonnarcotic weak analgesics (paracetamol/acetaminophen), the second group comprises nonnarcotic nonsteroidal antiinflammatory drugs and weak narcotics (codeine), and the third group comprises strong narcotic analgesics (). Specifically, one dose of paracetamol 600 mg equals 1 point; a dose of paracetamol 500 mg plus 10 mg codeine equals 3 points; each dose of a nonsteroidal antiinflammatory drug (diclofenac 75 mg, parecoxib 40 mg, or lornoxicam 8 mg) equals 3 points; and each dose of an opioid (tramadol 50 mg or dextropropoxyphene hydrochloride 75 mg or pethidine hydrochloride 50 mg) equals 7 points.
Table 1 Scoring algorithm of pain point system scale based on administered drugs in the early postoperative period
This study was designed to detect the correlation between the PPSS and the commonly used pain scales (VAS, NRS, and VRS), and to determine its validity for use in retrospective studies.
Patients and methods
This prospective cross-sectional study was performed on postoperative patients admitted to the Urology Department of Hippokration General Hospital (Thessaloniki, Greece) for a scheduled operation from March to October 2011.The patients underwent a variety of procedures (). This research was approved by the local ethics committee according to the principles of the Declaration of Helsinki on ethical principles of medical research.
Table 2 Demographic and baseline characteristics of the patient groups
Participants
Patients were randomly selected and recruited. Preoperative exclusion criteria were the inability to read or speak Greek, impaired cognitive function, performance status of at least two according to the Zubrod scale,Citation17 emergency procedures, chronic administration of analgesics, and chronic opioid or substance abuse. Postoperatively, all patients with continuous epidural or intravenous analgesia or a drop in hemoglobin level to <7 g/dL, patients who were temporally or spatially disoriented or unable to recognize familiar persons, as well as those with pain episodes that were encountered without medications (eg, bladder flushing or fixing catheter’s balloon), were excluded. To eliminate recall bias, patients were allocated into three groups according to the method of anesthetic administration (ie, local infiltration, spinal, or general anesthesia).
Measures
VAS
The VAS is presented as a 10 cm horizontal line, anchored by verbal descriptors labeled with “no pain” at point zero (0 cm) and “worst imaginable pain” at point ten (10 cm). The patient marks the line at the point corresponding to the intensity of the pain currently experienced. Using a 1 cm-per-point scale to measure the patient’s score, the VAS provides ten levels of pain intensity.Citation18 Although line orientation is important, the horizontal VAS was chosen for the current study, as the reading and writing tradition for Greek people is horizontal, from left to right.Citation18,Citation19
NRS
The NRS is an applied pain scale describing zero as “no pain” and ten as “worst imaginable pain.” The NRS is a horizontal line marked with numbers from zero to ten. The patient is asked to circle the currently experienced intensity of pain.
VRS
VRS comprises a list of adjectives used to denote increasing pain intensities. The most common words used are no pain, mild pain, moderate pain, and severe/excruciating pain. For ease of recording, these adjectives are assigned numbers.Citation18
PPSS
PPSS is the proposed scale system for the assessment of postoperative pain in retrospective studies. The score is obtained as a summation of points for each analgesic administered (via the intravenous route in the current study). The proposed scale is to be used in a clearly comparative manner, comparing pain intensity scores in retrospective studies to extract conclusions regarding factors affecting pain. It does not offer specific correlation of a score with a given level of pain.
A wide-edge writing pen, 3 mm thick, was provided to accommodate writing difficulties and any sensory impairment related to anesthetic recovery (minimizing patients’ effort to be precise). Each questionnaire was given on a separate A4 size paper with Times New Roman, size 20 font. Nonetheless, the VAS line was always exactly 10 cm long. The scales were completed in the presence of the research assistant, who gave all necessary instructions. The scale was removed from the patient’s view after rating their pain intensity to exclude memory recall from the patient before the next scale was presented. The exact technique described by Gagliese et al was followed.Citation20
Postoperative pain management
An artificial neural network was developed for drug administration decision-making purposes in the current study, according to the perioperative care guidelines of the authors’ hospital ().Citation21 The artificial neural network was developed in MATLAB R2009b (The MathWorks, Inc, Natick, MA).
Figure 1 The artificial neural network schema shows the factors affecting the decision for specific drug administration.
Abbreviations: NRS, numerical rating scale; VAS, visual analog scale; VRS, visual rating scale.
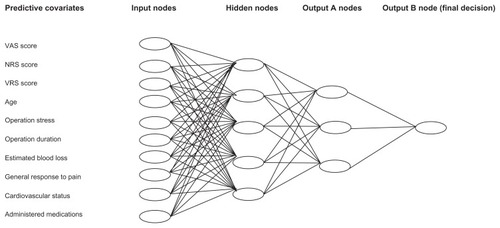
The output was divided in two groups of nodes. Output A represented the three basic categories of analgesics: weak nonnarcotic analgesics, strong nonnarcotic nonsteroidal antiinflammatory drugs or weak narcotics, and strong narcotics. Output B represented the final decision.
Procedure
At the time of admission, prior to the informed consent, the recruited patients were informed and each pain scale was completely described. During the first postoperative day, each pain episode was registered. The research assistant read the instructions to each patient. They were asked if the nature of the task was understood. If not, the instructions were repeated. The responses on the three scales and any additional comments were recorded. The patient’s mental status was assessed prior to obtaining their response. Analgesic drugs were administered intravenously and were noted in a specific study record. Thirty minutes after analgesic administration, the same patient was asked to fill in the same pain scales to evaluate the analgesic effect. Full blood count was taken immediately after returning to the surgical ward.
Statistical analysis
Data were analyzed by SPSS® version 16 (SPSS Inc, Chicago, IL). Descriptive statistics were used to analyze the study sample and the patients’ ability to complete the different pain scales.
Evaluation sample sufficiency
To determine if the subscales were suitable for factor analysis, two statistical tests were used: (1) Bartlett’s test of sphericity, which examines the interdependency of the subscales, and (2) the Kaiser–Meyer–Olkin criterion, which measures the sampling adequacy.Citation22 The Kaiser–Meyer–Olkin measure of sampling adequacy was 0.854 (patterns of correlations were relatively compact so factor analysis yielded distinct and reliable factors). Bartlett’s test of sphericity led to an approximate chi-square distribution of 1080.626 with 15,000 degrees of freedom and very significant correlation (P = 0.000).
Evaluation of the most efficient pain scale in the sample
In order to acquire methodologically sound and trustworthy data, each episode of pain was assessed by the three pain scales. Assuming that each patient felt the same pain intensity during the completion of each pain scale before and after analgesic administration, the following formula was used for each scale to test the efficacy of the treatment and monitor the progress:Citation23
Evaluation of the most appropriate scoring system for PPSS
The main method of extracting factors and validity assessment was examined using a principal component exploratory factor analysis with varimax rotation. Using orthogonal (varimax) rotation, the variance between variable loads is maximized on a specific factor. This way, small loads become smaller and big loads become bigger with reduction of in-between values, making it easier to interpret the results.Citation24 The criterion of an eigenvalue of one or more (Kaiser rule) defined the number of the factors that were kept.Citation25 Cronbach’s α was used to assess the internal consistency of the PPSS scoring system.Citation26 Cronbach’s α is the most important index since it factors in the mean correlations of all variables and does not depend on their arrangement.Citation27
Correlation of PPSS to the most efficient pain scale
Inferential statistics were used for the correlation of pain scales to PPSS and other variables of the study. Pearson’s and Spearman’s rho correlation coefficients were used to correlate the most appropriate scoring system for PPSS to the most efficient pain scale.
Results
In total, 150 patients were recruited. Twenty-six patients were excluded (six with postoperative confusion status and 20 with a pre/postoperative hemoglobin difference >7 g/dL). A total of 262 postoperative pain episodes during the first postoperative day were analyzed. The mean age of the study sample was 60.8 years (standard deviation 15.41 years; range 18–86 years). The ratio of male to female patients was 3.8:1 (98 males, 26 females). The demographic and baseline characteristics of each group are shown in .
The Kaiser–Meyer–Olkin index, which compares the size of the observed correlation coefficients to the size of the partial correlation coefficients for the sum of the analysis variables, was 85.4% (ie, reliable because it is >80%). In addition, the sphericity test (Bartlett’s sign < 0.01) was rejected on a level of statistical significance (P < 0.001) for an approximate Chi-square distribution of 1080.626. Consequently, the coefficients were not all zero and the second acceptance of factor analysis was satisfactory.
There were 1.92, 1.98, and 2.43 pain episodes during the first postoperative day per patient for the first, second, and third group, respectively. All patients were able to complete the three scales correctly. Patients of the first group did not require any help in completing the pain rating scales either before or after drug administration. In the second and third groups, 18.6% (n = 13) and 47.6% (n = 20) required further explanation on VAS and 8.6% (n = 6) and 38.1% (n = 16) required further explanation on both VAS and NRS, respectively. There was no significant correlation between education level and the inability to complete the scales. Postoperatively, the values for the second group and third group were 10% (n = 7) and 30.9% (n = 13) on VAS and 5.7% (n = 4) and 28.6% (n = 12) on both VAS and NRS, respectively. None of the patients had difficulty in the VRS scoring.
Using EquationEquation 1(1) , pain intensity reduction was more accurate with VAS and NRS (mean 78.03% and 68.67%, respectively) than with VRS (mean 63.07%) (). Eight different scoring combinations (factors) for PPSS were tested. The appropriate factors are represented graphically as a Cattell scree plot in . It shows a distinct break at the fourth component and thereafter forms the linear part of the eigenvalue curve. Taking under consideration the eigenvalues greater than one, four factors satisfactorily interpret the data: component one 1–3–7; component two 10–30–70; component three 1–2–3; and component four 0–1–2 scores for each analgesic category, respectively. The reliability coefficient, Cronbach’s α, was statistically significant and equal to 73.45%, 70.38%, 63.91%, 62.15% for the first, second, third, and fourth components, respectively. Therefore, the first component is the ideal scoring system for the PPSS.
Figure 2 Cattell scree plot for factor determination and evaluation of the proper scoring system.
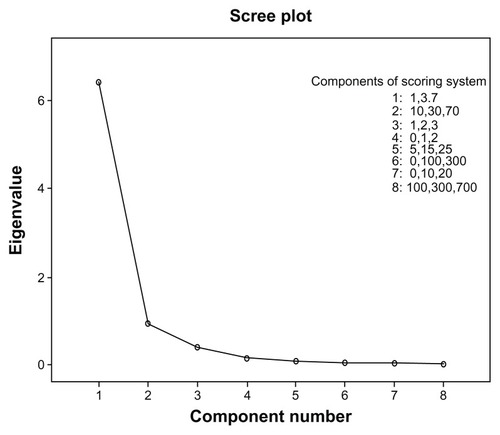
Table 3 Comparison of the treatment efficacy after intravenous administration of analgesics across the three pain scales
The total number of episodes (n = 262) was used to correlate the 1–3–7 scoring system for PPSS to VAS. Pearson’s and Spearman’s rho correlation coefficients were applied. Multiple regression analysis of the remaining variables such as sex, age, body mass index, educational level, duration of operation, difference in hemoglobin, and NRS were evaluated (). A strong correlation of VAS to PPSS (rho = 0.715; P < 0.001) and NRS (rho = 0.884; P < 0.001) was found. The results were verified by Pearson’s correlation (0.631 and 0.851, respectively; P < 0.001). Less effect was found for prolonged operation times and higher blood loss, while inconsiderable effect was found for body mass index, age, and education level. shows the plotted linear regression between VAS and PPSS (r2 = 0.702).
Figure 3 The relationship between the visual analog scale and the proposed pain point system scale, showing linear and strong correlation.
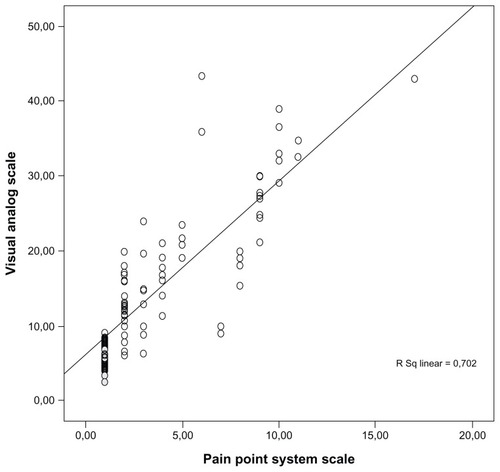
Table 4 Multiple regression analysis for sex, age, body mass index, educational level, operation duration, and reduction in hemoglobin level
The intergroup variability was also notable, since PPSS was found to correlate well with VAS in the first group (Pearson’s = 0.847; P < 0.001 and rho = 0.828; P < 0.001) but less so in the other two groups. It is noteworthy that this decline in PPSS efficiency is accompanied by the proportional decline of NRS (Pearson’s = 0.628 versus 0.620 for NRS and 0.702 versus 0.502 for PPSS in the second and third group, respectively) ().
Table 5 Pearson’s and Spearman’s rho correlations in the three studied groups
Discussion
This study examined the relationship between different pain scales in postoperative patients to construct the validity of PPSS. This proposed tool is intended for use in the pain intensity assessment of the postoperative period in retrospective studies. Three types of unidimensional pain measurement scales were considered: VAS, NRS, and VRS. All these tools are commonly used to measure pain intensity and are validated in both acute and chronic pain settings.Citation13,Citation28
In the medical literature, several studies have evaluated the accuracy of each method and some have compared their results.Citation29 For example, de Boer et al showed that VAS is a sufficient tool for use in acute pain settings.Citation30 Failure rates of VAS are between 4%–11%, which are reduced if the tool is carefully explained to the patient.Citation31,Citation32 Kremer et al reported lower failure rates of 1%–2% in NRS and VRS, as they found a significant age difference between patients able to complete VAS and those who were not (mean age 75.3 versus 54.4 years; P < 0.01).Citation23,Citation31 Failure rates are enhanced when dealing with children, patients with cognitive dysfunction, or when language difficulties exist.Citation32,Citation33
In the current study, the efficiency of these tools was calculated to find the scale to compare to the PPSS. The efficacy of VAS was 78.03%. The proposed PPSS was examined against VAS and it was found to be correlated strongly and linearly, but less so than NRS to VAS. Both scales seem to weaken their correlation to VAS in patients who underwent longer operations and had higher blood loss. These groups (second and third) of patients underwent spinal or general anesthesia, and this could be a masked bias to the analysis.
PPSS is correlated to the duration of operation and blood loss, indicating the need for analgesics in the early postoperative period. It does not correlate at all to sex, age, body mass index, and education level, indicating the true relationship to the contributing factors.
The main drawbacks of this study were the short cohort, the age distribution (59–71 years), the male to female ratio (3.8:1), and the evaluation of only urologic patients. Additionally, patients under continuous or balanced anesthesia were excluded. More studies are required to assess the affinity of PPSS for the objective evaluation of postoperative pain and also to examine the possible deployment of this tool in cancer-related pain or in other patients with chronic pain.
Conclusion
Pain rating scales have a fundamental place in clinical practice. The evidence suggests that patients are able to use them to communicate their pain experience and their response to treatment. Nevertheless, pain-measuring tools cannot be used retrospectively, especially when study purposes require pain assessment. The authors believe that PPSS will be a valuable tool in defining better treatment options and comparing therapies and patient preferences.
Disclosure
The authors report no conflicts of interest in this work.
References
- MerskeyHBogdukNClassification of Chronic Pain: Descriptions of Chronic Pain Syndromes and Definitions of Pain Terms2nd edSeattle, WAIASP Press1994
- BaderPEchtleDFonteyneVPost-operative pain managementGuidelines on Pain ManagementArnhem, The NetherlandsEuropean Association of Urology (EAU)20106182
- JacobsonLMarianoAJGeneral considerations of chronic painLoeserJDButlerSHChapmanCRTurkDCBonica’s Management of PainPhiladelphia, PALippincott Williams and Wilkins2001241254
- American Society of Anesthesiologists Task Force on Acute Pain ManagementPractice guidelines for acute pain management in the perioperative setting: an updated report by the American Society of Anesthesiologists Task Force on Acute Pain ManagementAnesthesiology200410061573158115166580
- RosenquistRWRosenbergJUnited States Veterans AdministrationPostoperative pain guidelinesReg Anesth Pain Med200328427928812945020
- DesboroughJPThe stress response to trauma and surgeryBr J Anaesth200085110911710927999
- SydowFWThe influence of anesthesia and postoperative analgesic management of lung functionActa Chir Scand Suppl19895501591652652967
- WarltierDCPagelPSKerstenJRApproaches to the prevention of perioperative myocardial ischemiaAnesthesiology200092125325910638923
- RosenfeldBABenefits of regional anesthesia on thromboembolic complications following surgeryReg Anesth199621Suppl 69128956414
- LivingstonEHPassaroEPJrPostoperative ileusDig Dis Sci19903511211322403907
- WilmoreDWKehletHManagement of patients in fast track surgeryBMJ2001322728447347611222424
- KehletHHolteKEffects of postoperative analgesia on surgical outcomeBr J Anaesth2001871627211460814
- CaraceniAChernyNFainsingerRPain measurement tools and methods in clinical research in palliative care: recommendations of an Expert Working Group of the European Association of Palliative CareJ Pain Symptom Manage200223323925511888722
- ClarkCWFerre-BrechnerTJanalMNCarrollJDYangJCThe dimensions of pain: a multidimensional scaling comparison of cancer patients and healthy volunteersPain198937123322726275
- JensenMPKarolyPSelf-report scales and procedures for assessing pain in adultsHandbook of Pain AssessmentTurkDCMelzackRNew York, NYGuilford Press1992135151
- World Health OrganizationThe Analgesic LadderGenevaWorld Health Organization1986
- OkenMMCreechRHTormeyDCToxicity and response criteria of the Eastern Cooperative Oncology GroupAm J Clin Oncol1982566496557165009
- WilliamsonAHoggartBPain: a review of three commonly used pain rating scalesJ Clin Nurs200514779880416000093
- SriwatanakulKKelvieWLasagnaLCalimlinJFWeisOFMehtaGStudies with different types of visual analog scales for measurement of painClin Pharmacol Ther19833422342396872418
- GaglieseLWeizblitNEllisWChanVWThe measurement of postoperative pain: a comparison of intensity scales in younger and older surgical patientsPain2005117341242016153776
- AnagnostouTRemziMLykourinasMDjavanBArtificial neural networks for decision-making in urologic oncologyEur Urol200343659660312767358
- KaiserHFAn index of factorial simplicityPsychometrika1974393136
- WilliamsonAHoggartBPain: a review of three commonly used pain rating scalesJ Clin Nurs200514779880416000093
- HairJFBlackWCBadinBJAndersonRETathamRLMultivariate Data Analysis6th edUpper Saddle River, NJPrentice Hall2006
- HairJFAndersonRETathamRLBlackWCMultivariate Data Analysis With Readings4th edUpper Saddle River, NJPrentice Hall1995
- CroanbachLJEssentials of Psychological Testing4th edNew York, NYHarper and Row1984
- AnastasiadouSFactorial validity evaluation of a measurement through principal components analysis and implicative statistical analysisHatzidimouDXMpikosKStravakouPAHatzidimouKD5th Greek Conference: Greek Pedagogic and Educational ResearchThessalonikiKyriakidis Brothers2006341348 Greek
- WallensteinSLHoudeRWThe clinical evaluation of analgesics effectivenessEhrenpreisSNeidleAMethods of Narcotic ResearchNew YorkMarcel Decker1975127145
- FadaizadehLEmamiHSamiiKComparison of visual analogue scale and faces rating scale in measuring acute postoperative painArch Iran Med2009121737519111034
- de BoerAGvan LanschotJJStalmeierPFIs a single-item visual analogue scale as valid, reliable and responsive as multi-item scales in measuring quality of life?Qual Life Res200413231132015085903
- KremerEAtkisonJHIgnelziRJMeasurement of pain: patient preference does not confound pain measurementPain19811022412487267140
- JoyceCRZutshiDWHrubesVMasonRMComparison of fixed interval and visual analogue scales for rating chronic painEur J Clin Pharmacol1975864154201233242
- CepedaMSAfricanoJMPoloRAlcalaRCarrDBAgreement between percentage pain reductions calculated from numeric rating scores of pain intensity and those reported by patients with acute or cancer painPain2003106343944214659527