Abstract
Background
Neuropathic pain (NeP) can be chronic, debilitating, and can interfere with sleep, functioning, and emotional well being. While there are multiple causes of NeP, few studies have examined the disease burden and treatment patterns associated with post-traumatic/post-surgical (PTPS) NeP.
Objective
To characterize pain, health status, function, health care resource utilization, lost productivity, and costs among subjects with PTPS NeP in the United States.
Methods
This observational study enrolled 100 PTPS NeP subjects recruited during routine visits from general practitioner and specialist sites. Subjects completed a one-time questionnaire with validated measures of pain severity and pain interference, health status, sleep, anxiety and depression, productivity, and study-specific items on demographics, employment status, and out-of-pocket expenses. Investigators completed a case report form based on a 6-month retrospective chart review, recording subjects’ clinical characteristics as well as current and previous medications/treatments for NeP. Subjects were stratified into mild, moderate, and severe pain groups.
Results
Subjects’ demographic characteristics were: mean age of 54.9 years, 53% female, and 22% employed for pay. Mean pain severity score was 5.6 (0–10 scale), with 48% and 35% classified as having moderate and severe pain, respectively. The mean number of comorbidities increased with greater pain severity (P = 0.0009). Patient-reported outcomes were worse among PTPS NeP subjects with more severe pain, including pain interference with function, health state utility, sleep, and depression (P < 0.0001). Eighty-two percent of subjects were prescribed two or more NeP medications. The total mean annualized adjusted direct and indirect costs per subject were $11,846 and $29,617, respectively. Across pain severity levels, differences in annualized adjusted direct and indirect costs were significant (P < 0.0001).
Conclusion
PTPS NeP subjects reported high pain scores, which were associated with poor health utility, sleep, mood, and function, as well as high health care resource utilization and costs. The quality of life impact and costs attributable to PTPS NeP suggest an unmet need for effective and comprehensive management.
Introduction
Neuropathic pain (NeP) is defined by the International Association for the Study of Pain as pain caused by a lesion or disease of the somatosensory nervous system,Citation1 and it is estimated that 15 to 20 million people over the age of 40 years in the US have one or more type of NeP.Citation2 NeP may result from a number of causes, including physical injury/trauma, systemic disease, infections, and autoimmune disorders.Citation3 Though the exact prevalence of post-traumatic/post-surgical NeP (PTPS NeP) is difficult to estimate, physical injury/trauma is accepted as the most common cause of nerve injuries.Citation4,Citation5 Trauma can result in nerves being partially or completely severed, crushed, compressed, or stretched, sometimes even resulting in partial or complete avulsion/detachment from the spinal cord. Less dramatic trauma also can cause serious nerve damage.Citation3 NeP symptoms may begin within days of nerve damage or can take months to be evident.Citation5 Individuals with NeP experience a variety of symptoms, including hypesthesia/numbness, paresthesia/tingling and pricking sensations, allodynia/sensitivity to touch, hyperpathia/burning pain and hyperalgesia/increased response to painful stimuli.Citation3
Previous research has shown that NeP can be chronic, interfering with sleep, functioning, and emotional well being.Citation6–Citation10 Specifically, in the context of PTPS NeP, several studies among patients with post-amputation or post-mastectomy NeP have found that those with NeP had a significantly lower quality of life as measured by the 36-item Short-Form Health Survey (SF-36), and that more severe NeP was associated with increased pain interference with function.Citation11–Citation13 Previous studies among patients with diabetes-, shingles- and chronic low back pain-related NeP also suggest that NeP can lead to increased health resource use (HRU) and direct and/or indirect costs,Citation10 and that these costs may differ across various NeP conditions.Citation14–Citation16 No published studies examining the economic burden associated with PTPS NeP were identified.
Given its prevalence, the objective of this study was to build on previous research and to more comprehensively characterize the burden of NeP among PTPS patients stratified by patient-reported pain severity levels. Specifically, this study sought to describe the impact of PTPS NeP on anxiety, depression, sleep, and health status; current treatment patterns and HRU; direct costs to payers and patients; and indirect costs due to NeP-related lost productivity.
Methods
This cross-sectional, observational study was conducted according to the Recommendations Guiding Physicians in Biomedical Research Involving Human Subjects contained in the Declaration of Helsinki,Citation17 and was approved by a central Institutional Review Board, Concordia Clinical Research (Cedar Knolls, NJ, USA). PTPS NeP subjects were recruited between September 2011 and March 2012 from 14 community-based US physician practices, including seven pain specialists, four general practitioners, two neurologists, and one rheumatologist.
PTPS NeP was defined as NeP following a known injury or surgical intervention. Pain symptoms may be felt at the site of the injury and/or radiate, usually away from the site in the normal distribution of the nerve involved. Pain must have been present at least 3 months following the injury or after intervention with the characteristic NeP qualities. As PTPS NeP patients presented for routine office visits, a trained physician or site coordinator identified and recruited subjects into the study. Interested subjects provided informed consent prior to data collection.
Adult subjects (≥18 years) diagnosed with PTPS NeP and managed at their physician’s practice for at least 6 months were eligible for enrollment. Subjects were required to read and understand English and be willing and able to provide written informed consent. Subjects were not eligible if they participated in an investigational drug study in the 6 months prior to enrollment, had a serious or unstable medical or psychological condition that would compromise participation in the study, or had a concomitant illness unrelated to PTPS NeP that may confound the assessment of PTPS NeP.
Data collection
Enrolled subjects completed a self-administered questionnaire, including questions on subject demographics, NeP symptom duration, PTPS NeP related nonprescription treatments, out-of-pocket costs due to PTPS NeP, and employment status, as well as the following validated patient-reported outcomes measures: the Brief Pain Inventory-Short Form (BPI-SF), 12-item Short-Form Health Survey (SF-12v2; 1-week recall), EuroQol five-dimensions, three-levels (EQ-5D-3L), Medical Outcomes Study Sleep Scale (MOS-SS) Sleep Scale, Hospital Anxiety and Depression Scale (HADS), and Work Productivity and Activity Impairment (WPAI) due to PTPS NeP. provides additional detail on each measure.
Table 1 Validated patient-reported outcome measures included in the subject questionnaire
Costing algorithms
Costs (2012 US$) were assigned to PTPS NeP-related HRU to calculate direct medical costs to payers. Unit costs were based on the fiscal year (FY) 2012 Medicare Physician Fee Schedule for office visits, procedures, and tests; on the FY 2012 Medicare Hospital Outpatient Prospective Payment System for hospital outpatient and emergency room (ER) visits; and FY 2012 Medicare Hospital Inpatient Prospective Payment System Diagnosis Related Groups (DRGs) for hospital admissions. Discharge diagnosis, procedures, and length of stay were used to map hospital admissions to appropriate DRG. The Redbook 2012 was used to assign unit costs to prescribed medications. We used discounted (16% discount for brand medications; 64.5% discount for generic medications) average wholesale price plus a dispensing fee to assign prescription medication costs.Citation18 Direct out-of-pocket costs of PTPS NeP to the subject were reported by subjects and did not need to be monetized.
Indirect costs related to work-related lost productivity due to PTPS NeP were calculated using the May 2010 (most recent) average hourly wage values obtained through the Bureau of Labor Statistics,Citation19 which were multiplied by the overall work impairment score from the Work Productivity and Activity Impairment.Citation20 Indirect costs for lost productivity for subjects who were unemployed, who retired early, or who had reduced work schedules due to PTPS NeP were calculated by multiplying the average hourly wage by time since their change in employment status due to PTPS NeP. Indirect costs for lost productivity for subjects that reported that their employment status was disabled/on disability due to PTPS NeP were calculated using the average hourly wage plus the average monthly disability payment from the Social Security Administration.Citation21
Annual costs attributable to PTPS NeP per subject were calculated and summarized as follows: direct medical costs to payers, direct out-of-pocket costs to subjects, and indirect costs.
Statistical methods
Summary statistics (means and standard deviations [SD] for continuous variables and frequency distributions for categorical variables) were used to describe the sample. BPI-SF average pain scores were used to classify pain severity as: 0–3 mild, 4–6 moderate, and 7–10 severe.Citation22,Citation23 Three subjects did not respond to all required items needed to calculate a BPI-SF average pain severity score and thus were not included in any analysis by pain severity category. To evaluate the association between pain severity categories and other outcomes, the Kruskal–Wallis test was used for continuous variables, and Chi-square or Fisher’s exact tests were used for categorical variables.
The association between pain severity and costs was examined using multiple (adjusted) linear regression. For the adjusted model, stepwise regression was used with the following pool of covariates: age, sex, race, ethnicity, pain severity, employment status, ability to walk, insurance coverage, PTPS NeP prescription drug coverage, workers’ compensation, time since diagnosis, and comorbid conditions. Statistical significance was evaluated at the 0.05 level. All analyses were performed using PC-SAS version 9.1.3 (SAS Institute, Cary, NC, USA).
Results
Demographic and clinical characteristics
The demographic and clinical characteristics of the sample overall and by average pain severity are presented in . Among the 100 PTPS NeP subjects enrolled, the mean (SD) age was 54.9 (12.9) years, and 53 (53.0%) were female. Twenty-two (22.0%) subjects were employed for pay; the remaining seventy-eight (78.0%) subjects were disabled/on disability, retired or unemployed. The mean pain severity score was 5.6 (2.1) overall (mild: 2.0 [1.1], moderate: 5.2 [0.8], severe: 7.7 [1.0]) with 83.0% of subjects experiencing moderate (48.0%) or severe (35.0%) pain. Ninety (90.0%) subjects experienced the trauma or surgery underlying their NeP more than 2 years prior to enrollment, and the average number of years that subjects had been experiencing symptoms was 9.8. Mean time from appearance of PTPS NeP symptoms to time of diagnosis was 9.7 months. Subjects had an average of 3.6 (2.3) comorbidities (data not shown); the most common were depressive symptoms (58.0%), sleep disturbance/insomnia (56.0%), and anxiety (44.0%) ().
Figure 1 PTPS NeP subjects reported a variety of comorbid conditions.a
Abbreviations: PTPS, post-traumatic/post-surgical; NeP, neuropathic pain; BPI-SF, Brief Pain Inventory-Short Form.
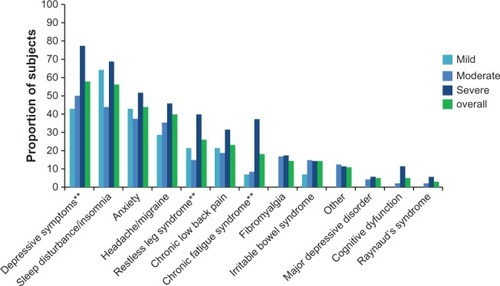
Table 2 Demographic and clinical characteristics, overall, by average pain severity
Health-related quality of life
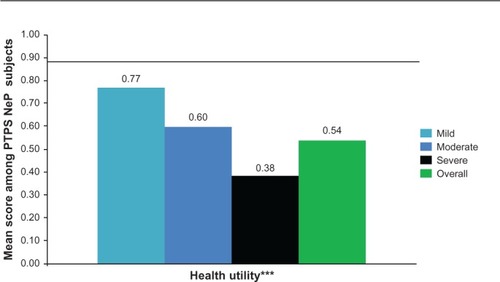
The mean SF-12 Physical Component Summary (PCS) and Mental Component Summary (MCS) scores were 30.1 (9.3) and 41.2 (12.7), respectively, and both the PCS and MCS scores were significantly lower among subjects with greater pain severity (P < 0.0005) (). The mean EQ-5D health utility was 0.54 (0.21) and was significantly worse among subjects with greater pain severity (P < 0.0001) ().
Figure 2 PTPS NeP subjects with more severe pain reported significantly worse physical and mental health.a
Abbreviations: PTPS, post-traumatic/post-surgical; NeP, neuropathic pain; BPI-SF, Brief Pain Inventory-Short Form; PCS, Physical Component Summary; MCS, Mental Component Summary; SF-12, Short-Form Health Survey.
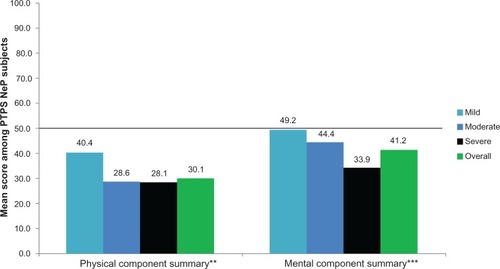
Figure 3 PTPS NeP subjects with more severe pain have significantly worse general health status.a
Abbreviations: PTPS, post-traumatic/post-surgical; NeP, neuropathic pain; BPI-SF, Brief Pain Inventory-Short Form; EQ-5D, EuroQol Five-Dimensions.
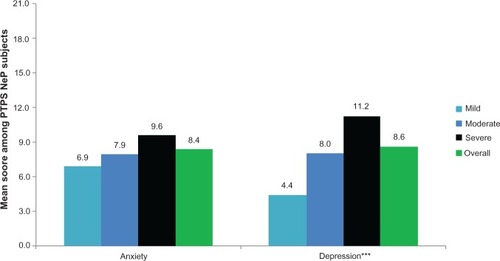
The mean BPI-SF pain interference index was 5.8 (2.4) and increased significantly as pain severity increased (P < 0.0001) (), with the most affected domain (domain with the highest mean score) being normal work (data not shown). Mean MOS-SS Sleep Problems Index and Sleep Disturbance score were 52.6 (20.8) and 59.0 (28.8), respectively; mean scores increased significantly among subjects with greater pain severity, indicating worse sleep outcomes (P ≤ 0.0001) (). Mean HADS scores were 8.4 (3.4) and 8.6 (4.6) for anxiety and depression, respectively, with a trend towards higher anxiety (P = 0.0553) and depression (P < 0.0001) scores among subjects with more severe pain (). Over half of PTPS NeP subjects experienced some level of anxiety (56.0%) and depression (58.0%) (data not shown).
Figure 4 PTPS NeP subjects with more severe pain experience, more interference with function.a
Abbreviations: PTPS, post-traumatic/post-surgical; NeP, neuropathic pain; BPI-SF, Brief Pain Inventory-Short Form.
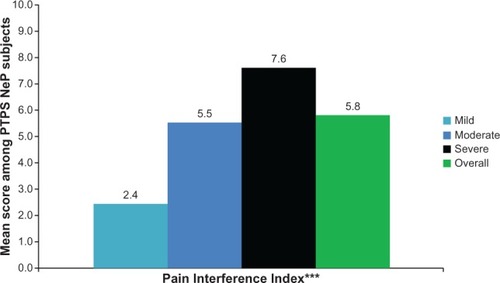
Figure 5 PTPS NeP subjects with more severe pain reported worse sleep outcomes.a
Abbreviations: PTPS, post-traumatic/post-surgical; NeP, neuropathic pain; BPI-SF, Brief Pain Inventory-Short Form; MOS-SS, Medical Outcomes Study Sleep Scale.
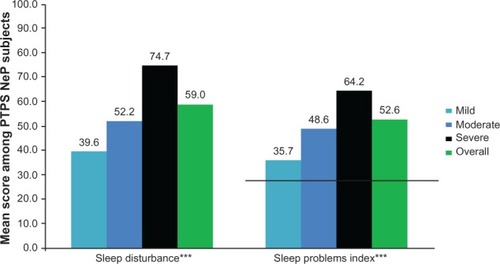
Figure 6 PTPS NeP subjects with more severe pain experience, more anxiety and depression.a
Abbreviations: PTPS, post-traumatic/post-surgical; NeP, neuropathic pain; BPI-SF, Brief Pain Inventory-Short Form; HADS, Hospital Anxiety and Depression Scale.
Health resource use
The PTPS NeP-related HRU among the sample is presented in . The majority (82.0%) of subjects were prescribed two or more PTPS NeP medications in the past 6 months, with an average of 2.6 (1.5) prescriptions per subject. The most frequently prescribed classes of medications were opioids (67.0%), antiepileptics (39.0%), and muscle relaxants (25.0%) (). Strong short-acting opioids (47.0%) were the most frequently prescribed subclass of opioids, followed by long-acting opioids (31.0%). Oxycodone hydrochloride immediate release (27.7%) and oxymorphone immediate release (23.4%) were the most frequently prescribed strong short-acting opioids (data not shown). Oxymorphone extended release (45.2%) and tapentadol (29.0%) were the most frequently prescribed long-acting opioids (data not shown). Gabapentin (53.8%) and pregabalin (30.8%) were the most frequently prescribed antiepileptics (data not shown).
Figure 7 Use of PTPS NeP prescription medications.
Abbreviations: PTPS, post-traumatic/post-surgical; NeP, neuropathic pain; SNRI, serotonin–norepineprhine reuptake inhibitor; NSAIDs, nonsteroidal anti-inflammatory drugs; TCAs, tricyclic antidepressants.
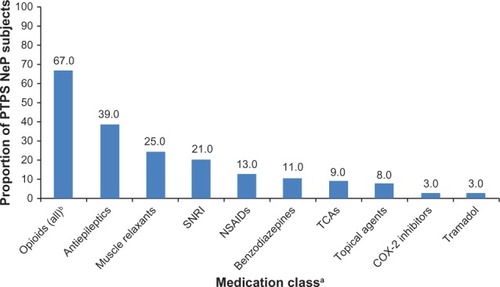
Table 3 Resource utilization for PTPS NeP, overall, by average pain severity
Nearly half (45.0%) of the subjects reported taking non-prescription treatments for their PTPS NeP in the past 4 weeks, with a mean of 0.9 (1.2) non-prescription treatments per subject.
Subjects had an average of 5.3 (2.5) PTPS NeP-related physician office visits, per subject, in the prior 6 months, with significantly more physician office visits among subjects with more severe pain (P = 0.0065). The mean number of office-based tests and procedures performed in the 6 months prior was 1.4 (1.8). There were three PTPS NeP subjects with hospitalizations for PTPS NeP, two PTPS NeP subjects with ER visits for PTPS NeP, and three PTPS NeP subjects with hospital outpatient visits for PTPS NeP.
Lost productivity and impact of PTPS NeP on employment status
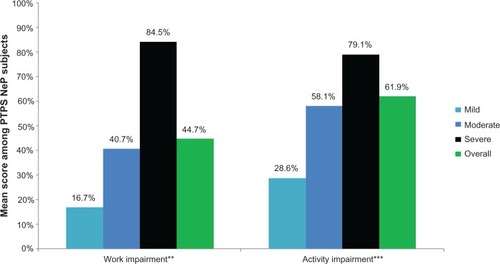
Seventy-eight (78.0%) subjects were not employed for pay (). shows the impact of PTPS NeP on subjects’ employment status. Overall, 38 of the 48 disabled subjects were disabled due to their PTPS NeP; the other ten were disabled as a result of the underlying trauma or surgery or another condition altogether. Among subjects employed for pay, the mean overall work impairment was 44.7% (27.8%). Across the entire sample, the mean overall activity impairment due to PTPS NeP was 61.9% (25.3%). Both overall work and activity impairment increased/worsened with increased pain severity (P < 0.0027) ().
Figure 8 PTPS NeP impact on employment status.a,**
Abbreviations: PTPS, post-traumatic/post-surgical; NeP, neuropathic pain; BPI-SF, Brief Pain Inventory-Short Form.
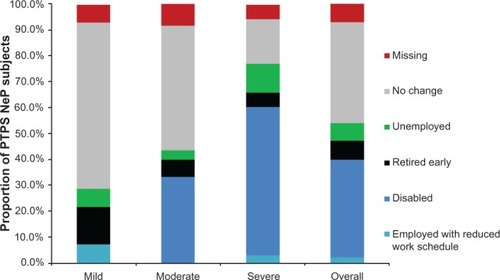
Figure 9 PTPS NeP subjects with more severe pain experienced greater losses in productivity.a
Abbreviations: PTPS, post-traumatic/post-surgical; NeP, neuropathic pain; BPI-SF, Brief Pain Inventory-Short Form; WPAI, Work Productivity and Activity Impairment.
Costs
The unadjusted mean (SD) annualized direct cost per subject was $12,121 ($11,036), and this increased as pain severity increased (mild: $6,431 [$4,595], moderate: $10,093 [$7,692], severe: $16,787 [$14,872]; P = 0.0054) (data not shown). The largest proportion of costs was for prescription drugs (51.1%), followed by out-of-pocket medical costs to subjects (16.0%) and hospitalizations (8.3%) (data not shown). The unadjusted mean annualized indirect cost per subject was $30,425 ($25,061) overall, and was the highest among those with greater pain severity (mild: $12,617 [$18,010], moderate: $24,410 [$24,623], severe: $45,134 [$19,818]; P < 0.0001) (data not shown). The largest proportion was for lost productivity due to being disabled as a result of PTPS NeP (65.8%), followed by lost productivity due to absenteeism and presenteeism (13.4%) (data not shown).
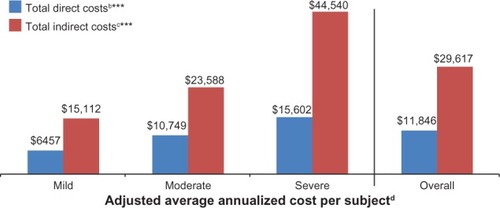
Costs were adjusted using stepwise regression; the adjusted annualized costs per subject are presented in . the total mean (95% confidence interval) annualized adjusted direct and indirect costs per subject were $11,846 ($9,925, $13,767) and $29,617 ($25,271, $33,962), respectively. Across pain severity levels, differences in annualized adjusted direct and indirect costs were significant (P < 0.0001). The covariates remaining in the model for direct costs were ethnicity, prescription coverage, and comorbidities (headache/migraine, major depressive disorder, irritable bowel syndrome, cognitive dysfunction, chronic fatigue syndrome, sleep disturbance/insomnia, chronic low back pain, and other). The covariates remaining in the model for indirect costs were age, race, pain severity, and comorbidities (major depressive disorder and irritable bowel syndrome).
Figure 10 Adjusted average annualized cost per PTPS NeP subject, overall and by average pain severity.a
Abbreviations: PTPS, post-traumatic/post-surgical; NeP, neuropathic pain; BPI-SF, Brief Pain Inventory-Short Form; TENS, transcutaneous electrical nerve stimulation; LS, least squares.
Discussion
To our knowledge, this is the first study to comprehensively evaluate the overall burden of PTPS NeP among adults in the US, inclusive the impact of PTPS NeP on health status, functioning, sleep, anxiety, depression, HRU, lost productivity, and costs.
SF-12 PCS and MCS scores and EQ-5D health state utilities across pain severity groups indicate an inverse relationship between pain severity and health status. Despite the fact that subjects were actively managed, PTPS NeP subjects experienced high levels of pain and had a substantially lower health status than the general US population across normative values,Citation24,Citation25 particularly for those with more severe pain ( and ). The meaningfully-important difference for the PCS and MCS is 3.0;Citation24 the mean scores overall and among those with moderate and severe pain suggest meaningfully worse scores compared to the general US population and PTPS NeP subjects with mild pain. These results are consistent with previous research among post-mastectomy subjects with and without NeP.Citation12
PTPS NeP subjects with greater pain severity experienced significantly more sleep problems and greater sleep disturbance compared to subjects with less severe pain (P < 0.0001). Overall, and for each pain severity subgroup, PTPS NeP subjects had markedly higher scores (indicating worse sleep) compared with US normative data on the MOS-SS Sleep Problems Index ().Citation26 Differences across pain severity were also observed in the BPI-SF Pain Interference Index (P < 0.0001). Subjects also showed a significant increase in overall activity impairment with increasing pain severity (P < 0.0001), suggesting an association between pain and activities of daily living in this patient population. The interference of PTPS NeP with functioning was reported in a previous study of subjects with post-amputation pain, in which a systematic increase in pain interference was observed, as pain intensity ratings increased.Citation11
While over half of all PTPS NeP subjects reported depressive symptoms, an ever greater prevalence (77.1%) was reported among those with severe pain. Mean HADS depression scores also suggest that subjects with severe PTPS NeP may have concomitant depression. More effective management of PTPS NeP and associated comorbidities may have a positive impact on the marked humanistic burden of PTPS NeP.
High total direct medical costs per subject that were attributable to PTPS NeP were driven primarily by prescription medications and out-of-pocket medical costs to subjects. Given the high rate of prescription medication use (46.0% taking three or more medications), it is not surprising that medications drove direct costs. It is interesting that opioids were the most commonly prescribed medication class, as their position as “first-line” pharmacologic choices for NeP is controversial.Citation27–Citation29 The high opioid use and high pain levels among these subjects speaks to an unmet need in the management of chronic NeP.
One aspect of the patient burden that has not been previously explored and is an important finding of this study is the impact of PTPS NeP on productivity and employment. Most PTPS NeP subjects in our study were not employed full-time, and a substantial proportion were disabled due to their condition. The impact of PTPS NeP on employment was also reported by Whyte and Carroll.Citation30 Subjects with postamputation NeP were significantly less likely to be employed than amputees without NeP. In another study of subjects with postamputation NeP, more than a quarter of the sample was classified as having high pain-related disability that is moderately or severely limiting.Citation31 Other studies have shown the impact of PTPS NeP on function and employment,Citation11–Citation13,Citation30,Citation31 but this study was able to demonstrate the very real impact of this decrement on patients and society in monetary terms. Indirect costs due to absenteeism, presenteeism, and changes in employment status due to PTPS NeP accounted for the majority of total costs. Changes in employment status, particularly disability, due to PTPS NeP, accounted for the majority of the indirect costs. Although a minority of subjects was employed for pay, lost productivity due to absenteeism and presenteeism was the second largest component of indirect costs.
The economic burden (both direct and indirect costs) of PTPS NeP increased significantly among subjects with greater pain severity. More effective management of PTPS NeP may reduce HRU and lost productivity, and could provide cost savings to payers, patients, and employers.
Limitations
Subjects enrolled in this study were actively seeking medical care for their PTPS NeP (enrolled when presenting for routine office visit). Further, this study enrolled subjects diagnosed with PTPS NeP at least 6 months prior who had been managed at the physician’s practice for the same time period. As such, these findings may not be generalizable to others with PTPS NeP who are not seeking treatment or do not regularly visit their physicians.
In this study, individuals with NeP resulting from either surgery or trauma were eligible for enrollment. The specific cause of the subjects’ NeP was not captured. Future studies could determine the possible differences and/or similarities in costs and humanistic burden among subjects with post-trauma and post-surgical NeP. Such studies may be best performed by separating trauma patients who received surgery from those who did not, and by categorizing post-surgical patients according to surgical procedure. Because the incidence of chronic pain, including NeP, has been shown to vary according to surgical procedure,Citation32 it is possible that there may be other differences in NeP among post-surgical patients in terms of disease burden and/or costs.
This cross-sectional study required a retrospective review of medical records, which likely led to underreporting of HRU. The subject’s medical record may not include all visits to other physicians, health care providers, or facilities, including PTPS NeP-related tests and procedures, and medications prescribed outside of the study site. Similarly, HRU data captured was based on the site’s assessment of HRU attributable to PTPS NeP. It may have been difficult to distinguish NeP-related HRU from HRU due to the underlying surgery or trauma.
Costs were assigned to HRU using standard algorithms, which may have over or underestimated costs. Finally, lost productivity and out-of-pocket costs were based on subject recall, and may have resulted in cost over- or underestimation.
Conclusion
Despite receiving active management, the vast majority of subjects with PTPS NeP in this study had moderate or severe pain, on average, and reported suboptimal levels of overall health, functioning, and well being. Outcomes worsened among subjects with greater pain severity. Further, the economic burden, particularly the indirect costs, of PTPS NeP was substantial. The impact on quality of life and costs attributable to PTPS NeP highlight the unmet need and the potential benefits of more effective management of PTPS NeP.
Acknowledgments
We thank Gergana Zlateva, PhD, Felicia Bergstrom, MSPH, and Rebecca Baik, BS, for their contributions to the study.
Disclosure
This research was supported by Pfizer, Inc. Bruce Parsons and Alesia Sadosky are paid employees of Pfizer, Inc. Caroline Schaefer, Rachael Mann, and Shoshana Daniel are employees of Covance Market Access Services, Inc, who were paid consultants to Pfizer, Inc, in the development and execution of this study and manuscript. Doctors Alan Anschel and Srivinas Nalamachu were paid investigators for the study, but were not financially compensated for their publication-related activities. Doctors Brett Stacey, Edward Nieshoff, and Michael Tuchman were not financially compensated for their collaborative efforts on this project, including publication-related activities. The authors report no other conflicts of interest in this work.
References
- International Association for the Study of PainIASP taxonomy: pain terms [webpage on the Internet]Washington, DCInternational Association for the Study of Pain2011 Available from: http://www.iasp-pain.org/Content/NavigationMenu/GeneralResourceLinks/PainDefinitions/default.htmAccessed April 8, 2013
- GreggEWGuQWilliamsDPrevalence of lower extremity diseases associated with normal glucose levels, impaired fasting glucose, and diabetes among US adults aged 40 or olderDiabetes Res Clin Pract200777348548817306411
- International Association for the Study of PainDiagnosis and classification of neuropathic painInternational Association for the Study of Pain: Pain Clinical Updates201018716
- National Institute of Neurological Disorders and StrokePeripheral neuropathy fact sheet [webpage on the Internet]Bethesda, MDNational Institute of Neurological Disorders and Stroke2012 Available from: http://www.ninds.nih.gov/disorders/peripheralneuropathy/detail_peripheralneuropathy.htmAccessed November 26, 2012
- FreynhagenRBennettMIDiagnosis and management of neuropathic painBMJ2009339b300219675082
- TölleTDukesESadoskyAPatient burden of trigeminal neuralgia: results from a cross-sectional survey of health state impairment and treatment patterns in six European countriesPain Pract20066315316017147591
- GoreMBrandenburgNADukesEHoffmanDLTaiKSStaceyBPain severity in diabetic peripheral neuropathy is associated with patient functioning, symptom levels of anxiety and depression, and sleepJ Pain Symptom Manage200530437438516256902
- GoreMBrandenburgNAHoffmanDLTaiKSStaceyBBurden of illness in painful diabetic peripheral neuropathy: the patients’ perspectivesJ Pain200671289290017157775
- JensenMPChodroffMJDworkinRHThe impact of neuropathic pain on health-related quality of life: review and implicationsNeurology200768151178118217420400
- SadoskyASchaeferCMannRBurden of illness associated with painful diabetic peripheral neuropathy among adults seeking treatment in the US: results from a retrospective chart review and cross-sectional surveyDiabetes Metab Syndr Obes20136799223403729
- JensenMPSmithDGEhdeDMRobinsonLRPain site and the effects of amputation pain: further clarification of the meaning of mild, moderate, and severe painPain200191331732211275389
- MacdonaldLBruceJScottNWSmithWCChambersWALong-term follow-up of breast cancer survivors with post-mastectomy pain syndromeBr J Cancer200592222523015655557
- van der SchansCPGeertzenJHSchoppenTDijkstraPUPhantom pain and health-related quality of life in lower limb amputeesJ Pain Symptom Manage200224442943612505212
- DworkinRHPanaritesCJArmstrongEPMaloneDCPhamSVHealthcare utilization in people with postherpetic neuralgia and painful diabetic peripheral neuropathyJ Am Geriatr Soc201159582783621568954
- daCosta DiBonaventuraMCappelleriJCJoshiAVA longitudinal assessment of painful diabetic peripheral neuropathy on health status, productivity, and health care utilization and costPain Med201112111812621087406
- MehraMHillKNichollDSchadrackJThe burden of chronic low back pain with and without a neuropathic component: a healthcare resource use and cost analysisJ Med Econ201215224525222136441
- Declaration of Helsinki Adopted by the 18th World Medical Assembly (WMA) General Assembly H, Finland, 1964; amended by the 29th WMA General Assembly in Tokyo, Japan in 1975, the 35th WMA General Assembly in Venice, Italy in 1983, the 41st WMA General Assembly in Hong Kong in 1989, the 48th WMA General Assembly in Somerset West, Republic of South Africa in 1996, and the 52nd WMA General Assembly in Edinburgh, Scotland2000http://www.wma.net/en/30publications/10policies/b3/index.html
- Pharmacy Benefit Management Institute, LPPharmacy and drug manufacturer reimbursement [webpage on the Internet]Plano, TXPharmacy and Benefit Management Institute, LP2012 Available from: http://www.benefitdesignreport.com/PharmacyReimbursement/tabid/66/Default.aspxAccessed April, 23, 2012
- US Bureau of Labor StatisticsMay 2010 National Occupational Employment and Wage Estimates [website on the Internet]Washington, DCUnited States Department of Labor, Bureau of Labor Statistics Available from: http://www.bls.gov/oes/2010/may/oes_nat.htmAccessed April 25, 2012
- LoflandJHPizziLFrickKDA review of health-related workplace productivity loss instrumentsPharmacoeconomics200422316518414871164
- US Social Security AdministrationAnnual Statistical Supplement2011 Table 5.D1 [webpage on the Internet]. Available from: http://www.ssa.gov/policy/docs/statcomps/supplement/2011/5d.htmlAccessed April 23, 2012
- ZelmanDCDukesEBrandenburgNBostromAGoreMClassification of mild, moderate and severe pain due to diabetic peripheral neuropathy based on levels of functional disabilityJ Pain20045Suppl 1114
- ZelmanDCDukesEBrandenburgNBostromAGoreMIdentification of cut-points for mild, moderate and severe pain due to diabetic peripheral neuropathyPain520051151–2293615836967
- WareJEKMTurner-BowkerDMSundaram MGandekBMaruishMEUser’s Manual for the SF-12v2 Health Survey Second EditionQualityMetric, Incorporated2009
- LuoNJohnsonJAShawJWFeenyDCoonsSJSelf-reported health status of the general adult US population as assessed by the EQ-5D and Health Utilities IndexMed Care200543111078108616224300
- HaysRDMartinSASestiAMSpritzerKLPsychometric properties of the Medical Outcomes Study Sleep Scale measureSleep Med200561414415680294
- AttalNCruccuGBaronREuropean Federation of Neurological SocietiesEFNS guidelines on the pharmacological treatment of neuropathic pain: 2010 revisionEur J Neurol2010179e1113e1188
- DworkinRHO’ConnorABBackonjaMPharmacologic management of neuropathic pain: evidence-based recommendationsPain2007132323725117920770
- DworkinRO’ConnorABAudetteJRecommendations for the pharmacological management of neuropathic pain: an overview and literature updateMayo Clin Proc201085Suppl 3S3S1420194146
- WhyteASCarrollLJA preliminary examination of the relationship between employment, pain and disability in an amputee populationDisabil Rehabil200224946247012097215
- EhdeDMCzernieckiJMSmithGDChronic phantom sensations, phantom pain, residual limb pain, and other regional pain after lower limb amputationArch Phys Med Rehabil20008181039104410943752
- MacraeWAChronic post-surgical pain: 10 years onBr J Anaesth20081011778618434337
- CleelandCSRyanKMPain assessment: global use of the Brief Pain Inventory-Short FormAnn Acad Med Singapore19942321291388080219
- WareJJrKosinskiMKellerSDA 12-Item Short-Form Health Survey: construction of scales and preliminary tests of reliability and validityMed Care19963432202338628042
- RabinRde CharroFEQ-5D: a measure of health status from the EuroQol GroupAnn Med200133533734311491192
- SnaithRPZigmondASThe hospital anxiety and depression scaleBr Med J (Clin Res Ed)19862926516344
- ZigmondASSnaithRPThe hospital anxiety and depression scaleActa Psychiatr Scand19836763613706880820
- ReillyMCZbrozekASDukesEMThe validity and reproducibility of a work productivity and activity impairment instrumentPharmacoeconomics19934535336510146874