
Abstract
Background
Similarities and differences on the nine-item and seven-item versions of painDETECT, a patient-reported screener to identify neuropathic pain (NeP), have not been psychometrically explored across NeP conditions.
Methods
Scores on the nine-item painDETECT (seven pain symptom items, one pain course pattern item, one pain radiation item) range from −1 to 38; scores ≥19 indicate NeP is likely (>90% probability). The seven-item version (only pain symptoms) score range is 0 to 35. painDETECT was administered to subjects with confirmed diagnoses of human immunodeficiency virus-related peripheral NeP (HIVP) (n=103), spinal cord injury-related NeP (SCI) (n=103), small fiber neuropathy (n=100), painful diabetic peripheral neuropathy (n=112), posttrauma/postsurgical NeP (n=100), and NeP in chronic low back pain (n=106) identified during office visits to US community-based physicians. Analysis of covariance compared mean scores (adjusted for age, sex, race, ethnicity, time since NeP diagnosis, and number of comorbidities) on the nine-item and seven-item versions of painDETECT. Cronbach’s alpha assessed internal consistency reliability, and corrected item-to-total correlations assessed item-level discrimination.
Results
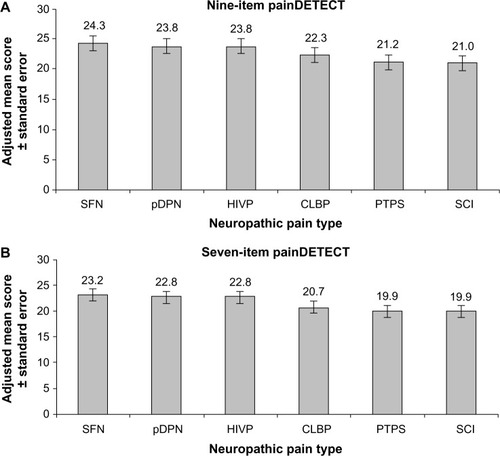
The adjusted mean nine-item scores ranged from 21.0 (SCI) to 24.3 (small fiber neuropathy). Differences between conditions were either trivial or small-to-medium in magnitude. Cronbach’s alpha gave overall internal consistency reliability of 0.76, with a range of 0.63 (SCI) to 0.82 (HIVP). Mean scores and Cronbach’s alphas for the seven-item version were generally similar to the nine-item version. Corrected item-to-total correlations adequately discriminated all pain symptom items on both painDETECT versions for each condition (0.3–0.7), but the two nonsensory items on the nine-item version showed lackluster discrimination (<0.3).
Conclusion
painDETECT scores were within the range indicating high probability of NeP. Differences between conditions were generally modest or not large. Both versions showed evidence of internal consistency reliability and item-level discrimination, suggesting that painDETECT is a useful screening measure for identifying NeP across NeP conditions.
Introduction
Chronic pain continues to be one of the most clinically and economically important medical conditions.Citation1,Citation2 A key component of chronic pain management is the identification of the presence of neuropathic pain (NeP), since treatment of NeP is often more challenging and relies primarily on use of appropriate pharmacologic therapies that are different from those in the treatment of nociceptive pain.Citation3,Citation4 The overall prevalence of NeP in the general population is not known, although a recent review suggested a best estimate of approximately 7%–10%.Citation5 This uncertainty surrounding NeP prevalence results primarily from what has been an absence of an instrument that can adequately screen and estimate the presence of NeP across a range of conditions in the population. Thus, epidemiologic studies have primarily focused on individual NeP conditions, and there remains a need for demonstrating that NeP screening measures broadly identify NeP regardless of the condition.
NeP, which can be of peripheral origin or central origin, is caused by a lesion or disease of the peripheral or central somatosensory nervous systems, respectively, and can result from a variety of diseases and medical conditions.Citation6 Differences in the symptoms and pain descriptors of NeP relative to nociceptive pain have been used to develop measures to increase the likelihood of differentiating patients with these pain types. Such measures would be especially useful for screening if they demonstrate both sensitivity and specificity for identifying NeP across a range of NeP conditions among a population of patients with chronic pain.
One such measure is painDETECT,Citation7 a patient-reported questionnaire. painDETECT is considered a useful tool for screening patients for the presence of a NeP component,Citation8,Citation9 and its psychometric validity and ability as a screening instrument for epidemiologic studies were evaluated in patients with chronic low back pain-associated NeP (CLBP).Citation7 Its use in other specific NeP conditions has been suggested by translation adaptation studies in populations of patients with mixed NeP conditionsCitation10,Citation11 and by a study that used painDETECT to characterize NeP in painful diabetic neuropathy and postherpetic neuralgia.Citation12
While painDETECT was initially developed as a nine-item questionnaire, which demonstrated strong predictive ability for NeP, principal component analysis identified the seven sensory items as driving the data structure of the questionnaire.Citation7 Therefore, a seven-item version of painDETECT is also available that only includes the sensory symptom items. However, since pain sensory symptom profiles may vary across and even within NeP conditions,Citation12–Citation15 it is necessary to confirm that the psychometric properties of both versions of painDETECT are consistent regardless of the underlying cause of NeP.
A recent study on the humanistic burden and economic burden of NeP across six NeP conditions included painDETECT as part of the outcomes measures captured.Citation16,Citation17 Data from this study were used to demonstrate the ability of painDETECT to discriminate among average pain severity levels of mild, moderate, and severe pain.Citation18 The same study also affords the opportunity to evaluate measurement properties of painDETECT across the six conditions overall and individually. Therefore, the objective of the present analysis was to garner evidence on similarities and differences between the nine-item and seven-item versions of the painDETECT measure for six different NeP conditions by psychometrically assessing the scoring, internal consistency reliability, and item-level discrimination of painDETECT for identifying NeP components. Doing so also may potentially enable its use in epidemiologic studies of NeP in general populations.
Methods
Data source and population
The data source for this analysis was a cross-sectional, observational study on the burden of six NeP conditions that included painful diabetic peripheral neuropathy (pDPN), human immunodeficiency virus-related peripheral NeP (HIVP), posttrauma/postsurgical NeP (PTPS), spinal cord injury-related NeP (SCI), CLBP, and small fiber neuropathy (SFN). The study was approved by a central institutional review board (Concordia Clinical Research, Cedar Knolls, NJ, USA); all data collection and analysis were compliant with the Health Insurance Portability and Accountability Act.
For inclusion in the study, adult subjects (≥18 years old) with a confirmed diagnosis of any of the six NeP conditions were identified during routine office visits at 33 community-based physician practices across the United States between September 2011 and June 2012. Case definitions used to identify the individual NeP conditions have previously been described,Citation16 and reflect the wider population of each condition. The diagnoses were confirmed by the participating physicians, including general practitioners (n=9), neurologists (n=7), pain specialists (n=6), endocrinologists (n=3), and other specialists (eg, orthopedist, infectious disease specialist, podiatrist, rheumatologist; n=8). In order to examine real-world clinical practice, participating physicians were determined based on a feasibility assessment prior to study initiation, and were limited to those physicians who stated they were comfortable confirming an NeP diagnosis.Citation16
Subjects were required to have been managed at the practice for at least 6 months prior to enrollment, and to have had the diagnosis for at least 6 months with NeP symptoms experienced for at least 3 months. Patients were excluded if they participated in an investigational drug study in the past 6 months; presented with a serious or unstable medical or psychological condition that, in the opinion of the physician, would compromise study participation; or had a concomitant illness unrelated to NeP that could have confounded NeP assessment. Since physician diagnosis of NeP was used as the gold standard to identify the patients for inclusion, painDETECT was not administered as a screening instrument.
Outcomes and analyses
At the time of the office visit, subjects agreeing to participate completed a series of self-administered, one-time questionnaires primarily designed to elicit information on the patient-reported burden, and which included self-reported measures of pain, function, quality of life, and productivity; results describing the disease burden have previously been reported.Citation16,Citation17,Citation19–Citation24 painDETECT was also included in the battery of questionnaires to characterize the NeP in these subjects.
The original painDETECT consists of nine items: seven sensory symptom items for pain that are graded from 0 (= never) to 5 (= strongly), one temporal item on pain course pattern graded −1 to +1, and one spatial item on pain radiation graded 0 (for no radiation) or +2 (for radiating pain). The total score of the nine-item version ranges from −1 to 38, where scores ≥19 indicate NeP is likely with a >90% probability, and scores ≤12 indicate NeP is unlikely (ie, nociceptive pain); scores 13–18 are unclear, but an NeP component may be present.Citation7 The seven-item version of painDETECT includes only the sensory symptom items, with a total score that ranges from 0 to 35. Both the nine-item version and seven-item version of painDETECT were used in the current analysis.
Differences in demographic and clinical characteristics across the conditions were evaluated using analysis of variance for continuous variables and chi-square for categorical variables. Analysis of covariance models were used to compare the results of mean scores (adjusted for age, sex, race, ethnicity, time since NeP diagnosis, and number of comorbidities) on each version of painDETECT to determine whether the six conditions differed with respect to the magnitude of NeP and, if so, to what extent.
In addition to statistical comparison of the difference in mean adjusted scores between pairs of conditions (a P-value <0.05, with Tukey’s adjustment for multiple comparisons, was considered statistically significant), corresponding standardized effect sizesCitation25,Citation26 were derived for pairwise comparisons of all conditions. A standardized effect size is measured in standard deviation units that reflect the magnitude of the difference in means between two groups. All standardized effect sizes were estimated by taking the difference between the adjusted means of painDETECT scores from two of the six NeP groups and dividing them by the pooled standard deviation of the scores across the six groups. A standardized effect size of 0.20 standard deviation units is considered “small”, while 0.50 and 0.80 are “medium” and “large”, respectively.Citation25,Citation26
Scale-level reliability was evaluated for each NeP condition using Cronbach’s coefficient alpha (covariance-based formula)Citation26 to determine the internal consistency reliability of the nine- and seven-item versions of painDETECT. Cronbach’s alpha coefficients of at least 0.70 are generally regarded as acceptable for a psychometric scale, with values between 0.81 and 0.90, inclusive, considered good, and >0.90 considered excellent.Citation26 In addition, P-values were estimated for pairwise comparison of the statistical significance of Cronbach’s alpha between conditions.Citation27 To determine the discriminative ability of each items, assessment of item-level discrimination was performed overall and for each condition using corrected item-to-total correlations.Citation26 This correction, obtained by deleting the item under consideration from the total (summed) score, was used to account for item overlap, with a value ≥0.4 considered an adequate level of discriminative ability.Citation26
Assessment of average pain severity was based on the average pain question on the Brief Pain Inventory Short-Form, which uses an 11-point numeric rating scale (0= no pain to 10= pain as bad as you can image) to rate pain severity;Citation28 cut points for mild (scores 0–3), moderate (scores 4–6), and severe (scores 7–10) pain have previously been established.Citation29 The relationship between average pain severity and painDETECT scores was evaluated using Pearson correlation coefficients, where (absolute) values ≤0.30 are generally considered low, between 0.30 and 0.50 are moderate, and ≥0.50 are high.Citation25
All analyses and statistics were performed using SAS version 9.2 (SAS Institute Inc., Cary, NC, USA).
Results
The study enrolled 624 subjects who were identified with the NeP conditions, and there were similar proportions of subjects with each of the NeP conditions (16.0%–17.9%) (). As shown in , demographic differences were noted across the cohorts, including a higher proportion of males among those with HIVP (79.6%) and SCI (69.9%) relative to the other conditions (42.5%–47.3%); an older demographic for SFN (63.5 years) and pDPN (61.1 years) relative to the other conditions (48.7–54.9 years); and relatively high proportions of Black/African Americans for HIVP (35.0%) and SCI (34.0%). Subjects with CLBP had the longest duration since NeP diagnosis (115.0 months) and the highest number of comorbid conditions (3.5), followed by PTPS, with 107.8 months since diagnosis and 3.3 comorbidities. Among the 614 subjects with pain-severity data, the response rate for the painDETECT questionnaire was 96.9% and 98.7% for the nine- and seven-item versions, respectively; there were no differences between the group that completed painDETECT measures and the group that did not.
Table 1 Demographic and clinical characteristics
Average pain severity was in the moderate range across all conditions (), and the highest average pain severity was reported in CLBP (6.0). Some differences were noted in the distribution of pain severity categories among the six conditions (), with CLBP having the highest proportion of subjects with severe pain (40.6%) and SCI the lowest (26.2%). Similarly, differences were noted in the distribution of painDETECT categories (nociceptive, unclear, neuropathic) across the conditions (), with SCI having the highest proportion of patients with nine-item painDETECT scores in the range indicating that the source of the pain (ie, nociceptive or NeP) was “unclear” (34.0%).
For screening purposes, cut-off points on the nine-item painDETECT measure that have been previously found to be the most appropriate are a score ≤12 indicating a neuropathic component is unlikely and a score ≥19 indicating a neuropathic component is likely.Citation7 Between these scores, the result is uncertain, yet a NeP component can be present. In this context, the ambiguous “unclear” group was removed from consideration in defining the true positive rate as the proportion of actual cases of NeP correctly classified by the nine-item painDETECT measure with a score ≥19. The true positive rates were 0.85 (or 85%) for pDPN (ie, 73/[73+13] from ), 0.83 for CLBP, 0.76 for SCI, 0.88 for HIVP, 0.79 for PTPS, and 0.84 for SFN. Because all patients had a confirmed neuropathic diagnosis, the true negative rate cannot be calculated.
Despite the differences across conditions in average pain severity and painDETECT scores, there was at least moderate correlation across conditions between these two outcomes, with all correlations showing statistical significance ().
Table 2 Correlation between average pain severity score and painDETECT score
Scores for painDETECT were available for 606 subjects for the nine-item version and 615 subjects for the seven-item version, and as shown for these subjects in , the adjusted mean scores were ≥19 for all NeP conditions. On both the nine- and seven-item versions, the highest adjusted mean score was for SFN, while PTPS and SCI had the lowest adjusted mean scores. Pairwise comparisons (data not shown) resulted in significant differences only for SFN versus both SCI (P=0.023) and PTPS (P=0.023) on the nine-item version; and on the seven-item version for the comparisons of PTPS versus SFN (P=0.011) and pDPN (P=0.032), and for SCI versus HIVP (P=0.035), pDPN (P=0.046), and SFN (P=0.020).
Figure 1 Adjusted mean scores on painDETECT among the evaluated NeP conditions.
Abbreviations: CLBP, chronic low back pain-associated NeP; HIVP, human immunodeficiency virus-related peripheral NeP; NeP, neuropathic pain; pDPN, painful diabetic peripheral neuropathy; PTPS, posttrauma/postsurgical NeP; SCI, spinal cord injury-related NeP; SFN, small fiber neuropathy.
None of the standardized effect sizes for any of the pairwise comparisons between NeP conditions was “large” on either the seven-item version or the nine-item version of painDETECT (). Furthermore, all comparisons resulted in values that were less than the 0.5 threshold for a medium effect size. The largest effect sizes were observed for the comparison of SFN with SCI, 0.48 for both the nine- and seven-item versions, and the comparison between SFN and PTPS, 0.44 and 0.48 for the nine- and seven-item versions, respectively; the positive range of these values is consistent with the observation that adjusted mean scores were highest in subjects with SFN and lowest in those with PTPS or SCI.
Table 3 Standardized effect size for pairwise comparison of adjusted mean painDETECT
As previously shown,Citation18 corrected item-to-total correlations showed adequate item discrimination (≥0.4) for pain symptom items on the nine- and seven-item painDETECT versions, but the correlations were low (<0.3) for the two non-sensory items on the nine-item version. Similar to what was observed for the combined conditions, each of the NeP conditions showed adequate discrimination (≥0.4) for all pain symptom items on both versions of painDETECT, and most of the pain sensory items had slightly higher item-to-total correlations on the seven-item version relative to the nine-item version (). There was generally low discrimination for the two non-sensory items across all the conditions, although relative to the other conditions, SCI, HIVP, and CLBP were characterized by higher item-to-total correlations for pain radiation ().
Table 4 Item-level discrimination by neuropathic pain condition
For all combined conditions, Cronbach’s alpha coefficients were 0.76 and 0.80 on the nine- and seven-item versions, respectively (). On individual conditions, values of Cronbach’s alpha were generally similar among the conditions and ≥0.70 except for SCI, which was slightly lower with 0.63 and 0.68 for the nine- and seven-item versions, respectively (). For the nine-item painDETECT, statistical significance in the differences between pairs of Cronbach’s alpha coefficients was found for SCI compared with pDPN (P=0.021), CLBP (P=0.046), HIVP (P=0.0017), and PTPS (P=0.021); all other pairs of alpha coefficients, including between SCI and SFN (P=0.110), were not statistically significant. For the seven-item painDETECT, corresponding statistical significance was found for SCI compared with pDPN (P=0.014), HIVP (P=0.0016), PTPS (P=0.009), and SFN (P=0.036); all other pairwise comparisons, including between SCI and CLBP (P=0.100), showed no significant differences. The higher values of Cronbach’s alpha on the seven-item painDETECT were consistent, as expected, with the greater item-to-total correlations on this version relative to the nine-item version.
Table 5 Cronbach’s alpha coefficients by neuropathic pain condition
Discussion
The ability to screen for and characterize NeP using a single measure across a variety of conditions is an important first step in NeP management. A previous analysis demonstrated the ability of painDETECT to discriminate among average pain severity levels, enhancing its ability to characterize NeP.Citation18 The results of the current analysis expand upon the measurement properties of painDETECT, and confirm that this instrument shows further evidence of validity and reliability useful for screening of NeP across a range of NeP conditions. Adjusted mean scores on painDETECT were of similar magnitude for each NeP condition and were within the range (≥19) considered indicative of a high probability of NeP, which would be expected in this population of patients with confirmed NeP diagnoses. Furthermore, across the conditions, the distribution of painDETECT score categories in these subjects with confirmed NeP diagnoses was similar to that observed in the original validation study.Citation7
These six conditions not only represent diverse etiologies, but also reflect heterogeneity across their patient populations, since the demographic and clinical characteristics vary among the conditions. Such heterogeneity was acknowledged and controlled with the demographic and clinical covariates in the analysis of covariance model. Even after controlling for these covariates, the difference in mean painDETECT scores between any pair of the six conditions was not large. In particular, standardized effect sizes were either trivial (<0.2) or small-to-medium (0.2–0.5) for all pairwise comparisons (). The magnitude of these effect sizes suggests that there may be some differences in pain characteristics among the conditions and that some conditions may be more noticeable than others with respect to NeP.
Similar observations were made in the original pain-DETECT validation study, which showed a pattern of distribution of painDETECT scores among patients with CLBP-related NeP that was different relative to other NeP conditions that included postherpetic neuralgia, painful polyneuropathy, and nerve trauma.Citation7 While the results in the current study are also aligned with clinical expectations of painDETECT for identifying and discerning NeP across conditions, they nevertheless suggest an ability to screen for NeP components regardless of condition.
While there appeared to be at least moderate correlations between average pain severity and painDETECT scores, potential differences in pain characteristics were indicated by some differences in item-to-total correlations among the conditions, and may reflect specific characteristics manifested in the various conditions based on pain descriptors. These results are consistent with previous studies that have suggested that, although there may be greater similarities than differences among various NeP conditions, sensory symptom profiles may not only vary by condition, but these profiles may also be used to characterize pain descriptor subtypes within a condition.Citation12–Citation14 Nevertheless, both nine- and seven-item versions of painDETECT showed evidence of internal consistency reliability and item-level discrimination regardless of NeP condition.
For most of the pain sensory items, correlations were slightly higher on the seven-item version relative to the nine-item version, reflecting the more consistent item-level discrimination in the absence of the nonsensory items. It is also interesting to note that correlation on the nonsensory item of pain radiation was highest and approached 0.4, a value indicative of adequate correlation,Citation26 in SCI, CLBP, and HIVP – NeP conditions that may be associated with greater pain radiation relative to the other conditions.
Cronbach’s alpha provided evidence of internal consistency reliability overall and on individual conditions. All conditions had estimated values of >0.70 except for SCI, which had values of 0.63 and 0.68 for the nine-item and seven-item painDETECT, respectively. It should be noted, however, that these estimates were not statistically different from a population value of 0.70 (P-values of 0.200 and 0.690, respectively). The higher values of Cronbach’s alpha on the seven-item version are consistent with the higher item-to-total correlations on this version relative to the nine-item version. As such, the seven-item version has a slightly greater reliability and a more consistent set of item-level discriminations. These higher values on the seven-item version relative to the nine-item version were also observed when painDETECT was evaluated for its ability to distinguish between pain severity levels.Citation18 Although both versions showed good psychometric properties, the consistently higher values on the seven-item version suggest that the nonsensory items may be more useful for characterizing NeP than screening for it.
Limitations of this study include selection bias with regard to both physicians and subjects who agreed to participate. Additionally, it should be noted that, because other pain measures were not part of the study, no comparisons can be made between painDETECT and other NeP screening scales with regard to: 1) the evaluated psychometric characteristics; and 2) the ability of painDETECT to distinguish NeP across a variety of conditions. Another limitation is that this analysis does not explicitly consider other variables that can condition pain perception. It should be noted, however, that relationships between average pain severity and comorbidity variables such as symptoms of anxiety and depression, which were previously reported to be present in 61.9% and 54.4% of these subjects, respectively, have been documented using the same study population;Citation16,Citation19 future research is encouraged to further evaluate the relationship between comorbidity variables and painDETECT scores.
In summary, both the nine- and seven-item versions of painDETECT showed evidence of internal consistency reliability and item-level discrimination across six NeP conditions, indicating that painDETECT is a clinically relevant measure for discerning and characterizing NeP regardless of NeP etiology. However, the slightly greater reliability and more consistent item-level discrimination observed on the seven-item version suggest that the nonsensory items may be more useful for characterizing NeP than for screening. The observed differences among the NeP conditions characterized by the measurement properties of painDETECT also suggests that further evaluation of NeP subtypes, both across and within conditions, is warranted.
Disclosure
This study was funded by Pfizer Inc. Joseph C Cappelleri and Alesia Sadosky are employees and shareholders of Pfizer, the sponsor of this study; Vijaya Koduru is an employee of the Eliassen Group, who were paid consultants to Pfizer in connection with the analysis described in this study; E Jay Bienen is an independent scientific consultant who was funded by Pfizer in connection with manuscript development. The authors report no other conflicts of interest in this work.
References
- Institute of MedicineRelieving pain in America: a blueprint for transforming prevention, care, education, and research (2001)[webpage on the Internet]Washington (DC) National Academy of Sciences Available from: http://www.nap.edu/catalog.php?record_id=13172#toc Accessed February 13, 2013
- LeadleyRMArmstrongNLeeYCAllenAKleijnenJChronic diseases in the European Union: the prevalence and health cost implications of chronic painJ Pain Palliat Care Pharmacother201226431032523216170
- AttalNCruccuGBaronREFNS guidelines on the pharmacological treatment of neuropathic pain: 2010 revisionEur J Neurol20101791113e8820402746
- DworkinRHO’ConnorABAudetteJRecommendations for the pharmacological management of neuropathic pain: an overview and literature updateMayo Clin Proc2010853 SupplS3S1420194146
- van HeckeOAustinSKKhanRASmithBHTorranceNNeuropathic pain in the general population: a systematic review of epidemiological studiesPain2014155465466224291734
- IASP Taxonomy [webpage on the Internet]Washington(DC)International Association for the Study of Pain [updated October 6, 2012]. Available from: https://www.iasp-pain.org/Education/Content.aspx?ItemNumber=1698Accessed August 15, 2014
- FreynhagenRBaronRGockelUTölleTRpainDETECT: a new screening questionnaire to identify neuropathic components in patients with back painCurr Med Res Opin200622101911192017022849
- BennettMIAttalNBackonjaMMUsing screening tools to identify neuropathic painPain2007127319920317182186
- HaanpääMAttalNBackonjaMNeuPSIG guidelines on neuropathic pain assessmentPain20111521142720851519
- De AndrésJPérez-CajaravilleJLopez-AlarcónMDCultural adaptation and validation of the painDETECT scale into SpanishClin J Pain201228324325321926908
- MatsubayashiYTakeshitaKSumitaniMValidity and reliability of the Japanese version of the painDETECT questionnaire: a multicenter observational studyPLoS One201389e6801324098629
- BaronRTölleTRGockelUBroszMFreynhagenRA cross-sectional cohort survey in 2100 patients with painful diabetic neuropathy and postherpetic neuralgia: Differences in demographic data and sensory symptomsPain20091461–2344019592166
- FreemanRBaronRBouhassiraDCabreraJEmirBSensory profiles of patients with neuropathic pain based on the neuropathic pain symptoms and signsPain2014155236737624472518
- MahnFHüllemannPGockelUSensory symptom profiles and comorbidities in painful radiculopathyPLoS One201165e1801821573064
- BaronRFörsterMBinderASubgrouping of patients with neuropathic pain according to pain-related sensory abnormalities: a first step to a stratified treatment approachLancet Neurol20121111999100523079556
- SchaeferCMannRSadoskyABurden of illness associated with peripheral and central neuropathic pain among adults seeking treatment in the United States: a patient-centered evaluationPain Med201415122105211925039856
- SchaeferCSadoskyAMannRPain severity and the economic burden of neuropathic pain in the United States: BEAT Neuropathic Pain Observational StudyClinicoecon Outcomes Res2014648349625378940
- CappelleriJCBienenEJKoduruVSadoskyAMeasurement properties of painDETECT by average pain severityClinicoecon Outcomes Res2014649750425395867
- SadoskyASchaeferCMannRBurden of illness associated with painful diabetic peripheral neuropathy among adults seeking treatment in the US: results from a retrospective chart review and cross-sectional surveyDiabetes Metab Syndr Obes20136799223403729
- MannRBergstromFSchaeferCCharacteristics of subjects with human immunodeficiency virus-related neuropathic pain in the United States: BEAT Neuropathic Pain Observational StudyPresented at: American Society of Regional Anesthesia and Pain Medicine 11th Annual Pain Medicine MeetingNovember 15–18 2012Miami FL
- ParsonsBSchaeferCMannREconomic and humanistic burden of post-trauma and post-surgical neuropathic pain among adults in the United StatesJ Pain Res2013645946923825931
- MannRSchaeferCSadoskyABurden of spinal cord injury-related neuropathic pain in the United States: retrospective chart review and cross-sectional surveySpinal Cord201351756457023588572
- SadoskyASchaeferCMannRBurden of chronic low back pain with a neuropathic pain component: retrospective chart review and cross-sectional survey among adults seeking treatment in the United StatesJ Pain Relief20143163
- SchaeferCMannRSadoskyAHealth status, function, productivity, and costs among individuals with idiopathic painful peripheral neuropathy with small fiber involvement in the United States: results from a retrospective chart review and cross-sectional surveyJ Med Econ201417639440724673364
- CohenJStatistical Power Analysis for the Behavioral Sciences2nd edHillsdale, NJLawrence Erlbaum Associates1988
- CappelleriJCZouKHBushmakinAGAlvirJMJAlemayehuDSymondsTPatient-Reported Outcomes: Measurement, Implementation and Interpretation Boca Raton, FloridaChapman & Hall/CRC2013
- IacobucciDDuhachekAAdvancing alpha: Measuring reliability with confidenceJ Consum Psychol2003134478487
- CleelandCSRyanKMPain assessment: global use of the Brief Pain InventoryAnn Acad Med Singapore19942321291388080219
- ZelmanDCDukesEBrandenburgNBostromAGoreMIdentification of cut-points for mild, moderate and severe pain due to diabetic peripheral neuropathyPain20051151–2293615836967