
 ?Mathematical formulae have been encoded as MathML and are displayed in this HTML version using MathJax in order to improve their display. Uncheck the box to turn MathJax off. This feature requires Javascript. Click on a formula to zoom.
Abstract
Background
There is a need to have a model to study methadone’s losses during hemodialysis to provide informed methadone dose recommendations for the practitioner.
Aim
To build a one-dimensional (1-D), hollow-fiber geometry, ordinary differential equation (ODE) and partial differential equation (PDE) countercurrent hemodialyzer model (ODE/PDE model).
Methodology
We conducted a cross-sectional study in silico that evaluated eleven hemodialysis patients. Patients received a ceiling dose of methadone hydrochloride 30 mg/day. Outcome measures included: the total amount of methadone removed during dialysis; methadone’s overall intradialytic mass transfer rate coefficient, km; and, methadone’s removal rate, jME. Each metric was measured at dialysate flow rates of 250 mL/min and 800 mL/min.
Results
The ODE/PDE model revealed a significant increase in the change of methadone’s mass transfer with increased dialysate flow rate, %Δkm=18.56, P=0.02, N=11. The total amount of methadone mass transferred across the dialyzer membrane with high dialysate flow rate significantly increased (0.042±0.016 versus 0.052±0.019 mg/kg, P=0.02, N=11). This was accompanied by a small significant increase in methadone’s mass transfer rate (0.113±0.002 versus 0.014±0.002 mg/kg/h, P=0.02, N=11). The ODE/PDE model accurately predicted methadone’s removal during dialysis. The absolute value of the prediction errors for methadone’s extraction and throughput were less than 2%.
Conclusion
ODE/PDE modeling of methadone’s hemodialysis is a new approach to study methadone’s removal, in particular, and opioid removal, in general, in patients with end-stage renal disease on hemodialysis. ODE/PDE modeling accurately quantified the fundamental phenomena of methadone’s mass transfer during hemodialysis. This methodology may lead to development of optimally designed intradialytic opioid treatment protocols, and allow dynamic monitoring of outflow plasma opioid concentrations for model predictive control during dialysis in humans.
Video abstract
Point your SmartPhone at the code above. If you have a QR code reader the video abstract will appear. Or use:
Introduction
Methadone is a synthetic full opioid receptor mu-1 (OPRM1) agonist for oral dosing with affinity for the NMDA receptor.Citation1 It is a Drug Enforcement Agency Schedule II controlled substance metabolized mostly by the Phase I hepatic CYP 3A4 system, and to a lesser extent, by CYP2D6, CYP2C8, CYP2C19, CYP2B6, and CYP1A2 to seven metabolites including two minor active metabolites: methadol and normethadol.Citation2,Citation3 Methadone consists of two enantiomers, the d- and l-isoforms, the former is responsible for analgesic activity. The l-isoform is dependent on 2B6 metabolism. Foreseeable accumulation of the l-isoform by poor 2B6 metabolizers consequently elevates risk for cardiotoxicty.Citation4,Citation5 Methadone and its metabolites are almost equally excreted in urine and feces.Citation6 Notwithstanding, however, there is a 30-fold variability in the liver CYP3A4 and 11-fold in the intestinal CYP3A4 enzymes.Citation7,Citation8 But, in patients with anuria, methadone is metabolized by the gastrointestinal systemCitation9 and excreted only in the feces.Citation10
Hemodialysis involves passing a patient’s blood through an extracorporeal circuit with a synthetic membrane attached. Plasma water and small molecular weight (MW) <500 Da solutes, including methadone hydrochloride (MW 345.91 Da), are readily removed from the blood by convective and diffusive forces and are lost as ultrafiltrate.Citation11 However, hemodialysis causes little change in pre-dialysis compared with post-dialysis plasma methadone concentrations,Citation12 which means that hemodialysis removes only a small portion of methadone from blood. This intuitively makes methadone an attractive opioid for the management of chronic pain in patients undergoing dialysis.Citation13
Nonetheless, any methadone removed during dialysis may be important and require adjusting or supplementing a patient’s routine dose regimen when dosed three to four times daily for analgesia. Supplementing a patient’s methadone dose regimen would be particularly relevant for a hemodialysis patient undergoing treatment for substance abuse or pain management with methadone. Supplementation may be needed to prevent methadone levels from falling below their minimum effective concentrations,Citation14 which could precipitate acute withdrawal, pain crisis, or both. No recommendations currently exist for methadone’s use in patients undergoing hemodialysis. No information is available to guide dosing. Therefore, there is a need to have a model to study methadone’s losses during hemodialysis to provide informed methadone dose recommendations for the practitioner.
We built a one-dimensional (1-D), hollow-fiber geometry, ordinary differential equation (ODE) and partial differential equation (PDE) countercurrent hemodialyzer model (ODE/PDE model). The ODE/PDE model mimicked methadone’s disposition during hemodialysis. We used this ODE/PDE model to measure methadone’s intradialytic mass transfer and removal rate. To determine whether the model could detect an expected increase in methadone’s removal with increased dialysate flow, we measured methadone’s removal at dialysate flow rates of 250 mL/min and 800 mL/min. The ODE/PDE model allowed us to implement a clinical strategy for estimating a patient’s post-hemodialysis methadone restoration dose.
Methods
Subjects and protocol
To develop the model, we used the data from the published experiments by Perlman et al.Citation12 The data were digitally extracted from their publication using high-resolution image processing with GIMP version 2.8 (http://www.gimp.org/), and measured using UN-SCAN-IT version 6.0 software (Silk Scientific, Orem, UT, USA). A similar approach has been successfully used to study the dynamic relationship between glucose, insulin and non-esterified fatty acids.Citation15,Citation16
We studied eleven patients (see ). Patients received a ceiling dose of methadone hydrochloride (hereafter methadone) in divided doses totaling 30 mg/day for patients receiving other than once daily dosing for analgesic purposes. Specific details including dose escalation of opioid-naïve patients to reach the ceiling dose are provided by Perlman et al.Citation12 This research was conducted according to ethical principles in the World Medical Association Declaration of Helsinki (59th WMA General Assembly, Seoul, October 2008), which includes research on published human data. The study was approved by the Emerio & Lourdes Linares Research and Education Center Institutional Review Board.
Table 1 Patient demographics
Dialyzer model development
Hemodialysis experiments to test the model were performed in silico. On the one hand, we compared methadone’s mass transfer to that of a perfect reference standard. On the other hand, we compared methadone’s mass transfer at dialysate flow rates we defined as low, equal to 250 mL/min, and high, equal to 800 mL/min. For each patient, hemodialysis blood flow rates were held constant at 250 mL/min. We sought to identify a potential dependence of methadone’s removal on dialysate flow rate. If the model could detect such a dependence, it would serve as a test of the model’s sensitivity to detect a mechanism-based change.
We implemented the ODE/PDE model illustrated in . Dialyzer geometry refers to the cross-sectional area in contact with the blood, semipermeable membrane, and dialysate. presents a glossary of symbols and units.
Figure 1 ODE/PDE model of one-dimensional (1-D) counter current hemodialyzer with distance z of the spatial boundary independent variable along the dialyzer.
Abbreviations: ODE, ordinary differential equation; PDE, partial differential equation.
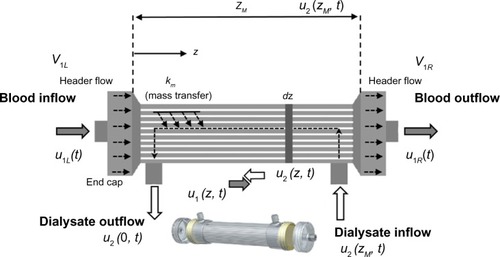
Table 2 Glossary of symbols and units
Closely following Schiesser,Citation17 as shown in , the ODE/PDE model is 1-D with distance z the spatial boundary independent variable along the dialyzer. Time t is the temporal initial value independent variable. The two PDE dependent variables, u1(z, t) and u2(z, t), represent normalized methadone concentrations in the blood and dialysate, respectively, and z stands for the length of the dialyzer excluding the headers. The independent time variable is t in minutes. The derivation of the ODE/PDE model equations are presented in the Supplementary material.
also shows blood enters the left end of the dialyzer at a methadone blood concentration of u1L(t). This boundary condition is not defined as u1(z = 0, t) due to the header flow volume at the left end, VlL. Similarly, the exiting methadone blood concentration at the right end is u1R(t) rather than u1(z = zM, t) because of the header flow volume there also, V1R. ZM stands for the length of the dialyzer membrane excluding the headers. The entering and exiting dialysate concentrations are u2(z = zM, t) and u2(z = 0, t).
The header is the space enclosed by the end cap of the dialyzer and the polyurethane potting material that holds the hollow fibers together (inset ). The header forms a barrier between the blood and dialysate compartments. Headers channel blood from the dialyzer inlet into the membrane fibers, and from the membrane fibers into the dialyzer outlet. The end caps can be removed from some dialyzers (inset ). The headers can be assumed to be well mixed and therefore modeled with ODEs. The dialyzer membrane passage is distributed in space and time so we use PDEs. Thus, ODE/PDE model results which are easily handled with the method of lines (MOL).Citation18 Note, the headers serve as low-pass filters in the sense that they smooth abrupt changes such as step changes at the inlet.
Our objective in formulating our experiments with the model and computing numerical solutions with it was to determine u1(z, t) and u2(z, t), and in particular, how methadone’s mass transfer reduced the outflow methadone concentration, u1R(t), below its inflow value, u1L(t). This approach allowed us to perform a methadone mass balance on the blood and thereby estimate methadone’s mass transfer coefficient, km (see Supplementary material).
Our objective was not to examine the efficiency of a particular commercially available dialyzer to remove methadone from blood. Therefore, we set the ODE/PDE model parameters to arbitrary, though realistic values, comparable to those of commercially available dialyzersCitation19,Citation20 as follows: D: dialyzer diameter 5 cm; A: dialyzer cross-sectional area equal to π×D2cm2 (used in EquationEquations S1(S1) and EquationS2
(S2) [see Supplementary materials]); AM: dialyzer mass transfer area per unit length of dialyzer cm2/cm (used in EquationEquations S2
(S2) and EquationS3
(S3) ). We set AM = A; q1, q2: volumetric flow rate of blood equal to 0.25×10³ and dialysate equal to 0.25×103 cm3/min, respectively; ξ: fraction of A available for blood flow, 0 ≤ ξ ≤ 1, dimensionless. Hence, 1–ξ is the fraction of A available for dialysate flow; v1, v2: linear flow velocities for blood, equal to q1/ξ×A, and dialysate, equal to −q2/([1 – ξ]×A), respectively, cm3/min (used in EquationEquations S2
(S2) and EquationS3
(S3) ). Note, for countercurrent flow, v1>0 and v2<0, which maximizes methadone’s convective and diffusive mass transfer; u1L: normalized inflow blood methadone concentration equals 1, as z=0, dimensionless; V1L, V2R: header volumes for u1 at z=0, zM, are cm3. The length of these header volumes is 1 cm (v1L = 1×A). However, these values cannot be zero because of the division by the volume in the numerical integration of the ODEs in EquationEquations S5
(S5) and EquationS6
(S6) ; u10, u20: initial conditions (ICs) for EquationEquations S2
(S2) and EquationS5
(S5) equal zero, respectively, and dimensionless (in EquationEquation S4
(S4) : u1(z, t = 0) = f1(z) = u10 and u2(z, t = 0) = f2(z) = u20, respectively); ZM: dialyzer length equal to 50 cm; n: number of grid points in z equal to 51.
Methadone’s mass transfer coefficient from blood into dialysate, km, was estimated by solving the coefficients in EquationEquations S1(S1) and EquationS2
(S2) . Detailed MATLAB (matrix laboratory) code for estimating methadone’s km using the MOL to solve the ODE/PDE model is provided in Schiesser’s work.Citation17
Hemodialysis experiments
In brief, Perlman et alCitation12 improved methadone pain control in their patients over a 2-week period. After this 2-week period, blood samples were drawn during the patients’ first scheduled dialysis session. The first sample was drawn immediately before starting dialysis and the last sample was drawn immediately after the 4-hour dialysis session. Patients were instructed to take their last dose of methadone 6 hours before starting dialysis to make sure that plasma methadone concentrations were measured during the elimination phase. This may be a limitation for maintenance therapy patients as they receive their dose early in the day. However, this schedule enables accurate assessment of methadone’s elimination with minimal influence from absorption or redistribution.Citation21 Patients did not receive extra or breakthrough doses of methadone during dialysis. Acetaminophen was used to treat pain during dialysis.
Perlman et alCitation12 measured methadone serum concentrations using liquid chromatography tandem mass spectrometry.Citation22 In non-dialysis patients, plasma methadone levels increased linearly by 260 ng/mL for every 1 mg/kg of methadone ingested.Citation23 The coefficient of variation and accuracy for all standards were within the acceptable range of 20% of the lower limit of detection and 15% of other standards and quality control samples. Linearity was achieved in the analytical ranges of 0.5 to 300 ng/mL. For all calculations and ODE/PDE modeling, the published methadone concentration for an individual time point for the first and second dialysis sessions were combined and averaged. Methadone’s intradialytic extraction ratio was calculated from the simultaneously sampled arterial (inflow) and venous (outflow) plasma methadone concentrations by dividing their difference by the arterial plasma methadone concentration (see results, ). Full details of the experimental protocol and procedures utilized by Perlman et al have been previously described in detail.Citation12
Table 3 Experimentally measured plasma methadone concentrations versus ODE/PDE model predictionsTable Footnotea,Table Footnoteb
Statistics
Statistical analyses were performed using R version 3.1.3 (R Foundation for Statistical Computing, Vienna, Austria). Solution of the ODE/PDE model was performed using MATLAB MOL codesCitation20 translated into R.Citation24,Citation25 A sample size of eleven was calculated to be the smallest n that would achieve a power of 90% to detect a 2% difference with α=5% between the measured and ODE/PDE model predicted values.Citation26 All values are mean ± standard deviation unless otherwise indicated. Values in brackets are 95% confidence intervals (95% CIs). Mathematical computations with error propagation were performed using Mathematica 10.1 (Wolfram Research, Champaign, IL, USA). A significant difference or relationship was established when the probability of rejecting the null hypothesis was ≤0.05.
Results
For each patient, shows the plots for the case where no methadone mass transfer into the dialysate occurred, ie, km=0. This simulation is used for reference. The two solutions, u1R(t) and u2(z = 0, t), are close. Both have the same inflow values: u1L=u2zM=1. However, the solutions are not exactly the same because of the blood flow at the inflow and outflow headers (). As expected, the responses of the normalized plasma methadone concentrations with headers (black curves), u1(z, t), are slightly delayed compared to those for the dialyzer with no headers (gray curves). Both solutions approach 1 with increasing t as expected because when there is no mass transfer (km=0), the entire unit inflow plasma methadone concentrations move through the system and exit.
Figure 2 One-dimensional (1-D) ODE/PDE model’s perfect reference standard response with zero mass transfer of methadone into dialysate.
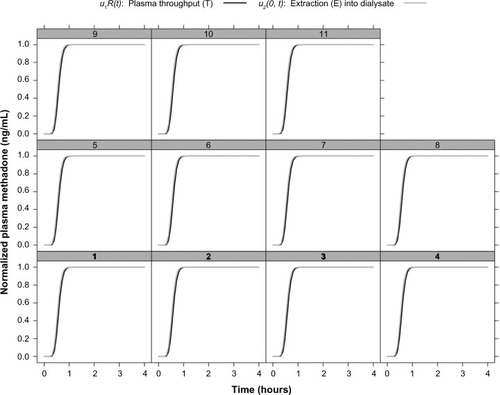
Both solutions in , u1R(t) and u2(z = 0, t), reflect a traveling waveCitation27 that results from the PDE’s ICs u10=u20=0. The inflow unit methadone concentrations travel through the dialyzer and eventually reach the outflow, at which time both solutions move from the zero ICs to the unit boundary conditions. The step is not instantaneous because of the so-called numerical diffusion (which is not physically realistic) from the two point upwinding of the derivatives in z of EquationEquations S2(S2) and EquationS3
(S3) . However, we largely eliminated numerical diffusion by using flux limiters.
The arrival time of methadone molecules at the outflow (right end, z = zM) for u1 can be estimated as zM/v1 = 50 cm ÷ 0.025 cm/s = 2,000 s = 0.56 hour. Similarly, for u2, since v2 = −v1 the arrival time at the left end (z=0) is also approximately 0.56 h. These arrival times may not be exact due to some numerical diffusion and the delay in methadone’s u1 response due to the two headers. Notice, while the time for convection through the dialyzer may be of the order of minutes, the time to reach equilibrium or steady state can be considerably longer because of the interaction of the blood and dialysate streams through the membrane mass transport.
presents results of the experimentally measured versus the ODE/PDE model predicted plasma methadone inflow and outflow concentrations, and their extraction (E) and throughput (T), by and through the dialyzer, respectively. shows that the ODE/PDE model accurately predicted methadone’s experimentally measured values. There were no significant differences between methadone’s experimentally measured values and the ODE/PDE model predictions (all P>0.05). In addition, the absolute value of the prediction errors for methadone’s intradialytic E and T were less than 2%.
shows the case where each patient’s methadone km was estimated with the ODE/PDE model using the measured experimental data presented in . Blood and dialysate flow rates were set equal to 250 mL/min. Methadone’s km was equal to 3.64×10⁻³±2.16×10⁻⁵ cm/min. Compared to the solutions in , the two solutions in , u1R(t) and u2(z = 0, t), are not so close. Although both solutions have the same normalized inflow values:
, their normalized outflow values were significantly different. At t = 4 h, u1R(t) = 0.824±0.013 with a 95% CI (0.723, 0.922), and u2(z = 0, t) = 0.175±0.013 with a 95% CI (0.076, 0.274), P < 0.05. Methadone’s maximum extraction during dialysis occurred at 1.82±0.30 h with a 95% CI (1.56, 2.08). Thereafter, its extraction did not significantly increase.
Figure 3 One-dimensional (1-D) ODE/PDE model’s response with estimated mass transfers of methadone into dialysate.
Abbreviations: ODE, ordinary differential equation; PDE, partial differential equation.
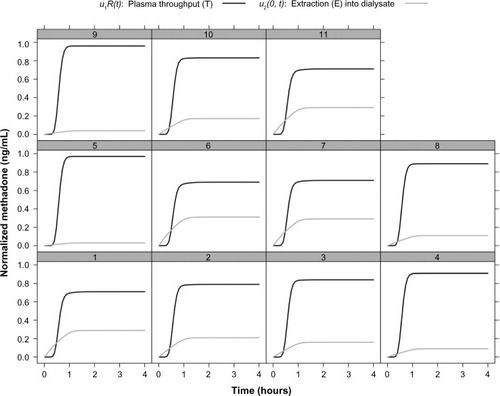
For each patient in , methadone’s u1 response to u1L arrives at the right end (z = zM) at approximately 0.56 h, as in . But due to methadone’s mass transfer into the dialysate, the response is reduced so that the exiting u1 concentration, u1R(t), reaches 0.824±0.013 at t = 4 h. As shown in , just after t=0, methadone’s u2 responses (gray curves) were immediate because the outflowing dialysate “sees” the unit inflowing plasma methadone concentration at z=0. Notice also that the inflow methadone concentration into the dialysate, u2(z = zM, t), is
; so the outflow u2 at z=0 is determined entirely by the plasma methadone concentration on the blood side of the membrane. At t = 4 h, this outflowing normalized plasma methadone concentration, u2(z = zM, t), reaches 0.175±0.013.
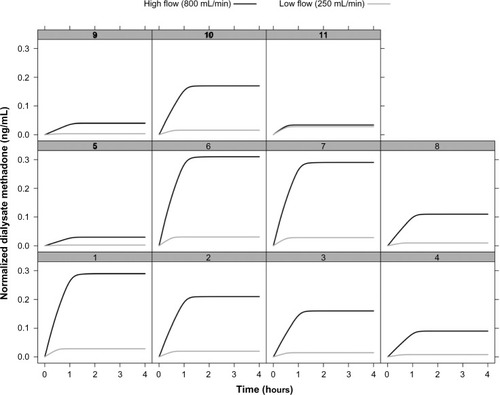
For each patient, shows the plot of normalized methadone’s removal via dialysate at low dialysate flow rates of 250 mL/min and high dialysate flow rates of 800 mL/min. The model revealed a significant increase in the change of methadone’s mass transfer associated with the increase in dialysate flow rate, %Δ km=18.56, P=0.02, N=11. The total amount of methadone mass transferred across the dialyzer membrane with high dialysate flow rate significantly increased (0.042±0.016 versus 0.052±0.019 mg/kg, P=0.02, N=11). This was accompanied by a significant but small increase in methadone’s mass transfer rate (0.113±0.002 versus 0.014±0.002 mg/kg/h, P=0.02, N=11).
Figure 4 One-dimensional (1-D) ODE/PDE model’s normalized methadone’s response to its removal via the dialysate at low dialysate flow rates of 250 mL/min and high dialysate flow rates of 800 mL/min.
Abbreviations: ODE, ordinary differential equation; PDE, partial differential equation.
Discussion
Our results show the ODE/PDE model () accurately predicted methadone’s inflow and outflow plasma concentrations as well as its E and T during dialysis. Results using the ODE/PDE model also showed methadone’s removal was decreased at low dialysate flow rates compared to its removal at high dialysate flow rates. The ODE/PDE model suggested that methadone’s reduced intradialytic removal was caused by a reduction in its mass transfer across the hemodialyzer membrane in a dialysate flow rate-dependent manner. This result was consistent with previous results that show increasing dialysate flow rate can give rise to an increase in mass transfer of low MW substances across dialyzer membranes,Citation28,Citation29 and that increasing dialysate flow rate may increase the mass transfer of a highly protein-bound substance.Citation30,Citation31
While it is possible to qualitatively predict methadone’s extent of removal during dialysis, our study aimed to advance a quantitative measure of methadone’s removal. It is known that a few basic physicochemical properties of a drug govern the extent to which it is dialyzed: 1) MW, 2) apparent volume of distribution, 3) protein binding, 4) hydrophilicity, and 5) lipophilicity.Citation32 Molecules with low MW (<500 Da) are easily dialyzed, while higher MW compounds (>1,000–2,000 Da) are not. In general, drugs with an apparent volume of distribution greater than 1 L/kg are poorly dialyzed. Drugs with high protein binding, low water solubility, or that have high lipophilicity are also poorly dialyzed.Citation32
Methadone has a low MW equal to 345.91 Da. It also has a high apparent volume of distribution with reported values in opioid addicts estimated as 4.1±0.65 L/kg in one studyCitation33 and 2.1–5.61 L/kg in another.Citation34 Bootstrap population statistics give an apparent volume of distribution for methadone of 5.5±0.89 L/kg.Citation35 Methadone is highly bound to plasma proteins, particularly AAG.Citation36 Its plasma protein binding has been reported to be 60%–90%.Citation37 It is highly hydrophobic with a log 1-octanol:water partition coefficient (log Po/w) of 4.762 at pH=7.4;Citation38 morphine’s log Po/w =−0.10, oxycodone’s log Po/w =0.70, and codeine’s log Po/w =0.60.Citation39 Log Po/w >0 characterizes hydrophobic substances soluble in the lipid phase, while log Po/w <0 typifies polar compounds soluble in the water phase.Citation40 Methadone is highly lipophilic as explained by its high log Po/w. Only the first property (small MW) supports that methadone is easily dialyzable. The other four properties indicate its removal by hemodialysis is reduced.
Our results showed that during low dialysate flow rates equal to the hemodialyzer’s blood flow rates, low concentrations of methadone appeared in each patient’s dialysate, compared to those during high dialysate flow rates. This finding objectively indicates methadone’s dialyzability is low. Methadone clearance and extraction ratios have also been previously observed to be low in other studies.Citation12,Citation41 But, the ODE/PDE model extends the concepts by providing quantitative measures of methadone’s extent of dialyzability, including its mass transfer coefficient, km. Methadone’s km allows quantitative estimation of the amount of methadone removed during hemodialysis.
If the objective is to determine the amount of methadone removed by dialysis, eg, to control dose replacement, estimation of km and the amount of methadone removed by dialysis may provide a better index for methadone dose replacement than dialysis clearance. Dialysis clearance has been found to correlate poorly with the fraction of drug in the body removed by hemodialysis.Citation42 Moreover, a drug’s dialyzability cannot be predicted reliably from its MW, volume of distribution, or plasma protein binding.Citation43
Clinical application
The ODE/PDE model results can be applied as follows. Using a low dialysate flow rate of 250 mL/min, methadone’s estimated removal during dialysis is jME = 0.013±0.002 mg/kg/h, for a 70±0.001 kg patient. Then, methadone’s removal rate with error during dialysis can be estimated as jME×70±0.001 kg = 0.90±0.14 mg/h (95% CI: 0.67, 1.18). Thus, over the 4 h period of a dialysis session it is estimated that about 3.6±0.56 mg (95% CI: 2.5, 4.7) of methadone will be removed by hemodialysis in a 70 kg patient. The value of 3.01 mg calculated from the mass balance of measured values from Perlman et alCitation12 falls within that 95% CI.
The range of methadone concentrations from 100 ng/mLCitation44 to 400 ng/mLCitation45 are presumed to provide effective methadone maintenance. Yet other studies consider that effective maintenance depends on keeping serum methadone levels above 150–200 ng/mL during the 24 h interval between methadone doses.Citation46–Citation48 In contrast, for pain treatment, methadone serum concentrations in opioid naïve patients range from 10 ng/mL to 80 ng/mL with a minimum lethal level of 670 ng/mL.Citation49,Citation50 Notice that the ODE/PDE model’s estimate of amount of methadone removed by dialysis translates into a plasma methadone concentration of about 11.96 ng/mL; since, concentration = amount/volume of distribution (Vd = 4.3 L/kg×70 kg = 301 L). Hence, while a plasma methadone concentration change of about 11.96 ng/mL seems modest, it may be sufficient to cause a lack of a sense of well-being in maintenance and chronic pain patients undergoing dialysis.Citation51 Especially, if levels fall 11.96 ng/mL below their minimum effective concentrations.
The aim of our study was not to examine the performance of a particular commercially available hemodialyzer or dialyzer membrane to remove methadone from blood. Therefore, we set the ODE/PDE model parameters to arbitrary, though realistic, values comparable to those of commercially available dialyzers.Citation19,Citation20 Accordingly, interpretation of our results should be tempered with the understanding that they do not generalize to membranes with different characteristics, and hemodialysis prescriptions with different blood and dialysate flow rates. Nevertheless, given a specific membrane’s characteristics, and a particular patient’s hemodialysis prescription, initializing the ODE/PDE model with those parameter values is straightforward and will provide accurate results with little error comparable to those obtained in our study.
Drug to dialyzer–membrane binding has been demonstrated during continuous hemofiltration in the absence of protein.Citation52 The ODE/PDE model does not account for the possibility that methadone might bind to a dialyzer’s membrane. Still, there is currently no factual evidence or anticipation that methadone does or should bind to dialyzer membranes. In addition, methadone is a neutral molecule with a formal charge of zero,Citation53 and thus is not expected to undergo cation exchange reactions with the dialyzer membrane.
Dialyzer reuse may cause a decrease in methadone’s mass transfer due to a reduced number of dialyzer fiber bundles with associated loss of surface area. A reduction in the number of fiber bundles can either alter the membrane’s diffusive properties or lead to a loss of hydraulic permeabilityCitation32 both of which could lead to a decline in methadone’s mass transfer across the membrane. Although observations recorded during continuous hemodialysis indicate this decline is predictable, the role of membrane deposition of protein with reuse on the mass transfer across dialyzer membranes of low MW drugs, including methadone, is presently unknown.
It is known that some highly bound protein substances may be dialyzable when subjected to high dialysate flow rates.Citation28 We used this fact to test the model’s ability to possibly detect an increase in methadone’s dialyzability with increased dialysate flow. The ODE/PDE model predicted that methadone’s dialyzability increases with high dialysate flow rates. Moreover, the model provided a quantitative estimate of methadone’s removal during high dialysate flow.
We assumed methadone distributes in the whole blood compartment, while in reality the hematocrit fraction of dialyzer blood flow is not accessible to protein bound solutes like methadone. This means that to completely account for the hematocrit effect, the fraction of red cell volume available for dialysis (γ) must be taken into account. This value is not known for methadone. For urea, it is 1.11. It is not 1 due to a reversibly bound pool of urea within red blood cells.Citation54 For creatinine γ is 0.50 and for phosphorus it is 0. Nevertheless, although γ is not known for methadone, it can be estimated as follows. The equation relating hematocrit to dialyzer blood flow is given by Sargent and Gotch:Citation55
(1) where QB is whole blood flow into the dialyzer, QBw is blood water flow, HCT is the fractional red cell volume of whole blood (hematocrit: 45% men, 40% women), 0.93 is the water fraction of plasma, and 0.72 is the effective water fraction of the red cell. γ accounts for the hematocrit effect. Solving EquationEquation 1
(1) for γ gives:
(2) for both men and women. Hence, methadone’s hematocrit fraction of dialyzer blood flow is about 29%. In this sense, our results may represent predictable underestimates.
The Peclet number, Pe = (v1×ZM)/D = 347046.2 for our model. Thus Pe >>100, which indicates we can neglect diffusion relative to convection because the system is strongly hyperbolic (convective). D denotes methadone’s diffusivity equal to 3.67×10⁻⁶ cm2/s using the Stokes–Einstein equation with a plasma viscosity of 1.2 centipoise, where 1 centipoise = 0.01 g/cm/s.Citation56
Finally, our experiments were not designed to detect the possibility that methadone could exhibit post-hemodialysis rebound resulting from equilibration between blood plasma and its tissue reservoir.Citation57 This could lead to a 10%–25% post-hemodialysis rebound of drug due to equilibration.Citation32 Therefore, sustained spillover of methadone into plasma from its tissue reservoir could (at least theoretically) cause a delayed toxic methadone concentration, particularly in acute poisoning. However, further studies are needed to determine the potential impact the interaction between inter-compartmental methadone equilibration and methadone spillover into plasma from tissue reservoirs could have on post- hemodialysis methadone concentrations. One approach would be to investigate inclusion of ODEs to model the delayed release and spillover.
Acknowledgments
This research received no specific grant from any funding agency in the public, commercial, or not-for-profit sectors.
Supplementary materials
Closely following Schiesser,Citation1 the blood methadone mass conservation balance gives:
(S1)
In EquationEquation S1(S1) , ξ AΔz (∂u1/∂t) represents accumulation of methadone in an incremental volume of blood ξ AΔz (or depletion if the derivative in t is negative). The units of this term are (cm2)(cm)(ng/cm3)(1/min) = ng/min. ξ Av1u1|z represents methadone’s flow by convection into the incremental volume at z. The units of this term are (cm2) (cm/s)(ng/cm3) = ng/min –ξ Av1u1|z+Δz represents methadone’s flow by convection into the incremental volume at z + Δz. + AM ΔzkM1 (u2 – u1) represents methadone’s mass balance between blood and dialysate into or out of the incremental volume at z. The units of this term are (cm2/cm)(cm)(cm/s)(gmol/cm3) = ng/min. Note that methadone’s mass transfer will be from blood to dialysate if u1 > u2 as u1 decreases with t. Methadone’s mass transfer coefficient km has units of cm/min. This coefficient presumes that only free methadone molecules pass through the dialyzer membrane and that bound methadone remains in the blood stream.
Dividing EquationEquation S1(S1) by ξ AΔz gives,
Taking the limit as Δz → 0,
(S2)
EquationEquation S2(S2) is the partial differential equation (PDE) for computing u1(z, t). We assume v1 is independent of z so that it can be taken outside the derivative in z.
The PDE for u2 follows from an analogous blood methadone mass conservation balance for the dialysate:
Dividing by (1 – ξ) AΔz and taking the limit as Δz → 0 gives
(S3)
Notice that the mass transfer terms in EquationEquations S2(S2) and EquationS3
(S3) are opposite in sign indicating that the methadone that leaves the blood equals the methadone that enters the dialysate.
EquationEquations S2(S2) and EquationS3
(S3) are first order in t and z (they are first order hyperbolic PDEs). Therefore, each requires an initial condition (IC) and a boundary condition (BC). The ICs are
(S4)
The BCs are somewhat more complicated because of the entering and exiting blood volumes (these header volumes result from the dialyzer design). In each of these volumes, we assume perfect or complete mixing. Therefore, the blood methadone concentration in each volume is described by an ordinary differential equation (ODE) in t (variations in z do not occur through the perfect mixing assumption). The ODE for the left volume header is
(S5) where V1L represents the left volume, q1 the blood volumetric flow rate, u1L the inlet methadone blood concentration, and u10 the initial condition for u1(z = 0, t) at t=0.
Also, the right header volume is described by the following ODE:
(S6) which gives the outflow blood methadone concentration u1R(t). Note that the input into S6 is the outflow blood methadone concentration u1(z = zM, t) from EquationEquation S2
(S2) ; zM is the length of the dialyzer membrane. EquationEquation S6
(S6) is an ODE in addition to the PDEs of EquationEquations S2
(S2) and EquationS3
(S3) . In addition, q1 = v1ξΑ relates the blood volumetric and linear flow rates.
The BC for EquationEquation S3(S3) is
(S7) where g2(t) is a prescribed function. EquationEquations S2
(S2) to EquationS7
(S7) constitute the ODE/PDE equations of the model for our in silico experiments using the model.
The ODE/PDE model for the dialyzer is first order in t (convective, hyperbolic), and since it models convection, it naturally propagates steep fronts (even discontinuities) which makes its numerical solution relatively difficult. However, we designed methadone mass flux limiters for this situation to eliminate numerical distortions such as oscillations.Citation2
References
- SchiesserWEHemodialyzer DynamicsSchiesserWEPartial Differential Equation Analysis in Biomedical EngineeringNew YorkCambridge University Press2013284299
- SchiesserWEPartial Differential Equation Analysis in Biomedical EngineeringCambridge, UKCambridge University Press2013
Disclosure
J Fudin is an expert legal advisor and on the speakers’ bureau for Millennium Laboratories, Inc. He is on speakers’ bureaus for Kaléo Pharma and Astra Zeneca. He is a consultant to Zogenix, Astra Zeneca, Millennium Health LLC, and to Practical Pain Management in the development of the online Opioid Calculator. He is founder and owner of Remitigate LLC. J Fudin’s participation does not reflect the opinion of employers, employee affiliates, and/or pharmaceutical companies listed. This article is the sole work of the authors and stated opinions/assertions do not reflect the opinion of employers, employee affiliates, and/or pharmaceutical companies listed. It was not prepared as part of J Fudin, TC Pham, RO Mathew, or JJ Bettinger’s official government duties in their various roles as government employees/affiliates. All other authors have no conflicts of interest to disclose in this work.
References
- BorgLKravetsIKreekMJThe pharmacology of long-acting as contrasted with short-acting opioidsRiesRKMillerSCFielinDAPrinciples of Addiction MedicineFourth edPhiladelphia, PALippincott Wiliamms and Wilkins2009117132
- FerrariAPio Rosario CocciaCBertoliniASternieriEMethadone-metabolism, pharmacokinetics, and interactionsPharmacol Res200450655155915501692
- FosterDJSomogyiAABochnerFMethadone N-demethylation in human liver microsomes: lack of stereoselectivity and involvement of CYP3A4Br J Clin Pharmacol199947440341210233205
- GadelSCraffordAReginaKKharaschEDMethadone N-demethylation by the common CYP2B6 allelic variant CYP2B6.6Drug Metab Dispos201341470971323298862
- GerberJGRhodesRJGalJStereoselective metabolism of methadone N-demethylation by cytochrome P4502B6 and 2C19Chirality2004161364414628297
- KreekMJKalismanMIrwinMJafferyNFBiliary secretion of methadone and methadone metabolism in manRes Commun Chem Pathol Pharmacol198029167787403680
- ShaiovaLDemystifying opioid conversion calculations, a guide for effective dosing by Mary Lynn McPhersonJ Palliat Med2011145668
- EapCBBuclinTBaumannPInterindividual variability of the clinical pharmacokinetics of methadone: implications for the treatment of opioid dependenceClin Pharmacokinet200241141153119312405865
- SterniniCPatiernoSSelmerISKirchgessnerAThe opioid system in the gastrointestinal tractNeurogastroenterol Motil200416Suppl 231615357847
- KreekMJSchecterAJGutjahrCLHechtMMethadone use in patients with chronic renal diseaseDrug Alcohol Depend1980531972056986247
- SternbyJPNilssonAGaredLJDiffusive-convective mass transfer rates for solutes present on both sides of a dialyzer membraneASAIO J200551324625115968955
- PerlmanRGiladiHBrechtKIntradialytic clearance of opioids: Methadone versus hydromorphonePain2013154122794280023973378
- AtkinsonTJFudinJWegrzynELBettingerJJDialysis, opioids, and pain management: Where’s the evidence?Practical Pain Management20141484957
- KreekMJBorgLDucatERayBPharmacotherapy in the treatment of addiction: methadoneJ Addict Dis201029220021620407977
- BostonRCMoatePJA novel minimal model to describe NEFA kinetics following an intravenous glucose challengeAm J Physiol Regul Integr Comp Physiol20082944R1140R114718234748
- BostonRCMoatePJNEFA minimal model parameters estimated from the oral glucose tolerance test and the meal tolerance testAm J Physiol Regul Integr Comp Physiol20082952R395R40318565832
- SchiesserWEHemodialyzer dynamicsSchiesserWEPartial Differential Equation Analysis in Biomedical EngineeringNew YorkCambridge University Press2013284299
- SchiesserWEThe Numerical Method of Lines Integration of Partial Differential EquationsSan DiegoAcademic Press1991
- ClarkWRGaoDProperties of membranes used for hemodialysisSemin Dial200215319119512100457
- SakaiKDialysis membranes for blood purificationFront Med Biol Eng200010211712910898241
- TortoriciMACutlerDZhangLPfisterMDesign, conduct, analysis, and interpretation of clinical studies in patients with impaired kidney functionJ Clin Pharmacol2012521 Suppl109S118S22232746
- LiangHRFoltzRLMengMBennettPMethod development and validation for quantitative determination of methadone enantiomers in human plasma by liquid chromatography/tandem mass spectrometryJ Chromatogr B Analyt Technol Biomed Life Sci20048062191198
- FudinJPerkinsROpioid pharmacokinetics and expected metabolites Available from: http://paindrcom/wp-content/uploads/2012/05/Opioid-Serum-Predictability-and-Metabolitespdf2011Accessed February 4, 2015
- SchiesserWEDifferential Equation Analysis in Biomedical Science and Engineering: Ordinary Differential Equation Applications with RHoboken, New JerseyJohn Wiley and Sons, Inc2014
- SchiesserWEDifferential Equation Analysis in Biomedical Science and Engineering: Partial Differential Equation Applications with RHoboken, New JerseyJohn Wiley and Sons, Inc2014
- ChowSCShaoJWangHA note on sample size calculation for mean comparisons based on noncentral t-statisticsJ Biopharm Stat200212444145612477068
- GriffithsGWSchiesserWETraveling Wave Analysis of Partial Differential EquationsBoston, MAAcademic Press2012
- BhimaniJPOusephRWardRAEffect of increasing dialysate flow rate on diffusive mass transfer of urea, phosphate, and β2-microglobulin during clinical haemodialysisNephrol Dial Transplant201025123990399520543211
- LeypoldtJKCheungAKEffect of low dialysate flow rate on hemodialyzer mass transfer area coefficients for urea and creatinineHome Hemodial Int199935154
- MeyerTWLeeperECBartlettDWIncreasing dialysate flow and dialyzer mass transfer area coefficient to increase the clearance of protein-bound solutesJ Am Soc Nephrol20041571927193515213283
- LuoFJPatelKPMarquezIOPlummerNSHosttetterTHMeyerTWEffect of increasing dialyzer mass transfer area coefficient and dialysate flow on clearance of protein-bound solutes: a pilot crossover trialAm J Kidney Dis20095361042104919394728
- ŠeferSDegoricijaVAbout drug dialyzabilityActa Clin Croat200342257267
- NilssonMIÄnggårdEHolmstrandJGunneLMPharmacokinetics of methadone during maintenance treatment: adaptive changes during the induction phaseEur J Clin Pharmacol19822243433497106170
- MeresaarUNilssonMIHolmstrandJAnggardESingle dose pharmacokinetics and bioavailability of methadone in man studied with a stable isotope methodEur J Clin Pharmacol19812064734787286059
- LinaresOALinaresALComputational opioid prescribing: A novel application of clinical pharmacokineticsJ Pain Palliat Care Pharmacother201125212513521657860
- GarridoMJAguirreCTrocónizIFAlpha 1-acid glycoprotein (AAG) and serum protein binding of methadone in heroin addicts with abstinence syndromeInt J Clin Pharmacol Ther2000381354010667835
- FainsingerRSchoellerTBrueraEMethadone in the management of cancer pain: a reviewPain19935221371478455961
- United States PharmacopeiaMethadone HCl Safety Data SheetUSP2014 Available from: http://www.usp.org/pdf/EN/referenceStandards/msds/1398009.pdfAccessed January 28, 2015
- FernerREPost-mortem clinical pharmacologyBr J Clin Pharmacol200866443044318637886
- MannholdRDrossKPRekkerRFDrug lipophilicity in QSAR practice: I. A comparison of experimental with calculative approachesMolecular Informatics1990912128
- FurlanVHafiADessallesMCBouchezJCharpentierBTaburetAMMethadone is poorly removed by dialysisNephrol Dial Transplant199914125425510052536
- GwittPRPerrierDPlasma protein binding and distribution characteristics of drugs as indices of their hemodialyzabilityClin Pharmacol Ther1978242154161679594
- KellerFWilmsHSchultzeGOffermanGMolzahnMEffect of plasma protein binding, volume of distribution and molecular weight on the fraction of drugs eliminated by hemodialysisClin Nephrol19831942012056851257
- BellJSeresVBowdronPLewisJBateyRThe use of serum methadone levels in patients receiving methadone maintenanceClin Pharm Ther1988436623629
- LoimerNSchmidRGrunbergerJJagschRLinzmayerLPresslichOPathophysiological reactions in methadone maintenance patients do not correlate with methadone plasma levelsPsychopharmacology (Berl)199110345385402062987
- HolmstrandJAnggårdEGunneLMMethadone maintenance: plasma levels and therapeutic outcomeClin Pharmacol Ther1978232175180620477
- TennantFSJrInadequate plasma concentrations in some high-dose methadone maintenance patientsAm J Psychiatry198714410134913503661772
- TennantFShannonJCocaine abuse in methadone maintenance patients is associated with low serum methadone concentrationsJ Addict Dis199514167747632748
- TennantFOpioid serum concentrations in patients with chronic painJ Palliat Med20071061253125518095801
- JungBFReidenbergMMInterpretation of opioid levels: comparison of blood levels during chronic pain therapy to levels from forensic autopsiesClin Pharmacol Ther200577432433415903130
- HiltunenAJBeckOHjemdahlPRated well-being in relation to plasma concentrations of l- and d-methadone in satisfied and dissatisfied patients on methadone mainenance treatmentPsychopharmacology (Berl)1999143438539310367556
- RumpfKWRiegerJAnsogRDohtBSchelerFBinding of antibiotics by dialysis membranes and its clinical relevanceProc Eur Dial Transplant Assoc19781460760923529
- PubChem [homepage on the Internet](-)-Methadone hydrochloride compound summary for CID 20055402 Available from: http://pubchem.ncbi.nlm.nih.gov/compound/20055402Accessed January 28, 2015
- GrossmanDFKoppKFFreyJTransport of urea by erythrocytes during hemodialysisProc Eur Dial Transplant Assoc19684250253
- SargentJAGotchFAPrinciples and biophysics of dialysisMajerJFReplacement of Renal Function by Dialysis3rd edDordrechtKluwer198987143
- FournierRLBasic Transport Phenomena in Biomedical Engineering3rd edBoca RatonCRC Press2012
- DoleVPKreekMJMethadone plasma level: sustained by a reservoir of drug in tissueProc Natl Acad Sci U S A1973701104509643