
Abstract
Objective
The objective of this study was to explore the potential of the Infant/Toddler Sensory Profile (ITSP) as a screening tool for autism spectrum disorders (ASD) in prematurely born children.
Methods
Parents of 157 children with birth weights <1,500 g (aged 2 years, corrected for prematurity; 88 boys, 69 girls) completed a screening battery that included the ITSP, Modified Checklist for Autism in Toddlers (M-CHAT), and the Communication and Symbolic Behavior Scales Developmental Profile Infant-Toddler Checklist (CSBS-DP-ITC). Children with known disabilities were excluded. All the children who were screened positive on any of the screening tools subsequently underwent clinical examination including the Autism Diagnostic Observation Schedule.
Results
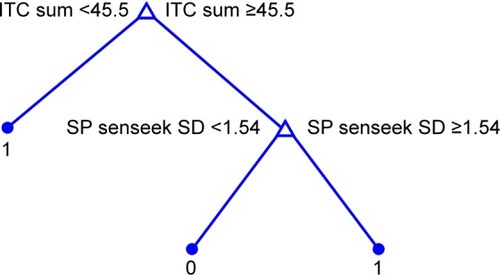
We used classification trees to answer the question whether ITSP (or some of its subscales) could be combined with the M-CHAT and/or the CSBS-DP-ITC or its subscales into an effective ASD screening tool. Using the CSBS-DP-ITC, overall score, and the Sensation Seeking subscale of the ITSP, we obtained a screening tool that was able to identify all of the ASD children in our sample (confirmed by cross-validation). The proposed screening tool is scored as follows: 1) if the overall CSBS-DP-ITC value is <45.5, then the screening is positive; 2) if the overall CSBS-DP-ITC value is ≥45.5 and the z-score of the Sensation Seeking subscale of ITSP is ≥1.54, then the screening is positive; 3) otherwise, the screening is negative.
Conclusion
The use of CSBS-DP-ITC in combination with the Sensation Seeking subscale of the ITSP improved the accuracy of autism screening in preterm children.
Introduction
Sensory processing is the ability to receive, organize, and interpret sensory stimuli, including, but not limited to, oral, visual, vestibular, and auditory experiences.Citation1 One of the best tools to evaluate the sensory symptoms in young children is the Infant/Toddler Sensory Profile (ITSP).Citation1 It is a judgment-based caregiver questionnaire that characterizes a child’s behaviors and performance in relation to sensory processing. It provides a standardized method to measure a child’s sensory processing abilities and to profile the effect of sensory processing on functional performance in the daily life of a child aged 0–36 months.Citation1 The ITSP was created to extend the age range of the original instrument, the Sensory Profile.Citation2 The ITSP standardization process took place between 2000 and 2001 and evaluated >1,100 infants and toddlers with and without disabilities between birth and 36 months of age.
The theoretical and conceptual features of the ITSP are based on Dunn’s model of sensory processing. DunnCitation1,Citation2 hypothesized an interaction between neurological thresholds and behavioral responses. Neurological threshold refers to the amount of stimuli required for a neuron or neuron system to respond. It is a continuum, with very high thresholds on one end and very low thresholds on the other end. The operations of the entire nervous system are based on excitation and inhibition. Excitation occurs when the neurons are more likely to respond or are activated. Inhibition occurs when the likelihood of responding is decreased or responses are blocked. The balance between these two extreme states is adjusted through modulation, which refers to the brain’s regulation of neural messages by facilitating or inhibiting responses. When modulation is intact, the nervous system responds to some stimuli while ignoring other stimuli, and the child generates an appropriate adaptive response to the situation.Citation1 Poor sensory processing can take the form of over-responsivity or lack of responsivity. Behavioral response/self-regulation refers to the way children act relative to their thresholds. Passive responses to threshold indicate that the child behaves consistently with neurological threshold; however, active responses to thresholds indicate that the child behaves more actively and works against thresholds.Citation1
Although difficulties with sensory processing have been associated with autism since it was first defined as a diagnosis,Citation3 there has been a long-lasting debate whether sensory symptoms are a component of core autistic deficits or a co-morbid phenomenon.Citation4,Citation5 Two theories of sensory dysfunction in autism have been suggested: (1) over-arousal and (2) under-arousal theory. According to a review by Rogers and Ozonoff,Citation6 there is more evidence that children with autism are hypo-responsive to sensory stimuli; however, there is very little support for hyper-arousal and failure of habituation in autism.
Sensory symptoms are often evaluated in the diagnosis of autism and are scored in “gold-standard” autism diagnostic measures. Sensory symptoms are more frequent and prominent in children with autism than in typically developing children. Leekam et alCitation7 showed that >90% of children with autism had sensory abnormalities and had sensory symptoms in multiple sensory domains. Sensory abnormalities were pervasive, multimodal, and persistent across age and ability in children and adults with autism. However, evidence that these symptoms differentiate autism from other developmental disorders is lacking. Certain groups, including children with fragile X syndrome or those who are deaf–blind, seem to demonstrate higher rates of sensory symptoms than children with autism,Citation6 even though fragile X syndrome might be one of the many etiologies behind autism.
The development of parent-caregiver-administered, standardized norm-referenced sensory questionnaires has allowed quantification of these behaviors relative to age norms. Findings from standardized questionnaires show that 45%–95% of individuals with Autism Spectrum Disorders (ASD) present with high frequencies of sensory behaviors that are >1 standard deviation (SD) away from norms.Citation8–Citation10 A meta-analysis of 14 studies by Ben-Sasson et alCitation4 indicated a significant difference between ASD and typical groups relative to the presence and frequency of sensory symptoms, with the greatest difference in 1) under-responsivity, followed by 2) over-responsivity, and 3) sensation seeking. Sensory differences were greatest in studies of children aged 6–9 years, samples with an autism diagnosis in >80% of cases, and compared to a chronological age-matched group versus mental age/developmental delay-matched group.
ASD prevalence in the general pediatric population is currently believed to be in the range of 1%–1.5%.Citation11,Citation12 However, there are populations with increased risk for ASD. Recent studies on the prevalence of ASD in prematurely born children have indicated high prevalences of ASD, ranging between 3.65% and 12.9%.Citation13–Citation17
There is a challenging question, whether different performance on the sensory profile could be used to indicate which prematurely born infants are at greatest risk of developing ASD in the future. As for sensory symptoms and prematurity, DunnCitation1 described some significant differences in the data for children aged 0–6 months born prior to 38 weeks of gestation. These babies tended to be hyper-responsive to stimuli during the early months of development. However, Dunn found no significant differences in the data for children aged 7–36 months based on the time they were born in relation to their gestation. Dunn hypothesized that the effects of prematurity fade as the child gains more experience with sensation. On the other hand, several studies have published data about atypical sensory profile scores in the population of preterm infants. Atypical sensation seekingCitation18 and atypical oral and auditory sensory processingCitation19 have been reported in late preterm infants (gestational age between 34 and 35 weeks). Wickremasinghe et alCitation20 reported that ~40% of sensory profiles have been found to be atypical among children born very prematurely (≤32 weeks of gestation). No specific perinatal or neonatal risk factors were associated with atypical overall sensory profiles. Eeles et alCitation21 compared the sensory profiles of very preterm children born before 30 weeks of gestation with the profiles of term-born controls at 2 years of age. They found that very preterm children had scores consistent with stronger patterns on sensory profiles compared with term-born children; an association with male sex, higher social risk, longer hospital stays, and moderate to severe white matter abnormalities were also described. Recently, Rahkonen et alCitation22 described that atypical sensory processing in very preterm children was common, and children with neonatal neuroanatomical lesions tended to present specific behavioral responses to sensory stimuli. However, none of the studies was focused on the simultaneous presence of sensory symptoms and autism in a population of prematurely born children.
It is striking that preterm children may have both a risk of atypical sensory behaviors as well as increased rates of ASD. It is possible that atypical sensory behaviors in very low and extremely low birth weight children may result in false-positive ASD diagnoses.Citation22 On the other hand, atypical sensory behaviors might be important components of the ASD phenotype, at least in some preterm infants. Our team was the first to use a standardized norm-referenced sensory parent questionnaire as an autism-specific screening tool in prematurely born children. The other screening instruments used in this study were broadband screens, the Modified Checklist for Autism in Toddlers (M-CHAT), and the Communication and Symbolic Behavior Scales Developmental Profile Infant-Toddler Checklist (CSBS-DP-ITC). We have already published two articles on this topic. The first article was based on preliminary data and involved first 101 examined preterm children.Citation16 The second article comprised the final sample of 157 preterm children and was focused on ASD prevalence in preterm children, as well as on specific psychometric values of the three tests.Citation17 Our assessment of the screening potential of the ITSP led to skepticism. Its usefulness as a sole test in autism screening seemed to be limited. The ITSP was significantly inferior to the CSBS-DP-ITC (14.3% versus 27.1% of positive screens, P=0.022) and nonsignificantly inferior to the M-CHAT (14.3% versus 17.8%, P=0.522) in our study.Citation17 Although the present study is based on the same final data set, its aim and methods are completely different.
The objective of the present study was to determine whether there is enough evidence to recommend the use of ITSP or some of its subscales as an additional tool for the detection of autism for use in combination with other screening instruments. Although our previous papersCitation16,Citation17 dealt with the traditional comparison of the screening tests by means of standard statistical methods, the present study is mainly based on innovative mathematical methods to achieve a more complex model of autism screening.
Materials and methods
Sample
Preterm children with birth weights <1,500 g were consecutively recruited from March 2012 to June 2014. Three centers for newborns and infants at risk participated in the study: Department of Pediatrics, University Hospital Motol, Prague; Department of Pediatrics and Adolescent Medicine, General University Hospital, Prague; and Department of Pediatrics, University Hospital, Hradec Kralove. Families were informed about the research project during routinely scheduled checkups for 2-year-old children (age corrected for prematurity). Children with substantial disabilities, such as cerebral palsy or major vision and/or hearing impairments, were excluded, as well as children with specific syndromes, which had been confirmed prior to the evaluation. The study was approved by the ethics committees of all three participating hospitals (Ethics Committee for Multi-Centric Clinical Trials of the University Hospital Motol, Prague, Reference number: EK-372/12; Ethics Committee of the General University Hospital, Prague, Reference number: 22/12; Ethics Committee, University Hospital Hradec Kralove, Reference number: 201209 S13P).
Parents of 247 children with birth weights <1,500 g agreed to participate in the study and signed informed consents. Of these, parents of 157 children (63.6%) completed the screening questionnaires, which were sent to the Department of Child Psychiatry. The sample consisted of 88 boys and 69 girls, aged 2 years (corrected for prematurity). The mean gestational age at birth was 28.2±2.6 weeks. However, not all cases could be used in all data analyses. For the classification process, only 131 cases were included (23 children, who were positive on at least one screening test, but whose parents did not agree to the clinical examination, were excluded as well as three cases that involved missing information that was essential for the comparison).
ASD screening tools
The screening battery included: the Modified Checklist for Autism in Toddlers (M-CHAT), the Communication and Symbolic Behavior Scales Developmental Profile Infant Toddler Checklist (CSBS-DP-ITC), and the ITSP.
Detailed description and information about the psychometric properties of the M-CHAT and the CSBS-DP-ITC were given in our previous paper.Citation16 As the current study focuses specifically on the ITSP, we add more detailed information about the characteristics of this tool.
The ITSPCitation1 is a 48-item parent-caregiver questionnaire that measures sensory modulation abilities in children aged 7–36 months. Parents rate the frequency of their child’s behavior on a 5-point scale from 1 (almost always) to 5 (almost never). Items are grouped into five sensory systems sections, that is, auditory processing (10 items), visual processing (7 items), tactile processing (15 items), vestibular processing (6 items), and oral sensory processing (7 items). Three items refer to general processing. Another grouping of the items yields four quadrant scores, which characterize the child’s neurological thresholds and behavioral responses to sensory stimuli. Quadrant scores are divided into low registration, sensation seeking, sensory sensitivity, and sensation avoiding. Scores at the higher end of the scoring continuum indicate the child is less responsive than their peers, whereas scores at the lower end of the scoring continuum indicate the child is more responsive than their peers. Section scores and quadrant scores are interpreted relative to age norms. Scores between −1 SD and +1 SD from the mean represent typical performance. Definite differences correspond to scores outside ±2 SD and probable difference to scores between ±1 and ±2 SD. Scores <−1 SD represent more frequent atypical responses than others because ITSP gives the lowest points always. Scores >+1 SD represent less frequent atypical responses than others because ITSP never gives the highest points. Reliabilities for various composites scores range from 0.69–0.85. The ITSP is not generally used for screening; therefore, we established a new criterion for a positive screening. Participants were considered to have screened positive if results were outside 2 SD of population norms (“definite difference”) on at least two scores involving the section and/or quadrant scores.
Procedure
The parents of prematurely born children with very low birth weights (VLBW <1,500 g) and extremely low birth weights (ELBW <1,000 g) (2 years of age, corrected for prematurity) completed the screening battery questionnaires and sent them to the Department of Child Psychiatry at Motol University Hospital. All the children who were screened positive on any of the screening tools were subsequently invited for a detailed follow-up assessment. The assessment involved testing using the Autism Diagnostic Observation Schedule (ADOS)Citation23 and a clinical examination by two experienced child psychiatrists with expertise in autism. The concept of the “best estimate clinical diagnosis” (BED) was used as the gold standard.Citation24 In cases of disagreement between the ADOS diagnosis and best estimate clinical diagnosis, the latter was preferred. The International Classification of Diseases, Tenth Edition (ICD-10) provided the criteria for the clinical diagnoses.Citation25
Data analysis tools
Statistical analysis was performed using the Statistical Package for the Social Sciences (SPSS, version 22.0; IBM Corporation, Armonk, NY, USA) and R (R Core Team, 2015).Citation26 Descriptive statistics for the samples were used. The Cochran’s Q test was used for analyzing differences in positive screening results among tests. More detailed pair comparisons between tests were performed using the paired Wilcoxon sign test false discovery rate adjusted for multiple testing.
Further analysis of the data was performed using MATLAB R2014a. Classification treesCitation27–Citation29 were used as a basic analysis tool to identify promising scales or subscales of the three diagnostic instruments (M-CHAT, CSBS-DP-ITC, and ITSP). Classification trees are a mathematical tool used to partition a set of objects into subsets (classes) based on the values of a nominal or ordinal discrete variable (eg, correct diagnoses). The classification is performed based on the values of one or more features of the objects (or values of specific scales/diagnostic tools). From the diagnostic point of view, the variable defining the classes can be binary (ie, a positive or negative diagnosis) and the characteristic features can be the values/outputs/scores of various diagnostics or screening tools (methods) – this is the case of binary classification trees. Binary classification-tree models employed in the analysis presented in this paper hierarchically select features that best distinguish between two classes (ie, positive diagnosis [P] and negative diagnosis [N]) and specify the threshold values of these features (the classification tree is then split at the given node into sub-branches based on the value of these thresholds or cutoffs and appropriate classes are assigned to the sub-branches). This is the established system behind many diagnostic methods used in psychology and medicine – to identify those features that provide the best discrimination power (eg, between people who should be assigned a diagnosis and people who should not) and to specify the cutoff value(s) of the identifying feature; that is, the values that are characteristic for the given class (diagnosis). In this sense, classification trees can be seen as a tool for the selection of appropriate cutoffs of given scales (features) and as a tool that is not dependent on specific standardizations of the measurement instruments. For those diagnostic (or screening) tools that deal with raw scores or their linear transformation, the classification tree can itself be considered a standardization procedure (if the sample is representative of the given population). Classification trees also allow for reflection on the severity of false negative (FN) and false positive (FP) errors. This was done by assigning different “costs” to these types of errors.
The selection of features for classification is done step by step based on the minimization of the cost function, reflecting the relative severity of FN-type and FP-type errors – sometimes called the “impurity,” which is a weighted sum of FN and FP. In the first step, the feature that provides the largest reduction of impurity is identified as the root node of the tree structure representing the classification process; at that node, the set of data to be classified is split into two disjointed subsets with respect to the threshold value for which the impurity of classification, based solely on the root node feature, is minimal. Two branches of the classification tree are thus defined each representing a different class and the features representing their end nodes (leaves) are identified analogically. The process of splitting nodes (creating branches) stops when zero impurity is reached (ie, all the data instances in the given branch are correctly classified) or no reduction of impurity is possible. A classification tree obtained this way is a representation of the classification process. As such it is a description of how to assign a class to each data instance based on the values of the selected features ( shows our proposed classification tree). To avoid overfitting, that is, to make the resulting classification tree more robust, we prune the resulting classification trees so that relatively few levels or decision nodes remain (during the actual analysis of the data, we identified two levels or a maximum of three decision nodes as a reasonable level of pruning). The resulting classifier is then examined by the “leave-one-out cross-validation” procedure to assess its robustness in more detail.Citation27,Citation30
Figure 1 Proposed classification tree.
Abbreviations: CSBS-DP-ITC, Communication and Symbolic Behavior Scales Developmental Profile Infant-Toddler Checklist; ITSP, Infant/Toddler Sensory Profile; SD, standard deviation.
Results
Variables used in the analysis
The objective of this study was to determine whether ITSP (or some of its subscales) can be combined with other screening tools (eg, the M-CHAT, CSBS-DP-ITC, or its subscales) into an effective ASD screening tool that could better discriminate between autistic and nonautistic cases. In order to address this, we applied classification trees to the sets of available data (ie, variables/criteria) and overall results or subscales of the ITSP, M-CHAT, and CSBS-DP-ITC, which consisted of:
The overall scores for the M-CHAT and CSBS-DP-ITC (raw-scores) – two features
Two separate raw scores from the M-CHAT (score for critical questions and score for overall questions) – two features
The raw scores of the subscales of the CSBS-DP-ITC (social composite, speech composite, and symbolic composite) – three features
The scores from the ITSP subscales (auditory processing, visual processing, tactile processing, vestibular processing, oral sensory processing, low registration, sensation seeking, sensory sensitivity, and sensation avoiding) – nine features.
In this case, in accordance with the diagnostic manual, the raw scores of the scales were transformed into z-scores.
The screening results obtained from each tool separately – three features.
The aggregated results of pairs of screening tools (a screening was considered positive if at least one of the tools from the pair was positive) – three features.
The overall result of the screening: a combination of all the three screening tools; the M-CHAT, CSBS-DP-ITC, and ITSP used together (screening was considered positive if any of the three methods was positive) – one feature.
For the ITSP, we converted raw scores to z-scores (since the diagnostic manualCitation1 suggests the use of z-scores). However, we did not use the absolute values of the distance from the mean, in terms of standard deviation multiples, that is, the absolute values of z-scores as applied in the screening and suggested in the ITSP diagnostic manual, since these values assume symmetry in the diagnostic power of positive and negative deviations. Therefore, we worked with z-scores of the scales (ie, both positive and negative values) to allow for possible asymmetry. This is a more general approach and does not violate the reasoning used in the construction of the method and the cutoff scores. In total, 23 features were considered. Based on the purpose of the screening, we considered misclassification costs of FN-type errors to be higher than the misclassification costs of FP-type errors. The optimal resulting screening tool (classifier) was one that had an FN as close to 0 as possible, while at the same time having a reasonably low FP count.
Having selected these 23 features, we obtained a data set of 131 cases (for description of excluded cases, see Methods, subsection Sample). As a correct/final diagnosis, we used the “best estimate clinical diagnosis” made by two experienced child psychiatrists with expertise in autism (the concept is discussed in the Methods section).
The resulting classification tree and its cross-validation
The classification trees were pruned to two levels (with a maximum of three decision nodes), and subsequently the “leave-one-out cross-validation” procedure was applied to the pruned tree (leaving only the selected features corresponding to the decision nodes in the pruned tree). The following characteristics of the classifier were computed both for the classifier and for its cross-validation: FN count, FP count, TN count, TP count, accuracy, sensitivity, specificity, positive predictive value (PPV), negative predictive value (NPV), false-positive rate (FRP), false-negative rate (FNR), F measure, area under the ROC curve (AUROC), and Cohen’s kappa coefficient – all under their standard definitions.Citation31
Applying the classification tree method to the 23 features, we identified the classification tree presented in as the best classifier that can be constructed and remain sufficiently robust. The characteristics of the classification results are summarized in . Note, that it is possible to achieve FN =0 (NPV =1 and sensitivity =1) while the count of FP =18 is reasonably low. Using the CSBS-DP-ITC overall score and the Sensation Seeking subscale of the ITSP, we obtain a screening tool that could identify all the children with ASD in our sample. The items included in the Sensation Seeking subscale are described in . The behaviors covered by this subscale are easily identifiable in the studied age group. Since the tree is pruned to just two decision nodes, the risk of overfitting is low. The robustness of the proposed classifier (screening tool) is demonstrated by the results of the “leave-one-out cross-validation.” This validation technique was applied to assess how the results would generalize to an independent data set. The main purpose of using the leave-one-out cross-validation was to see how accurately the classification model would perform in practice (also for independent samples outside the current data set). The basic idea was to separate data into a training data set (used to establish our model) and a testing data set (which is then used to validate the model) – the classifiers built into the cross-validation never use the whole data set for fitting. The cross-validation in this case resulted in same identical characteristics as the original classifier. This can be interpreted to mean that no single data instance carries crucial information for its classification.
Table 1 Characteristics of the proposed classification process (screening tool) based on the CSBS-DP-ITC overall score and the Sensation Seeking subscale of ITSP
Table 2 Sensation seeking subscale
The proposed screening tool (see ) suggests the following reasoning for screening:
If the overall value of the CSBS-DP-ITC is <45.5, then the screening is positive.
If the overall value of the CSBS-DP-ITC is ≥45.5 and the z-score for the Sensation Seeking subscale of the ITSP is ≥1.54, then the screening is positive.
Otherwise, the screening is negative.
Note that CSBS-DP-ITC is positive when its overall raw score (denoted as ITC sum in this paper) is ≤42. The classification tree depicted in suggests a threshold for a positive outcome at 45.5. Since this value is higher than the value in the diagnostics manual for the CSBS-DP-ITC, every child screened positive with respect to the CSBS-DP-ITC would also be classified as positive according to the proposed classifier (ie, a screening based on the proposed classification tree would be positive). Therefore, the screening tool proposed in this paper is more “conservative” (since FN errors are a more significant problem, our screening might identify more children as positive, but it can never identify fewer TP than the CSBS-DP-ITC with a threshold of 42).
Interpretation of the proposed classification tree
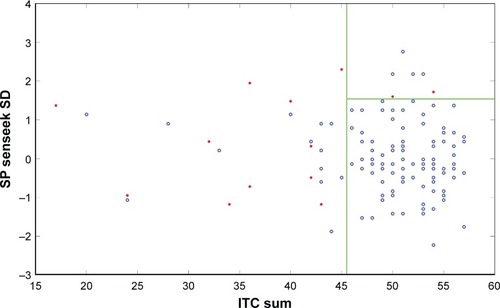
According to the ITSP diagnostics manual for the given age of children, the raw scores outside the interval (mean −2 SD, mean +2 SD) are considered to be definitely different from the norm (the corresponding interval in z-scores is [−2, 2]). Our classifier identifies the z-score cutoff at 1.54, values above this threshold indicate positive screening results for ASD. Above the mean value, this threshold is again more “conservative” in the same sense as in the CSBS-DP-ITC discussed above. Note that negative deviations from the mean (over-responsiveness according to the ITSP) are not considered to be significant for screening purposes. provides a clear illustration that negative sample values of z-scores have low classification power. This is a clear argument for the use of z-scores over their absolute values in connection with the ITSP in this case. The effect of the screening rules 1, 2, and 3 are summarized in , where the values of overall CSBS-DP-ITC score are plotted against ITSP sensation seeking (SD) values. Our work has allowed us to identify two features that can be used in the screening for ASD in prematurely born children. clearly illustrates that the ITSP sensation seeking (SD) values provide valuable screening information. The data confirm () that the decision not to deal with the absolute values of z-scores regarding ITSP was reasonable (ie, values of ITSP sensation seeking [SD] greater than the mean value provide the necessary additional information for classification). Additionally, if z-score values <−1.54 were considered to be representative of ASD, then the FP count would increase without any improvement in the performance of the suggested screening tool. We should also note that from the clinical perspective, four measures are being considered in the proposed classifier – the ITSP sensation seeking scale, and the three subscales of CSBS-DP-ITC: social composite, speech composite, and symbolic composite (since the sum of their scores constitutes the overall CSBS-DP-ITC score).
Figure 2 Visualization of the effect of the suggested screening tool on the data sample.
Abbreviations: ASD, autism spectrum disorder; CSBS-DP-ITC, Communication and Symbolic Behavior Scales Developmental Profile Infant-Toddler Checklist; ITSP, Infant/Toddler Sensory Profile.
Discussion
Preterm children are at increased risk of both atypical sensory behaviorsCitation19–Citation22 and ASD.Citation13–Citation17 The role of sensory abnormalities in the higher prevalence rate of ASD in the preterm population is not thoroughly understood. It has been stated that for autism, in general, most evidence supports the hypo- responsiveness to sensory stimuli, while theories about hyper-arousal and failure of habituation lack significant support.Citation6 On top of that, children with ASD differ significantly from typical groups regarding the presence and frequency of mainly under-responsivity, followed by over-responsivity, and sensation seeking.Citation4 On the other hand, atypical sensory profile scores have been described in preterm infants,Citation19–Citation22 without agreement on the typical sensory profile pattern for this group. Some studies of preterm infants included information about special neurological abnormalities, which might be the root of abnormal sensory symptoms. Moderate to severe white matter abnormalitiesCitation21 and neonatal neuroanatomical lesionsCitation22 have been described. We infer that abnormal sensory processing might be an important component of the diagnosis of ASD in at least some preterm children; however, in other children, these symptoms might lead to false-positive screening results for ASD, which has already been suggested by Wickremasinghe et alCitation20 and Rahkonen et al.Citation22 The strength of our screening study is that all toddlers with positive screening results on any of the screening tools were invited for the detailed diagnostic assessment, during which an ASD diagnoses was confirmed or excluded.
Our assessment of the screening potential of the ITSP, performed also on preterm population, led to skepticism.Citation17 However, we still foresee a possible role for the ITSP, or some of its subscales, when used as an adjunct with other screening instruments, to identify some cases of ASD in the preterm population. This assumption is based on previous research that found abnormalities in sensory behaviors in 45%–95% of individuals with ASD;Citation7–Citation10 however, in general, evaluation of sensory symptoms is underrepresented in autism screening tools.
In our data analysis, we used classification trees to examine all possible combinations of overall results as well as results from subscales from three screening tools (23 features in total) to find the optimal screening result of our sample. Based on clinical implications, an optimal screening result was one with an FNR close to 0, and with the false positive rate also being reasonably low. On the basis of this approach, we identified that the optimal positive screening result is achieved when the overall CSBS-DP-ITC value was <45.5, or when the overall CSBS-DP-ITC value was ≥45.5 and the Sensation Seeking subscale of the ITSP was ≥1.54. This finding was in line with our theoretical assumption that abnormal sensory processing might help identify some preterm children with ASD.
The positive overall CSBS-DP-ITC score used in our study (45.5) was greater than the positive overall score recommended by the authors – “less than or equal to 42,”Citation34 therefore our screening might identify more children with ASD. The importance of the Sensation Seeking subscale, however, is surprising, given that the subscale value (≥1.54) means that the child engages in sensation seeking behavior less frequently than others.
The evidence regarding sensation seeking patterns in children with ASD is the least consistent. Ermer and DunnCitation35 found that a lower incidence of sensation seeking behavior was one of the main characteristics that differentiated children with ASD from both typically developing children and children with ADHD and suggested that since the Sensory Profile was able to discriminate between the studied groups, the measure might be useful during the screening process for autism, PDD, or ADHD. In contrast, DunnCitation1 did not find a difference in sensation seeking scores for toddlers with PDD and typically developing children, when using the ITSP. On top of that, the higher incidence of sensation seeking behaviors in children with ASD compared with typically developing children was described by Dunn et alCitation36 and Watling et al.Citation37 Ben-Sasson et alCitation38 suggested that this inconsistency may relate to differences in the age range, which ranged from 3 to 15 years. In the study of Ben-Sasson et al,Citation4 toddlers with ASD were most distinct from typically developing groups in their low frequency of sensation seeking, high frequency of under-responsiveness, and avoidance behaviors. In a meta-analysis by Ben-Sasson et al,Citation4 a lower incidence of sensation seeking in studies of 0- to 3-year olds was the only finding of a lower frequency of any sensory seeking behavior in ASD cases relative to typical groups. Chronological age was found to be the only factor that contributed to the variability in sensation seeking in persons with ASD. Therefore, these findings could be explained that the sensation seeking increases with age. These behaviors in toddlers with ASD may not differ from typically developing toddlers in frequency (as described by the ITSP) but rather in quality.Citation38
The low incidence of sensation seeking behavior might be that fortuitous feature that can discriminate between preterm children who will develop ASD and those who will not, relative to those with negative screening results on the CSBS-DP-ITC.
The results of our study may encourage future development of screening tests for autism that include questions related to Sensation Seeking behavior. Before making any recommendations regarding clinical practice based on our results, our results on this particular population should be replicated; although, we think that using screening instruments in preterm children with more than a 10-fold increase in prevalence does not significantly handicap the data, since a lower-order number of probands is needed in order to obtain reliable results.Citation16
The limitation of our study was that a large number of children with positive screens did not undergo clinical evaluation because of their parent’s lack of interest (23 of 56 [41.1%]).Citation17 However, drop-outs are a well-known problem in the follow-up studies. In the only follow-up study performed in preterms (besides ours),Citation39 the drop-out rate was 14% even when the authors used telephone follow-ups, which are much more convenient for parents than the clinical evaluation that was used in our study.
Conclusion
The utility of ITSP alone as a screening tool for autism, initially, did not seem to be very promising; however, when the Sensation Seeking subscale of the ITSP was used in combination with the CSBS-DP-ITC, the screening accuracy for autism in preterm children was substantially improved.
Acknowledgments
Supported by the project (Ministry of Health, Czech Republic) for conceptual development of research organization 00064203 (University Hospital Motol, Prague, Czech Republic) and by the Ministry of Health of the Czech Republic, grant No 16-31754A. All rights reserved. The research was also partially supported by the grant IGA_FF_2016_007 from the internal grant agency of Palacky University. The authors would like to thank Thomas Secrest, MSc, for his assistance with the English version of the manuscript.
Disclosure
The authors report no conflicts of interest in this work.
References
- DunnWInfant/Toddler Sensory Profile: User’s ManualSan Antonio, TXPsychological Corporation2002
- DunnWWestmanKThe sensory profile: the performance of a national sample of children without disabilitiesAm J Occup Ther199751125348978860
- KannerLAutistic disturbances of affective contactNervous Child19432217250
- Ben-SassonAHenLFlussRCermakSAEngel-YegerBGalEA meta-analysis of sensory modulation symptoms in individuals with autism spectrum disordersJ Autism Dev Disord20093911118512135
- DudovaIHrdlickaMOlfactory functions are not associated with autism severity in autism spectrum disordersNeuropsychiatr Dis Treat201391847185124399878
- RogersSJOzonoffSAnnotation: what do we know about sensory dysfunction in autism? A critical review of the empirical evidenceJ Child Psychol Psychiatry2005461255126816313426
- LeekamSRNietoCLibbySJWingLGouldJDescribing the sensory abnormalities of children and adults with autismJ Autism Dev Disord200737589491017016677
- BakerAELaneAAngleyMTYoungRLThe relationship between sensory processing patterns and behavioral responsiveness in autistic disorder: a pilot studyJ Autism Dev Disord200838586787517899349
- BaranekGTDavidFJPoeMDStoneWLWatsonLRSensory experience questionnaire: discriminating sensory features in young children with autism, developmental delays, and typical developmentJ Child Psychol Psychiatry200647659160116712636
- TomcheckSDDunnWSensory processing in children with and without autism: a comparative study using the Short Sensory ProfileAm J Occup Ther200761219020017436841
- Baron-CohenSScottFJAllisonCPrevalence of autism-spectrum conditions: UK school-based population studyBr J Psychiatry200919450050919478287
- BaioJPrevalence of autism spectrum disorders among children aged 8 years – Autism and Developmental Disabilities Monitoring Network, 11 sites, United States, 2010MMWR Surveill Summ2014632121
- HackMTaylorHGSchluchterMAndreiasLDrotarDKleinNBehavioral outcomes of extremely low birth weight children at age 8 yearsJ Dev Behav Pediatr20093012213019322106
- JohnsonSHollisCKochharPHennessyEWolkeDMarlowNAutism spectrum disorders in extremely preterm childrenJ Pediatr201015652553120056232
- Pinto-MartinJALevySEFeldmanJFLorenzJMPanethNWhitakerAHPrevalence of autism spectrum disorders in adolescents born weighing <2,000 gramsPediatrics201112888389122007018
- DudovaIKasparovaMMarkovaDScreening for autism in preterm children with extremely low and very low birth weightNeuropsychiatr Dis Treat20141027728224627633
- DudovaIMarkovaDKasparovaMComparison of three screening tests for autism in preterm children with birth weights less than 1500 gramsNeuropsychiatr Dis Treat2014102201220825484588
- Case-SmithJButcherLReedDParents’ report of sensory responsiveness and temperament in preterm infantsAm J Occup Ther1998525475559693699
- BartOShayevitsSGabisLVMoragIPrediction of participation and sensory modulation of late preterm infants at 12 months: a prospective studyRes Dev Disabil2011322732273821742470
- WickremasingheACRogersEEJohnsonBCShenABarkovichAJMarcoEJChildren born prematurely have atypical sensory profilesJ Perinatol201333863163523412641
- EelesALAndersonPJBrownNCSensory profiles of children born <30 weeks’ gestation at 2 years of age and their environmental and biological predictorsEarly Hum Dev20138972773223764299
- RahkonenPLanoAPesonenAKAtypical sensory processing is common in extremely low gestational age childrenActa Paediatr2015104552252825620288
- LordCRisiSLambrechtLThe autism diagnostic observation schedule-generic: a standard measure of social and communication deficits associated with the spectrum of autismJ Autism Dev Disord200030320522311055457
- KimSHLordCCombining information from multiple sources for the diagnosis of autism spectrum disorders for toddlers and young preschoolers from 12 to 47 months of ageJ Child Psychol Psychiatry201253214315121883205
- World Health OrganizationInternational Classification of Diseases10th edGeneva, Switzerland1992
- R Core TeamR: A language and environment for statistical computingR Foundation for Statistical ComputingVienna, Austria Available from: https://www.R-project.org/Accessed June 2, 2016
- DudaROHartPEStorkDGPattern Classification2nd edNew YorkWiley-Interscience2001
- RokachLMaimonOData Mining with Decision Trees: Theory and Applications2nd edSingaporeWorld Scientific2015
- QuinlanJRInduction of decision treesMach Learn19861181106
- KunchevaLIFuzzy Classifier DesignHeidelberg, NYSpringer Physica Verlag2000
- MacmillanNACreelmanDCDetection Theory: A User’s Guide. 2nd Edition. AnalysisMahwah, NJLawrence Erlbaum Associates2005
- FawcettTAn introduction to ROC analysisPattern Recognit Lett2006278861874
- SimJWrightCCThe kappa statistic in reliability studies: use, interpretation, and sample size requirementsPhys Ther200585325726815733050
- WetherbyAMBrosnan-MaddoxSPeaceVNewtonLValidation of the Infant-Toddler Checklist as a broadband screener for autism spectrum disorders from 9 to 24 months of ageAutism200812548751118805944
- ErmerJDunnWThe sensory profile: a discriminant analysis of children with and without disabilitiesAm J Occup Ther19985242832909544354
- DunnWMylesBSOrrSSensory processing issues associated with Asperger syndrome: a preliminary investigationAm J Occup Ther20025619710211833406
- WatlingRLDeitzJWhiteOComparison of sensory profile scores of young children with and without autism spectrum disordersAm J Occup Ther200155441642311723986
- Ben-SassonACermakSAOrsmondGIExtreme sensory modulation behaviors in toddlers with autism spectrum disordersAm J Occup Ther200761558459217944296
- GuyASeatonSEBoyleEMInfants born late/moderately preterm are at risk for a positive autism screen at 2 years of ageJ Pediatr201516626927525477165