
 ?Mathematical formulae have been encoded as MathML and are displayed in this HTML version using MathJax in order to improve their display. Uncheck the box to turn MathJax off. This feature requires Javascript. Click on a formula to zoom.
Abstract
Purpose
Obstructive sleep apnea (OSA) is a common sleep-related breathing disorder that can damage cognitive function. However, the functional network organization remains poorly understood. The aim of this study was to investigate the topological properties of OSA patients using a graph theoretical analysis.
Patients and methods
A total of 30 male patients with untreated severe OSA and 25 male education- and age-matched good sleepers (GSs) underwent functional magnetic resonance imaging (MRI) examinations. Clinical and cognitive evaluations were conducted by an experienced psychologist. GRETNA (a toolbox for topological analysis of imaging connectomics) was used to construct the brain functional network and calculate the small-world properties (γ, λ, σ, Eglob, and Eloc). Relationships between these small-world properties and clinical and neuropsychological assessments were investigated in OSA patients.
Results
The networks of both OSA patients and GSs exhibited efficient small-world topology over the sparsity range of 0.05–0.40. Compared with GSs, the OSA group had significantly decreased γ, but significantly increased λ and σ. The OSA group’s brain network showed significantly decreased Eglob (P<0.05) over the sparsity range of 0.09–0.15, but significantly increased Eloc over the sparsity range of 0.23–0.40. In OSA patients, γ was significantly negatively correlated with apnea–hypopnea index (AHI; r=−0.326, P=0.015) and Epworth Sleepiness Scale (ESS; r=−0.274, P=0.043), λ was significantly positively correlated with AHI (r=0.373, P=0.005) and ESS (r=0.269, P=0.047), and σ was significantly negatively correlated with AHI (r=−0.363, P=0.007) and ESS (r=−0.295, P=0.029).
Conclusion
Our results suggest that the high degree of local integration and integrity of the brain connections in OSA patients may be disrupted. The topological alterations of small-world properties may be the mechanism of cognitive impairment in OSA patients. In addition, σ, γ, and λ could be used as a quantitative physiological index for auxiliary clinical diagnoses.
Introduction
Obstructive sleep apnea (OSA) is a common multisystem chronic disorder and the most common type of sleep apnea, and it is characterized by recurrent episodes of partial (hypopnea) or complete (apnea) blockage of the upper airway during sleep. These blockages result in irregular oxygen desaturation (cyclical intermittent hypoxia), intermittent hypercapnia, repetitive arousals, and sleep fragmentation. OSA affects approximately 5.7%–6.0% of middle-aged men and 2.4%–4.0% of middle-aged women.Citation1 Its prevalence in older populations is 24%–30%.Citation2 The deleterious effect of OSA includes excessive sleepiness, increased risk of traffic accidents, impaired work performance, depression, fatigue,Citation3 anxiety, a worsening quality of life, increased risk of metabolic dysfunction,Citation4 cardiovascular disease,Citation5 neurocognitive deficits,Citation6 stroke,Citation7 and death.Citation8 The detrimental neurocognitive effects of OSA include cognitive deficits (eg, impaired attention and memory), psychomotor dysfunction, and decreased vigilance.Citation9,Citation10 Sleep fragmentation and repetitive nocturnal hypoxia have been considered the main contributory mechanisms of neuropsychological impairment in OSA patients, but the pathophysiological mechanism of the neurocognitive deficits and the underlying basis for the development of neurocognitive dysfunction in OSA patients remain largely unclear. Neuroimaging methodologies have been widely used to improve our understanding of cognitive dysfunction in OSA patients.
Previous resting-state functional magnetic resonance imaging (Rs-fMRI) studies in OSA patients have primarily focused on functional abnormalities and structural changes in brain regions, and they have found these changes to be associated with cognitive function deficits. OSA patients showed altered resting-state functional connectivity (Rs-FC) in the cerebellar, frontal, parietal, and temporalCitation11 areas and selectively impaired Rs-FC between the default mode network (DMN) and right anterior insulaCitation12,Citation13 and the DMN subregions.Citation14 Previous studies have shown abnormal local spontaneous activity in OSA patients using amplitude of low-frequency fluctuation (ALFF)Citation15 and regional homogeneity (ReHo) analyses,Citation16 providing an imaging indicator for assessing cognitive dysfunction in OSA patients. Previous studies demonstrated damaged gray matter concentration, regional gray matter volume, or white matter integrityCitation17,Citation18 in brain regions using diffusion tensor imaging (DTI) or voxel-based morphometry (VBM), including the bilateral anterior cingulate gyrus,Citation19 cerebellar regions,Citation20 left and right hippocampus,Citation21 superior and inferior frontal regions,Citation22 and anterior corpus callosum.Citation20 However, the brain is a complex and advanced information processing system that coordinates different functional brain regions. It is necessary to study the global topological properties of brain functional networks in OSA patients.
The human brain system has very diversified and important topological properties, such as small-world properties, high efficiency, and efficient nodes.Citation23 In graph theory, nodes and edges connecting nodes are two basic elements of a network (ie, graph), where nodes represent anatomically defined regions, and edges indicate the relationships between those nodes.Citation24 Compared with the widely used Rs-fMRI analytical methods (eg, ReHo, ALFF, Rs-FC, and independent component analysis), graph-based network analysis allows us not only to quantitatively characterize the global organization but also to visualize the overall connectivity pattern among all elements of the brain, such as brain regions. In addition, this approach offers a better understanding of topological reconfiguration of the brain,Citation25–Citation27 and it plays an indispensable role in elucidating and describing the topological properties of the structural and functional brain network systems.
Previous studies using graph-based theoretical approaches in several brain and psychiatric disorders, such as pediatric post-traumatic stress disorder,Citation26,Citation27 Alzheimer’s disease,Citation28 depression,Citation29 epilepsy,Citation30,Citation31 and schizophrenia,Citation32,Citation33 have shown that patients have alterations in topological properties of brain function. Watts and StrogatzCitation34 first proposed the small-world network (characterized by a short path length between brain regions and a high degree of clustering, with high global integration between different brain regions and high local specialization), which corresponds to an intermediate state between a random network and a regular network.Citation35 In our previous studies, OSA patients exhibited specific abnormal intrinsic functional hubs, including relatively reduced voxel-wise degree centrality (DC) in the bilateral posterior cingulate cortex, bilateral inferior parietal lobule, and left superior frontal gyrus, in response to destructive aspects and relatively increased DC in the bilateral lentiform nucleus, putamen, and bilateral cerebellum posterior lobes that are associated with functional adaptive responses.Citation36 Luo et alCitation37 constructed the structural network based on brain gray matter volume in childhood OSA patients and used graph theoretical analysis to identify alterations in topological properties, decreased local efficiency, and decreased regional properties in the right lingual gyrus, inferior frontal gyrus, and left angular gyrus. However, several questions remain: How has the efficient small-world topology of OSA patients been altered, which can be investigated using Rs-fMRI? How does OSA affect the global topological organization of functional brain networks? It is intriguing to investigate whether topological abnormalities exist in the functional brain networks of OSA patients.
We hypothesized that OSA patients may also undergo alterations in small-world topology that are relevant to consciousness disturbance and cognitive impairment, and these alterations may be related to the severity of cognitive dysfunction in OSA patients. To test our hypothesis, we constructed functional brain networks based on graph theoretical analysis in OSA patients and good sleepers (GSs) and then used graph theory analysis to investigate the topological properties of the functional brain networks of untreated male patients with severe OSA. Next, we evaluated the relationships between the topological properties and clinical and neuropsychological data.
Patients and methods
Participants
The study protocol was approved by the Human Research Ethics Committee of the First Affiliated Hospital of Nanchang University, and written informed consent was provided by all participants. A total of 30 untreated, newly diagnosed, right-handed male patients affected by severe OSA and 25 right-handed, male, education, and age-matched GSs were recruited from the Sleep Monitoring Room of the Respiratory Department at our hospital from June 2013 to December 2015. The inclusion criteria for OSA patients were as follows: 1) an apnea–hypopnea index (AHI) >30, and 2) age older than 22 years but younger than 60 years. GSs had to have an AHI <5, regular sleep–wake cycles, and normal neurological and psychiatric examinations. The exclusion criteria for both the OSA patients and GSs were as follows: 1) other sleep disorders (primary insomnia, restless legs syndrome, or a sleep-related eating disorder), 2) history of clinical injury, 3) the presence of a major cardiovascular problem, 4) a structural lesion on the brain MRI scan, 5) central nervous system disorders (head injury, psychosis, neurodegenerative diseases, hypothyroidism, epilepsy, or depressive disorder), or 6) illicit drug or alcohol abuse. Each participant underwent a detailed clinical interview, a cognitive assessment with the Epworth Sleepiness Scale (ESS), the Montreal Cognitive Assessment (MoCA) Chinese version, and overnight polysomnography (PSG).
Overnight PSG and neuropsychological assessments
All OSA patients and GSs underwent overnight PSG before the fMRI brain scan. Before the overnight PSG, each subject was asked to refrain from alcoholic or caffeinated beverages and sleep medications for at least 24 h. Overnight PSG was conducted from 10 pm to 6 am the next morning. Standard overnight PSG was performed on all patients with OSA and GSs using the Respironics LE-Series Physiological Monitoring System (Alice 5 LE; Respironics, Orlando, FL, USA) in the sleep center of our hospital. The following variables were recorded: standard electroencephalogram (EEG), electrocardiogram (ECG), electrooculogram (EOG), chin electromyogram (EMG), oral and nasal airflow, thoracic and abdominal ventilatory movements, oxygen saturation (SaO2), body posture, and snoring. The AHI was calculated as the average of the total number of hypopnea and apnea events per hour during sleep. An obstructive apnea was defined as a reduction in airflow ≥90% for more than 10 s associated with continued inspiratory effort, and hypopnea was defined as a decrease in airflow ≥30% lasting at least 10 s and accompanied by 4% or greater oxygen desaturation or with EEG arousal, according to the American Academy of Sleep Medicine guidelines.Citation38 All study data were scored by a PSG technician and reviewed by an experienced sleep medicine physician. All participants completed a self-reported sleep questionnaire using the ESS and MoCA (Chinese version) by an experienced psychologist. The ESS asks the participant to rate his/her probability of falling asleep in different situations.Citation39 ESS scores range from 0 to 24, with a score higher than 6 suggesting sleepiness, a score higher than 11 indicating excessive sleepiness, and a score higher than 16 suggesting risky sleep. The MoCA is a rapid screening assessment tool for mild cognitive impairment. It can evaluate subjects’ executive function, attention, memory, naming, calculation, language, abstraction, and orientation. The maximum possible score is 30. A score of 26 or less indicates the presence of mild cognitive impairment. When the number of years of schooling is less than 12, one point is added to adjust for educational bias.Citation40
MRI data acquisition
MRI data were obtained on a 3-T MR scanner with an eight-channel head coil (Siemens, Erlangen, Germany) in our hospital. All participants were required to relax, keep their eyes closed, and not fall asleep during the MRI scans. Earplugs and an eye patch were used to simulate a resting state. Head movement was decreased by foam pads. Data collection started with a series of localizer scans used to orient the following functional scans. Then, conventional T1-weighted imaging (repetition time [TR]=250 ms, echo time [TE]=2.46, field of view [FOV]=220×220 mm, slices=19, slice thickness=5 mm, gap=1.5 mm) and T2-weighted imaging (TR=4,000 ms, TE=113 ms, FOV=220×220 mm, slices=19, slice thickness=5 mm, gap=1.5 mm) were obtained. A total of 240 Rs-fMRI images from 30 contiguous echo-planar imaging (EPI) scans were collected axially with the following parameters: TR=2,000 ms; TE=30; flip angle=90°; FOV=230×230 mm; thickness=4.0 mm; gap=1.2 mm; acquisition matrix=64×64; and 30 axial slices. Finally, a high-resolution, three-dimensional T1-weighted anatomical image from 176 sagittal slices (TR=1,900 ms; TE=2.26 ms; flip angle=9°; FOV=250×250 mm; thickness=1.0 mm; gap=0.5 mm; matrix=256×256) was collected using a magnetization-prepared rapid gradient echo sequence.
Data preprocessing
Initially, all the conventional T1- and T2-weighted imaging was reviewed by two senior radiologists in the Department of Radiology to exclude macrostructural brain lesions. Functional images were checked using MRIcro software (www.MRIcro.com) to eliminate defective data. All of the resting-state functional images were preprocessed by DPARSFA software (http://rfmri.org/DPARSF) and Statistical Parametric Mapping (SPM8; http://www.fil.ion.ucl.ac.uk/spm), which is based on MATLAB 2010a (Mathworks, Natick, MA, USA).Citation41 Prior to preprocessing, the first 10 volumes of Rs-fMRI images were discarded to allow the participants to adapt to the scanning environment and stability magnetization. For each datum, the remnants of 230 volumes were corrected for differences in slice acquisition times using digital imaging and communications in medicine form transformation, because higher-order models benefit from the removal of head motion effects.Citation42 Based on the head motion criteria, participants were excluded if they had more than 2.0 mm of maximum displacement in any of the x, y, or z directions and 2.0° of any angular motion throughout the entire fMRI scan. None of the participants were excluded. Subsequently, all functional data were spatially normalized into standard Montreal Neurological Institute (MNI) space using an EPI template, resampled to 3×3×3 mm3 voxels, and smoothed with a 6-mm full-width at half-maximum Gaussian kernel. Finally, a temporal band-pass filter (0.01–0.08 Hz) was applied to the data to reduce the effects of low-frequency drift, high-frequency physiological respiratory and cardiac noise, and time series linear detrending. To further reduce the possible effects of confounding factors, the six Friston head motion parameters, global signal, white matter regions, and ventricular and cerebrospinal fluid were regressed from the time series of all voxels by linear regressionCitation43 and were then used for the functional brain network construction and graph theory analysis.
Brain network construction
We used GRETNA (www.nitrc.org/projects/gretna/), a graph theoretical network analysis toolbox for imaging connectomics, to construct the functional brain network.Citation44 The entire cerebral cortex was parcellated into 90 cortical and subcortical anatomically defined regions according to Automated Anatomical Labeling (AAL),Citation45 and the mean time series for each of the 90 regions was extracted. Pearson’s correlation coefficients for each pair of regions were computed for the mean time series for each of the 90 regions, and Fisher’s z transformation was performed to turn the data into a z-value that was close to a normal distribution. Then, the graphic model of the brain functional network was constructed by a binary connection matrix, which was converted by the z-values with a selected threshold of the relation matrix.
Threshold selection
To construct the undirected binarized networks and ensure that the resulting graph metrics were robust, the weights of the brain functional network must to be thresholded; however, there is no unified standard for threshold selection. Therefore, we employed sparsity (Sp, defined as the existing number of edges in a graph divided by the maximum possible number of edges) instead of correlation coefficients as the threshold metrics for all the correlation matrices in this study. At the same time, we set the sparsity at a range of network densities, across which the network topologies of the OSA and GSs groups were compared. Based on the previous studies, we set the sparsity of the brain functional network range to 10%–50%, resulting in a more efficient functional network that was more in line with the characteristics of a brain functional network than a random network,Citation35 and the number of spurious edges was minimized. Therefore, we computed the network properties over a wide range of sparsity (0.10≤ Sp ≤0.50),
where e is the existing number of edges in the network, and m is the maximum possible number of edges in the network.
Global network properties
In this study, we used the graph theory method to reflect the noninvasive characterization of the topological changes in the brain functional network and calculated the properties of the network.Citation46 Small-world network parameters, including the clustering coefficient (Cp) and the characteristic path length (Lp), can characterize small-world models and were originally proposed by Watts and Strogatz.Citation34 In this study, we employed the normalized clustering coefficient (γ), the normalized characteristic path length (λ), small-worldness (σ), and brain network efficiency (the global efficiency, Eglob, and the local efficiency, Eloc) to quantify the small-world behavior of the functional networks.
Normalized clustering coefficients, γ
The clustering coefficient (C) of a node i (Ci) is defined as the likelihood that the nearest neighbors of a given node i are connected to each other.Citation34 The clustering coefficient of a network (G) is a metric quantifying the strength of network segregation, defined by the average of the clustering coefficients across nodes in the network. The clustering coefficient (Ci) was computed as follows:
The clustering coefficient (C) is
where ki represents the number of edges connected to the node i, and wij is equal to the weight between node i and j; N represents all nodes in the network. The Cp values were further normalized, and the normalized clustering coefficients, γ = Creal/Crand, were computed.Citation47
Normalized characteristic path length, λ
The characteristic path length is the most commonly used measure of network information integration (a shorter Lp indicates stronger potential integration),Citation24 and it is quantified as the average of the shortest path length between all pairs of nodes in the network:
where N is the number of nodes in the network, and Lij is the shortest path length between nodes i and j in a network G. The Lp values were further normalized, and the normalized characteristic path length, λ = Lreal/Lrand, was computed.
Small-worldness, σ
If a network has a much higher Cp and a similar Lp compared with 100 matched random networks, then it can be summarized as a small-world network.Citation48 The small-worldness, σ = γ/λ, is typically >1 for small-world networks.Citation34
Small-world efficiency
Brain functional networks have economical small-world properties that support the efficient transfer of parallel information at relatively low cost.Citation35 The network efficiency represents the capacity to exchange parallel information. The global efficiency (Eglob) in a network is defined by the mean shortest path length,Citation49 which can be measured as follows:
where Lij is the shortest path length between node i and node j in G, and N represents all nodes in the network.
The local efficiency of G, defined as the average of the efficiency E(Gi) across all subgraphs included in the entire network, was computed asCitation49
where Eglob (Gi) is the global efficiency of Gi, the subgraph of the neighbors of node i.
Statistical analysis
The demographic and clinical characteristics of the OSA patients and GSs were analyzed by independent two-sample t-tests (significance set at P<0.05) using IBM Statistical Package for the Social Sciences 19.0 software (IBM SPSS Inc., Chicago, IL, USA). Over a wide range of sparsity values, the following brain network metrics were quantified using GRETNA, including γ, λ, σ, Eglob, and Eloc, which were calculated in both the OSA and GS groups. We performed statistical comparisons of topological measures between the two groups using a two-sample t-test (P<0.05) for each value. We investigated the relationship between properties (γ, λ, and σ) of the brain functional networks and clinical and neuropsychological assessments (AHI and ESS) in patients with OSA using a linear correlation analysis over the sparsity range in which the small-world property was statistically significant. P<0.05 was considered statistically significant.
Results
Demographic and clinical characteristics
As shown in , the patients with OSA had significantly higher scores for body mass index (BMI; t=6.57, P<0.001), AHI (t=15.59, P<0.001), SaO2 <90% (t=7.51, P<0.001), arousal index (AI; t=7.76, P<0.001), stage 1 of non-rapid eye movement sleep (t=6.10, P<0.001), and ESS (t=8.90, P<0.001) but significantly lower scores for rapid eye movement (REM) sleep (t=−8.03, P<0.001) and MoCA (t=−5.09, P=0.036) than the GSs. There were no significant differences in age (t=0.591) or education (t=0.182) between the patients with OSA and the GSs.
Table 1 Demographic and clinical characteristics of OSA patients and GSs
Change in brain functional network topological properties
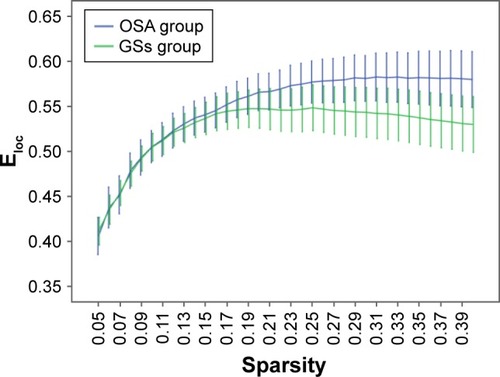
Over the sparsity range of 0.05–0.40 (step =0.01), both the OSA and GS groups exhibited high-efficiency small-world topology (γ = Cp/Cr >1, and λ = Lp/Lr ≈1). Compared with the GSs, the γ of the OSA group was significantly decreased (P<0.05, ), whereas the λ of the OSA group was significantly increased (P<0.05, ). The σ of the OSA group was significantly decreased (P<0.05, ). Eglob of the OSA group was significantly lower than that of the GS group at the sparsity range of 0.09–0.15 (P<0.05, ). Eloc of the OSA group was significantly higher than that of the GS group in the sparsity range of 0.23–0.40 (P<0.05, ).
Figure 1 Comparison of brain functional network γ values between the OSA group and GSs at a sparsity range of 0.05–0.40.
Abbreviations: OSA, obstructive sleep apnea; GSs, good sleepers.
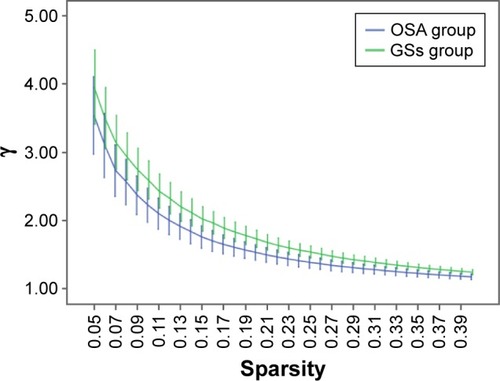
Figure 2 Comparison of brain functional network λ values between the OSA group and GSs at a sparsity range of 0.05–0.40.
Abbreviations: GSs, good sleepers; OSA, obstructive sleep apnea.
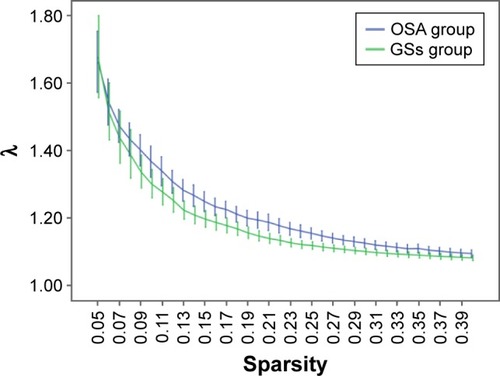
Figure 3 Comparison of brain functional network σ values between the OSA group and GSs at a sparsity range of 0.05–0.40.
Abbreviations: GSs, good sleepers; OSA, obstructive sleep apnea.
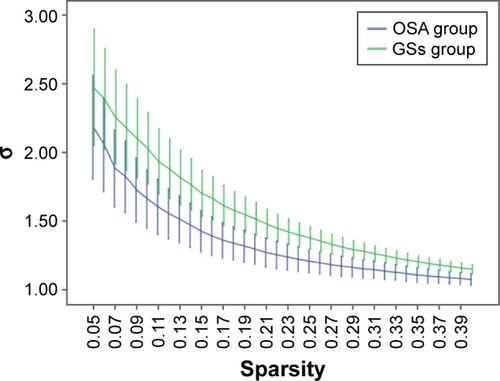
Figure 4 Comparison of brain functional network Eglob values between the OSA group and GSs at a sparsity range of 0.05–0.40.
Abbreviations: GSs, good sleepers; OSA, obstructive sleep apnea.
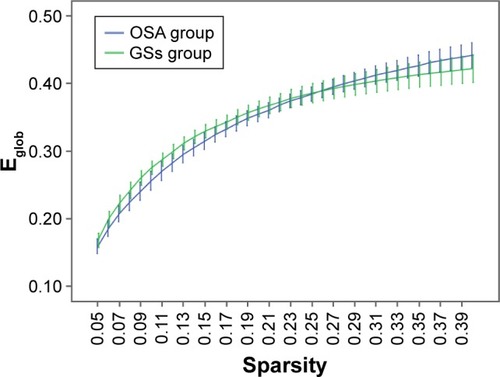
Figure 5 Comparison of brain functional network Eloc values between the OSA group and GSs at a sparsity range of 0.05–0.40.
Abbreviations: GSs, good sleepers; OSA, obstructive sleep apnea.
Relationships between network properties and clinical variables
As shown in , when the sparsity was 0.25, the difference in σ between the OSA patients and GSs was the greatest. In the OSA group and the normal control group, the differences in the small-world characteristics were greater under the condition of a sparsity of 0.25. Therefore, we chose the three statistical characteristics (γ, λ, and σ) under the condition of a sparsity of 0.25 for the correlation analysis with AHI and ESS. We found that in OSA patients, γ was significantly negatively correlated with AHI (r=−0.326, P=0.015) and ESS (r=−0.274, P=0.043), λ was significantly positively correlated with AHI (r=0.373, P=0.005) and ESS (r=0.269, P=0.047), and σ was significantly negatively correlated with AHI (r=−0.363, P=0.007) and ESS (r=−0.295, P=0.029) at a sparsity of 0.25 ().
Figure 6 Correlations between three statistical characteristics of the brain functional network of OSA patients and the AHI and ESS score.
Abbreviations: AHI, apnea–hypopnea index; ESS, Epworth Sleepiness Scale; OSA, obstructive sleep apnea.
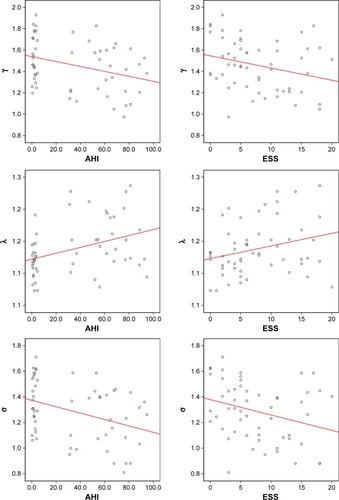
Table 2 P-values of three statistical comparisons between OSA patients and GSs with two-sample t-tests
Discussion
In our study, the small-world network of OSA patients and GSs was constructed respectively, and then we used graph-based theoretical approaches to analyze the small-world topology based on Rs-fMRI in untreated male patients with severe OSA. The results revealed that both the OSA patients and GSs exhibited efficient small-world networks; however, individuals with OSA had a decreased normalized clustering coefficient (γ), small-worldness (σ), and global efficiency (Eglob) and an increased normalized shortest path length (λ) and local efficiency (Eloc), which implies a disturbance in the global integration of the functional brain network. Furthermore, we found that some key abnormalities in small-world network properties were related to clinical variables as follows: γ was negatively correlated with AHI and ESS, λ was positively correlated with AHI and ESS, and σ was significantly negatively correlated with AHI and ESS. The key question is what these abnormalities mean and how they affect brain function.
Previous brain Rs-MRI studies in OSA patients have revealed alterations in cerebellar, frontal, parietal, temporal, thalamic, middle and dorsal prefrontal cortex, left precentral gyrus, and posterior cingulate cortex regions.Citation11–Citation13,Citation16 OSA patients have abnormal Rs-FC in various brain regions that are related to affective, autonomic, sensorimotor, executive, and cognitive regulatory functions.Citation11 However, previous studies were limited to individual brain regions, functionally defined subnetworks, local FC, or independent component analysis,Citation1,Citation13 which cannot directly demonstrate important topological changes in whole-brain functional networks in OSA patients. The key question in this study was how OSA affects the topological properties of brain functional networks as well as the relationships between brain network properties and clinical and neuropsychological data.
Previous studies have demonstrated that sex differences, obesity, depression, and anxiety may affect resting-state brain activity.Citation50,Citation51 Sforza et alCitation52 found that female OSA patients exhibited a lower AHI, had less severe hypoxia, and frequently reported depression and anxiety, while being male is a major risk factor for OSA. Thus, only untreated male patients with severe OSA were recruited for our study, which could rule out potential confounders of sex differences,Citation53 depression and anxiety, severity, and treatment to improve the credibility of the results. The AHI, as a means of measuring disease severity in OSA patients, is widely used as a reference in resting-state brain activity studies with OSA patients.Citation14 Increased daytime sleepiness, which is a common feature of OSA, may affect the brain functional network. Previous studies have shown that the Rs-FC changes in patients with OSA were specific not to excessive sleepiness but to OSA itself.Citation12,Citation13 The ESSCitation54 is a useful questionnaire for measuring the general level of daytime sleepiness, which can estimate the probability of falling asleep in many situations: the ESS score increased with increased OSA severity. In this study, we evaluated the relationships between the γ, λ, and σ properties of brain functional networks and AHI and ESS using a linear correlation analysis to determine the relationships between topological properties and clinical neuropsychological data.
Human brain information processing is divided into functional separation and functional integration. Functional separation refers to the fact that a task is divided into several components and then distributed to the various functional areas. Functional integration is the implementation of each functional area, and the results are then integrated and fed back to the cerebral center.Citation55 Neural systems have the characteristics of a network, and these characteristics are consistent not with a rules network or random network, but with a small-world network. The small-world network is a crucially optimized network model used to describe the organizing principles that govern a wide variety of complex economic, social, and biological networks.Citation34 Small-world networks have both the shortest path length, similar to those of random networks, and a high clustering coefficient, which resembles regular networks, ensuring highly efficient information processing at the local and global levels.Citation23 A small-world network can be described by high local clustering and a low shortest path length between any pair of nodes.Citation34 In our study, both the OSA patients and GSs exhibited high-efficiency small-world topology (γ = Cp/Cr >1, and λ = Lp/Lr ≈1) according to previous studies,Citation37 but the decreased σ was found in the OSA patients. In addition, σ was significantly negatively correlated with the ESS and AHI. It is generally accepted that the integration and transmission of information are the basis of cognitive processing. Small-worldness, as measured by σ, essentially reflects the balance of differentiation and integration in a network. The current results may reflect the imbalance of differentiation and integration in the brain networks of OSA patients. Thus, it was further confirmed that OSA would interfere with neural network structure and cognitive and emotional processing in untreated male patients with severe OSA, also indicating that σ could be used as a quantitative, physiological index for auxiliary clinical diagnosis.
Our results showed an increased λ in OSA patients, and λ was positively correlated with AHI and ESS. According to previous studies, Lp represents the long-distance connection property of the network and measures the information transmission capacity of the network.Citation24 Thus, the current results indicated that as the long-distance connectivity of OSA patients decreased, the information transmission capacity of the network declined and the global features of the network were reduced. The transmission and integration of normal, long-distance information between different functional areas may be impeded. Our results showed decreased γ values in OSA patients, and γ was negatively correlated with AHI and ESS, indicating that the network connectivity of OSA patients was decreased and the degree of the network colony was decreased. This result reflected the decline in functional differentiation in the entire brain, suggesting that highly localized integrity and the integrity of the brain connections in OSA patients may be impaired.
Eglob is a measure of the rate of network information transmission, representing the capacity for information exchange.Citation24,Citation49 Our study revealed decreased Eglob in OSA patients, suggesting that OSA patients have a reduced capacity for information integration between distant brain regions and reduced efficiency of information dissemination in the global network. These results indicate that the topological properties of small-world networks in patients with OSA are significantly altered, which may lead to cognitive deficits in their daily lives, such as executive function decline, impaired attention, decreased vigilance, and motor coordination dysfunction. Using transcranial magnetic stimulation, Lanza et alCitation56,Citation57 found that OSA patients showed slower cortical–spinal system conductivity and hypoexcitability of cortical motor areas than GSs and patients with other sleep-related disorders (eg, restless legs syndrome). They also found that OSA patients exhibited global hypoexcitability of the stimulated cortex and slower central motor conductivity, which is in line with the results of the current study. Moreover, previous studiesCitation13 revealed a significant reduction in FC within the network of the posterior DMN, the right frontoparietal network, and the sensorimotor network in OSA patients.
Eloc represents the ability to exchange information only within the neighbors of a given node in a network, reflecting the capacity to pass information through the network and the tolerance of the network to faults.Citation24,Citation49 Our results showed increased Eloc in the brain network in the OSA group, although the Eglob in OSA patients was reduced, which may indicate that although the efficiency of global information processing in OSA patients is reduced, the efficiency of local brain region function compensates for this reduction.
Thus, the current results may suggest a disrupted network architecture in OSA patients characterized by higher levels of vulnerability in the brain and a decreased capacity of the whole network for regional information processing.Citation37 The small-world model reflects an optimal balance of local dissociation and global brain integration. In addition, compared with a small-world network, a random network has fewer modular information processing nodes and less default storage.Citation49 Our results suggest that an obstacle to the balance of the brain functional network exists in OSA patients.
Limitations
In this study, the altered small-world properties of OSA patients were revealed by graph theory, but there are several limitations that should be addressed. First, this study included only adult males with severe OSA. However, OSA is present not only in adult males but also in women and children, and patients with mild-to-moderate OSA were not included in this study. Thus, future investigations with different populations and different OSA severities are still needed. Second, the small sample size in this study may affect confidence in the results, and more data must be collected for further analysis. Third, we explored only the global topological properties of the brain small-world networks in this study. We plan to explore the functional network changes in specific brain regions in OSA patients from different nodes in future studies. Fourth, the AAL template was used to construct the brain functional network in this study. Because of the low resolution of the template, a finer and more complex template should be constructed in a future study. Fifth, we only used MoCA to estimate the cognitive function of OSA patients, a more detailed neuropsychological assessment questionnaire probing different cognitive abilities and domains must be used to disclose more interesting data for further analysis. Finally, although none of the OSA patients in our study had a depression or anxiety disorder, we did not conduct an emotional evaluation. Previous studies have reported that OSA was related to anxiety and depression,Citation58 which may affect the topological properties of the brain functional network.
Conclusion
In our study, graph-based theoretical approaches were applied to investigate altered small-world topology based on Rs-fMRI in OSA patients. We found that OSA patients exhibited an efficient small-world network, but the σ was significantly decreased. Individuals with OSA exhibited a decreased γ and Eglob and an increased λ and Eloc. Furthermore, γ was negatively correlated with AHI and ESS, λ was positively correlated with AHI and ESS, and σ was significantly negatively correlated with AHI and ESS, which revealed the relationships between small-world network properties and clinical variables. We speculate that the high degree of local integration and integrity of the brain connections in OSA patients may be disrupted, and the transmission and integration of long-distance information may be hampered in different brain functional areas. The differentiation and integration of brain networks in patients with OSA are imbalanced, suggesting that these may be the mechanisms of cognitive impairment in patients with OSA. In addition, σ, γ, and λ could be used as quantitative physiological indexes for auxiliary clinical diagnoses.
Acknowledgments
This work was supported by the Education Department Foundation of Jiangxi, China (Grant No 700544006), Natural Science Foundation of China (Grant No 81560285), the Graduate Innovation Foundation of Jiangxi, China (Grant No YC2016-S100), the Natural Science Foundation Project of Jiangxi, China (Grant No 20132BAB205100), the Science and Technology Support Program of Jiangxi, China (Grant Nos 20132BBG70061 and 20141BBG70026), and the Doctoral Project Startup Fund (Grant No 700544005). MRI data were collected by Cheng-Long Ye and Hong-Hui Yu.
Disclosure
The authors report no conflicts of interest in this work.
References
- FranklinKALindbergEObstructive sleep apnea is a common disorder in the population-a review on the epidemiology of sleep apneaJ Thorac Dis2015781311132226380759
- DuránJEsnaolaSRubioRObstructive sleep apnea–hypopnea and related clinical features in a population-based sample of subjects aged 30 to 70 yrAm J Respir Crit Care Med2001163368568911254524
- ShenJBarberaJShapiroCMDistinguishing sleepiness and fatigue: focus on definition and measurementSleep Med Rev2006101637616376590
- BonsignoreMRLévyPEckelJSleep, sleep-disordered breathing and metabolic consequencesEur Respir J200934124326019567607
- SomersVKWhiteDPAminRSleep apnea and cardiovascular disease: an American heart Association/American College of Cardiology Foundation Scientific Statement from the American Heart Association Council for High Blood Pressure Research Professional Education Committee, Council on Clinical Cardiology, Stroke Council, and Council on Cardiovascular Nursing in Collaboration with the National Heart, Lung, and Blood Institute National Center on Sleep Disorders Research (National Institutes of Health)J Am Coll Cardiol200852868671718702977
- EnglemanHMDouglasNJSleep 4: sleepiness, cognitive function, and quality of life in obstructive sleep apnoea/hypopnoea syndromeThorax200459761862215223874
- RedlineSYenokyanGGottliebDJObstructive sleep apnea–hypopnea and incident stroke: the Sleep Heart Health StudyAm J Respir Crit Care Med20111837950
- Ancoli-IsraelSKripkeDFKlauberMRMorbidity, mortality and sleep-disordered breathing in community dwelling elderlySleep19961942772828776783
- Ferini-StrambiLBaiettoCDiGMCognitive dysfunction in patients with obstructive sleep apnea (OSA): partial reversibility after continuous positive airway pressure (CPAP)Brain Res Bull20036118712788211
- SaunamäkiTJehkonenMA review of executive functions in obstructive sleep apnea syndromeActa Neurol Scand2007115111117156260
- ParkBPalomaresJAWooMADisrupted functional brain network organization in patients with obstructive sleep apneaBrain Behav201663e0044127099802
- ZhangQQinWHeXFunctional disconnection of the right anterior insula in obstructive sleep apneaSleep Med20151691062107026298780
- ZhangQWangDQinWAltered resting-state brain activity in obstructive sleep apneaSleep201336565123633747
- LiHJNieXGongHHZhangWNieSPengDCAbnormal resting-state functional connectivity within the default mode network subregions in male patients with obstructive sleep apneaNeuropsychiatr Dis Treat20161220321226855576
- LiHDaiXGongHNieXZhangWPengDAberrant spontaneous low-frequency brain activity in male patients with severe obstructive sleep apnea revealed by resting-state functional MRINeuropsychiatr Dis Treat20151120721425653530
- PengDCDaiXJGongHHLiHJNieXZhangWAltered intrinsic regional brain activity in male patients with severe obstructive sleep apnea: a resting-state functional magnetic resonance imaging studyNeuropsychiatr Dis Treat2014101819182625278755
- XiongYZhouXJNisiRABrain white matter changes in CPAP-treated obstructive sleep apnea patients with residual sleepinessJ Magn Reson Imaging20174551371137827625326
- CastronovoVScifoPCastellanoAWhite matter integrity in obstructive sleep apnea before and after treatmentSleep20143791465147525142557
- ZhangXQLuBXLiTPCorrelation between white matter lesion and memory impairment in patients with obstructive sleep apnea syndromeNan Fang Yi Ke Da Xue Xue Bao200929482582919403429
- MaceyPMKumarRWooMAValladaresEMYangoFLHarperRMBrain structural changes in obstructive sleep apneaSleep200831796718652092
- TorelliFMoscufoNGarreffaGCognitive profile and brain morphological changes in obstructive sleep apneaNeuroimage201154278779320888921
- TummalaSRoyBParkBAssociations between brain white matter integrity and disease severity in obstructive sleep apneaJ Neurosci Res2016941091592327315771
- BullmoreESpornsOComplex brain networks: graph theoretical analysis of structural and functional systemsNat Rev Neurosci200910318619190637
- RubinovMSpornsOComplex network measures of brain connectivity: uses and interpretationsNeuroimage20105231059106919819337
- YeMYangTPengQXuLJiangQLiuGChanges of functional brain networks in major depressive disorder: a graph theoretical analysis of resting-state fMRIPLoS One2015109e133775
- SuoXLeiDChenFAnatomic insights into disrupted small-world networks in pediatric posttraumatic stress disorderRadiology2017282382683427779449
- SuoXLeiDLiKDisrupted brain network topology in pediatric posttraumatic stress disorder: a resting-state fMRI studyHum Brain Mapp2015369367726096541
- JohnMIkutaTFerbinteanuJGraph analysis of structural brain networks in Alzheimer’s disease: beyond small world propertiesBrain Struct Funct2017222292394227357309
- LiWDouglasWBLiuXDisrupted small world topology and modular organisation of functional networks in late-life depression with and without amnestic mild cognitive impairmentJ Neurol Neurosurg Psychiatry20148610109725433036
- XuYQiuSWangJDisrupted topological properties of brain white matter networks in left temporal lobe epilepsy: a diffusion tensor imaging studyNeuroscience201427915516725194789
- BernhardtBCHongSJBernasconiABernasconiNImaging structural and functional brain networks in temporal lobe epilepsyFront Hum Neurosci20137562424098281
- YuQSuiJRachakondaSAltered topological properties of functional network connectivity in schizophrenia during resting state: a small-world brain network studyPLoS One201169e2542321980454
- WangQSuTPZhouYAnatomical insights into disrupted small-world networks in schizophreniaNeuroimage2012592108521963918
- WattsDJStrogatzSHCollective dynamics of ‘small-world’ networksNature199839366844404429623998
- AchardSBullmoreEEfficiency and cost of economical brain functional networksPLoS Comput Biol200732e1717274684
- LiHLiLShaoYAbnormal intrinsic functional hubs in severe male obstructive sleep apnea: evidence from a voxel-wise degree centrality analysisPLoS One20161110e164031
- LuoYWangDLiuKBrain structure network analysis in patients with obstructive sleep apneaPLoS One2015109e139055
- BerryRBBudhirajaRGottliebDJRules for scoring respiratory events in sleep: update of the 2007 AASM manual for the scoring of sleep and associated eventsJ Clin Sleep Med20128559761923066376
- BillingsMERosenCLAuckleyDPsychometric performance and responsiveness of the functional outcomes of sleep questionnaire and sleep apnea quality of life instrument in a randomized trial: the HomePAP StudySleep20143712201725325491
- NasreddineZSPhillipsNABédirianVThe Montreal Cognitive Assessment, MoCA: a brief screening tool for mild cognitive impairmentJ Am Geriatr Soc200553469515817019
- YanCGWangXDZuoXNZangYFDPABI: data processing & analysis for (resting-state) brain imagingNeuroinformatics201614333935127075850
- YanCGCheungBKellyCA comprehensive assessment of regional variation in the impact of head micromovements on functional connectomicsNeuroimage20137618320123499792
- YanCGCraddockRCHeYMilhamMPAddressing head motion dependencies for small-world topologies in functional connectomicsFront Hum Neurosci2013791091024421764
- WangJWangXXiaMCorrigendum: GRETNA: a graph theoretical network analysis toolbox for imaging connectomicsFrontiers in Human Neuroscience20149386386
- TzouriomazoyerNLandeauBPapathanassiouDAutomated anatomical labeling of activations in SPM using a macroscopic anatomical parcellation of the MNI MRI single-subject brainNeuroimage200215127311771995
- HeYChenZJEvansACSmall-world anatomical networks in the human brain revealed by cortical thickness from MRICereb Cortex200717102407241917204824
- ZhuMCaoTJiangXUsing clustering coefficient to construct weighted networks for supervised link predictionSoc Netw Anal Min20144118
- ZhongZZhaoTLuoJAbnormal topological organization in white matter structural networks revealed by diffusion tensor tractography in unmedicated patients with obsessive-compulsive disorderProg Neuropsychopharmacol Biol Psychiatry2014519395024440373
- LatoraVMarchioriMEfficient behavior of small-world networksPhys Rev Lett2001871919870111690461
- DaiXJNieXLiuXGender differences in regional brain activity in patients with chronic primary insomnia: evidence from a resting-state fMRI studyJ Clin Sleep Med201612336337426715399
- OathesDJPatenaudeBSchatzbergAFEtkinANeurobiological signatures of anxiety and depression in resting-state fMRIBiol Psychiatry201477438539325444162
- SforzaEChouchouFColletPPichotVBarthélémyJCRocheFSex differences in obstructive sleep apnoea in an elderly French populationEur Respir J2011375113720817711
- MaceyPMKumarRYan-GoFLWooMAHarperRMSex differences in white matter alterations accompanying obstructive sleep apneaSleep201235121603161323204603
- JohnsMWDaytime sleepiness, snoring, and obstructive sleep apnea. The Epworth Sleepiness ScaleChest1993103130368417909
- AlbertRJeongHBarabasiALError and attack tolerance of complex networksNature2000406679437838210935628
- LanzaGCantoneMLanuzzaBDistinctive patterns of cortical excitability to transcranial magnetic stimulation in obstructive sleep apnea syndrome, restless legs syndrome, insomnia, and sleep deprivationSleep Med Rev201519395024849846
- LanzaGLanuzzaBAricòDDirect comparison of cortical excitability to transcranial magnetic stimulation in obstructive sleep apnea syndrome and restless legs syndromeSleep Med201416113814225534710
- MaceyPMWooMAKumarRCrossRLHarperRMRelationship between obstructive sleep apnea severity and sleep, depression and anxiety symptoms in newly-diagnosed patientsPLoS One201054e1021120419135