
Abstract
Background
Efficient screening for depression is important in community mental health. In this study, we applied a stratum-specific likelihood ratio (SSLR) analysis, which is independent of the prevalence of the target disease, to screen for depression among community-dwelling individuals.
Method
The Center for Epidemiologic Studies Depression Scale (CES-D) and the Mini International Neuropsychiatric Interview (MINI) were administered to 789 individuals (19–87 years of age) who participated in the Iwaki Health Promotion Project 2011. Major depressive disorder (MDD) was assessed using the MINI.
Results
For MDD, the SSLRs were 0.13 (95% CI 0.04–0.40), 3.68 (95% CI 1.37–9.89), and 24.77 (95% CI 14.97–40.98) for CES–D scores of 0–16, 17–20, and above 21, respectively.
Conclusion
The validity of the CES-D is confirmed, and SSLR analysis is recommended for its practical value for the detection of individuals with the risk of MDD in the Japanese community.
Introduction
Major depression is a serious, recurrent mental disorder with high lifetime prevalence worldwide.Citation1 Major depressive disorder (MDD) constitutes a crucial public health burden. In Japan, MDD has a lifetime prevalence of 6.2% and a 12-month prevalence of 2.2%, is more prevalent among females than among males.Citation2 The World Health Organization has projected that MDD will become the number one leading cause of worldwide disability-adjusted life-years (DALYs) by 2020.Citation3
More than 90% of suicide victims were retrospectively diagnosed with a psychiatric problem at their time of committing suicide, and approximately two-thirds of suicide victims were diagnosed with depression.Citation4,Citation5 Prior studies have identified depression as the major risk factor for suicidal ideation, suicide attempts, and successful suicides.Citation6–Citation8 Given the strong relationship between suicidal behavior and depression, screening for and treating depressive disorder have been proposed as one approach to prevent suicide.Citation9
The Center for Epidemiologic Studies Depression Scale (CES-D) is a relatively simple and quick assessment that is inexpensive to administer and nonhazardous to patients; thus, this scale is acceptable for screening a large population.Citation10 Shima et alCitation11 first reported the clinical validity of the CES-D Japanese translation and its standard cutoff point of 15/16. Subsequently, other studies from Japan have supported this finding and shown a good level of criterion-related validity and internal reliability in a sample of Japanese workers.Citation12,Citation13 Although continuous CES-D scores are informative, interpreting screening results by utilizing score categories high predictive values with respect to the administration of efficient interventions is a convenient method.
Stratum-specific likelihood ratios (SSLRs) could be used to obtain such categories.Citation14 The likelihood ratio (LR) provides a direct estimate of how much a test result will change the odds of having a disease and incorporates both the sensitivity and specificity of the test.Citation15 SSLRs are calculated by dividing the continuous likelihood ratios into strata.Citation16 However, reports regarding the use of SSLR analysis to screen for depressive disorders with the CES-D among community populations.Citation17,Citation18
The objective of this study was to determine the CES-D score categories that have predictive clinical value for community-based screening for depression.
Method
Participants
The subjects were 789 volunteers (19–87 years of age, 289 males and 500 females) who participated in the Iwaki Health Promotion Project 2011.Citation19 These individuals were residents of the Iwaki district, which is a rural area of the city of Hirosaki, in northern Japan. Iwaki is a stable community with a population of 11,863 individuals. The mean age of the participants was 57.8 years (with SD of 11.4 years and a range of 19–87 years). The data collection procedures for this study were approved by the ethics committee of the Hirosaki University School of Medicine, and all subjects provided written informed consent before participating in this project. Demographic data (age and gender) were obtained from self-reported questionnaires and interviews.
Procedure
The Japanese version of the CES-D was administered to all participants to measure depressive symptoms.Citation10,Citation20 The CES-D is a 20-item, self-reported measure that focuses on depressive symptoms during the week prior to the administration of the questionnaire. The maximum score on this scale is 60, and a CES-D score of 16 or more is regarded as indicative of the presence of depression.
The Mini International Neuropsychiatric Interview (MINI) is a short, structured diagnostic interview for psychiatric disorders in the Diagnostic and Statistical Manual of Mental Disorders, Fourth Edition (DSM-IV) and the International Statistical Classification of Diseases and Related Health Problems, Tenth Revision (ICD-10).Citation21,Citation22 In this study, we applied the portion of the MINI that is used to identify a major depressive episode. Among participants who responded “Yes” to A1 (depressed mood) and/or A2 (loss of interest), MDD was defined as a score of ≥5 on this portion of the major depressive episode section of the MINI.
Statistical analysis
The sensitivity, specificity, positive predictive value, and negative predictive value were calculated for several cutoff scores, as well as for the traditional cutoff score of 16 on the CES-D scale. Receiver operating characteristic (ROC) analysis was performed, with the true-positive rate (sensitivity) plotted on the vertical axis and the false-positive rate (1 – specificity) plotted on the horizontal axis; this approach allows display of all pairs of sensitivity and specificity values achievable as the threshold is changed from a low score to a high score.Citation23 The area under the curve (AUC) can be used as a quantitative indicator of the information content of a test. An AUC of 1.0 indicates perfect accuracy, whereas an AUC of 0.5 indicates a nondiscriminating test. The software used for the ROC analysis was Statistical Package for the Social Sciences (SPSS), version 24. The ROC curve is also used to determine the score that maximizes a screening test’s efficacy. The point on the ROC curve with the shortest distance to the intersection of the sensitivity and 1 – specificity values on the ROC graph is defined to be the optimal cutoff score.
We computed the SSLRs and 95% CIs using a program developed by Peirce and Cornell.Citation24 An SSLR indicates how much more likely or less likely a specific test result is for individuals with a disease than for individuals without this disease; thus, this ratio could reveal the efficiency of a screening test. LRs >10 and <0.1 indicate strong evidence for diagnosis and exclusion of diseases in clinical practice, respectively.Citation14 To achieve the optimum number of strata, we followed the rules proposed by previous studiesCitation24,Citation25 as follows: 1) provide sufficient disordered and nondisordered subjects in each stratum to allow the SSLRs to be monotonically related; and 2) collapse strata where the SSLRs are close to one another and their 95% CIs easily overlap.
Logistic regression models were used to test whether the strata provided significantly more information than a single cutoff point.Citation26 First, a logistic regression model with a dichotomous predictor was fitted. Then, a second model with the same dichotomous predictor and the stratum as the categorical predictor was fitted. The difference between these two values was analyzed using the chi-square statistic under the null hypothesis that the strata predictor did not add more predictive ability than the single cutoff point.
Results
The overall scale was found to be reliable (alpha =0.77), and 12% (95/789) of the participants had a CES-D score of at least 16.
The sensitivities, specificities, positive predictive values, and negative predictive values are presented in . The ROC curve for the CES-D is depicted in . The cutoff value, which was determined based on the shortest distance between any point on the ROC curve and the upper left intersection of the sensitivity and 1 – specificity values on the ROC graph, was 16. The AUC calculated using the ROC analysis was 0.98 (95% CI 0.96–1.00; p<0.001).
Figure 1 ROC curve for depressive disorder determined using the MINI and the CES-D.
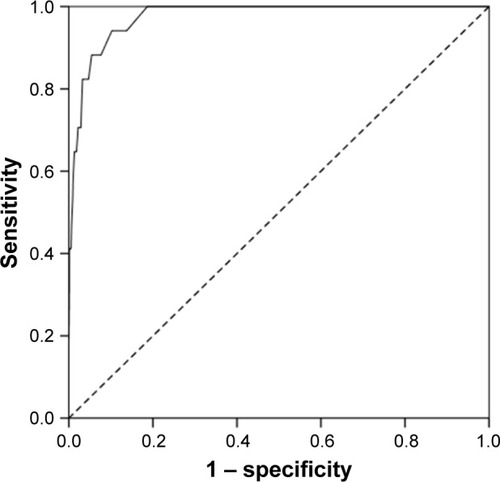
Table 1 Sensitivity, specificity, and positive and negative predictive values of the CES-D
The SSLR analysis results are indicated in . The recommended SSLRs determined for MDD were 0.13 (95% CI 0.04–0.40), 3.68 (95% CI 1.37–9.89), and 24.77 (95% CI 14.97–40.98) for CES–D scores of 0–16, 17–20, and 21–60, respectively. Given the prior probability of the base rate of MDD used in the present study (2.1%), CES-D scores falling in the range of 0–16 had an SSLR <1.0 and thus shifted the posttest probability of having that disorder to a very low level (0.29%).
Table 2 SSLRs obtained for MDD in this study
For MDD, the −2⋅log LR for the model with a single cutoff point (cutoff of 15/16) was 101.2. The −2⋅log LR for the model with the stratum as a categorical predictor was 93.0. The difference between these two values was 8.3. The corresponding p-value was small (p=0.004), indicating significant improvement when the stratum for MDD was used.
Discussion
Our results in which the CES-D had an AUC value of 0.98 demonstrated that this scale had high validity for the detection of MDD evaluated by the MINI in a community-dwelling population. Furthermore, a score of 16, which is traditionally used as the cutoff score, exhibited the highest total sensitivity and specificity (0.941 and 0.898, respectively). However, the positive predictive value (0.168) for this cutoff, which depends on the prevalence of the examined disease, indicates that many of the positive results obtained using this testing procedure are false positives. Given the prevalence of depression in prior community-based studies,Citation2,Citation9 measures that are independent of the prevalence are needed for community-based screening.
In this study, we utilized the SSLR approach, which is independent of the target disease prevalence, and obtained three CES-D strata. By accounting for an individual’s prior probability, this approach could provide a basis to calculate the posttest probability in each specific stratum. Our results demonstrated that higher CES-D scores were associated with higher risks of MDD. Individuals with a CES-D score of 21 or greater had an SSLR that was significantly >10. Relative to the other categories, these score categories will provide primary care physicians and psychiatrists with greater opportunities to detect individuals with MDD via further investigation following screening using the CES-D.
A prior study conducted in first-visit psychiatric patients aged 36.9±16.0 (mean ± SD) years classified CES-D scores into three strata of <29, 30–49, and >50; the SSLRs for these three strata were 0.35 (95% CI 0.25–0.49), 2.3 (95% CI 1.8–3.1), and 11.7 (95% CI 3.1–44.0), respectively.Citation25 Another study conducted in Japan identified three strata <16, 17–19, and >20 for working individuals aged 42.0±11.4 (mean ± SD) years; the SSLRs for these three strata were 0.06 (95% CI 0.02–0.18), 1.9 (95% CI 1.78–4.62), and 12.4 (95% CI 10.2–15.1), respectively.Citation17 However, an imbalanced gender ratio in that study (males: n=1,868 and females: n=351) may have influenced the results. Among Taiwanese adolescents aged 12–16 years, Yang et alCitation18 showed three strata of <28, 29–48, and >49. The SSLRs for these three strata were 0.63 (95% CI 0.42–0.92), 4.0 (95% CI 2.4–6.8), and 11.8 (95% CI 3.4–50.9), respectively. These studies differed in the mean age, gender ratio, and setting (clinical or community), which might have affected the depressive symptomatology. Furthermore, differences concerning the assessment of depressive disorder (DSM-III-R or Kiddie Schedule for Affective Disorders and Schizophrenia [K-SADS]) could affect the CES-D score categories. Although differences among the score categories have been identified to date, understanding the existence of a dose-dependent relationship between the CES-D score and the risk of MDD. Compared with previous studies, our score categories of the CES-D might be useful for screening the older population in a community for depression.Citation17,Citation18,Citation25
We must consider the interpretation of the false-positive results obtained when screening using the CES-D. Prior studies have found poor positive predictive power associated with using the CES-D to screen for depression.Citation27,Citation28 False positives might be induced by active medical conditions, alcohol-related disorders, and/or dysthymia.Citation29 Although individuals with false-positive results do not satisfy the criteria for MDD, they could benefit from follow-up with primary care physicians or psychiatrists. We should also consider false-negative cases. Individuals who were afraid of being diagnosed with MDD or who were unaware of their illness might not express their symptoms during the screening process.Citation30 An objective biomarker for diagnosing MDD is needed to identify these individuals.
Although screening for depression is important, it is also necessary to provide consistent treatment and follow-up. Merely identifying individuals with depression would not be beneficial. Furthermore, recent evidence has raised questions regarding the degree to which standard treatments for depression benefit patients who are identified via screening.Citation31 A meta-analysis reported that the benefits of antidepressant medication compared with those of a placebo were minimal or nonexistent in patients with mild or moderate depressive symptoms.Citation32,Citation33 Therefore, a combination of prompt detection and treatment appropriate for the symptom severity is needed for effective community-based screening for depression.
This study has certain limitations. First, all of the participants were volunteers who were interested in their health and may therefore have been healthier than the general population. Thus, the community members who were not included in the study may have experienced different depressive symptoms than the study participants. This type of “selection bias” must be considered in studies of community populations. Second, our participants may not be representative of all Japanese community populations because our study was conducted only in a rural district. Even if the prevalence of depression does not differ across communities, certain risk factors could differ among different populations.Citation34
Conclusion
The CES-D exhibited good validity, and a score of 16 is the optimal cutoff score for assessment of MDD in a community population. Moreover, the use of SSLRs could be a convenient and intuitive measure for understanding the results of community-based screening for depression. Programs combining sequential screening for depression and feedback with adequate support are recommended.
Acknowledgments
The authors thank all of their colleagues in this study for their skillful contributions to the collection and management of the data. Funding for this study was provided by the Hirosaki Research Institute for the Neurosciences. The Hirosaki Research Institute for the Neurosciences had no further role in study design; the collection, analysis, and interpretation of data; the writing of the report; or in the decision to submit the paper for publication.
Disclosure
The authors report no conflicts of interest in this work.
References
- KesslerRCBrometEJThe epidemiology of depression across culturesAnnu Rev Public Health20133411913823514317
- IshikawaHKawakamiNKesslerRCWorld Mental Health Japan Survey CollaboratorsLifetime and 12-month prevalence, severity and unmet need for treatment of common mental disorders in Japan: results from the final dataset of World Mental Health Japan SurveyEpidemiol Psychiatr Sci201625321722926148821
- World Health Organization [webpage on the Internet]The Global Burden of Disease 2004 Update Available from: http://www.who.int/healthinfo/global_burden_disease/2004_report_update/en/Accessed August 4, 2017
- BarracloughBBunchJNelsonBSainsburyPA hundred cases of suicide: clinical aspectsBr J Psychiatry19741253553734425774
- IsometsäEHenrikssonMMarttunenMMental disorders in young and middle aged men who commit suicideBMJ19953106991136613677787539
- BrentDAPerperJAMoritzGPsychiatric risk factors for adolescent suicide: a case-control studyJ Am Acad Child Adolesc Psychiatry19933235215298496115
- GrøholtBEkebergOWichstrømLHaldorsenTYoung suicide attempters: a comparison between a clinical and an epidemiological sampleJ Am Acad Child Adolesc Psychiatry200039786887510892228
- TurveyCLConwellYJonesMPRisk factors for late-life suicide: a prospective, community-based studyAm J Geriatr Psychiatry200210439840612095899
- OyamaHKoidaJSakashitaTKudoKCommunity-based prevention for suicide in elderly by depression screening and follow-upCommunity Ment Health J200440324926315259630
- RadloffLSThe CES-D scale: a self-report depression scale for research in the general populationAppl Psychol Meas19771385401
- ShimaSShikanoTKitamuraTNew self-rating scales for depressionClin Psychiatry198527717723 Japanese
- IwataNSaitoKRelationships of the Todai Health Index to the General Health Questionnaire and the Center for Epidemiologic Studies Depression ScaleNihon Eiseigaku Zasshi19874248658733437567
- IwataNSaitoKPsychometric properties of the center for epidemiologic studies depression scale of Japanese workersSangyo Igaku198931120212739098
- SchmitzNKruseJTressWApplication of stratum-specific likelihood ratios in mental health screeningSoc Psychiatry Psychiatr Epidemiol200035837537911037307
- DeeksJJAltmanDGDiagnostic tests 4: likelihood ratiosBMJ2004329745816816915258077
- FurukawaTAAndrewsGGoldbergDPStratum-specific likelihood ratios of the general health questionnaire in the community: help-seeking and physical co-morbidity affect the test characteristicsPsychol Med200232474374812102388
- WadaKTanakaKTheriaultGMoriyamaMSatohTAizawaYApplication of the stratum-specific likelihood ratio (SSLR) analysis to results of a depressive symptoms screening survey among Japanese workersSoc Psychiatry Psychiatr Epidemiol200742541041317396203
- YangHJSoongWTKuoPHChangHLChenWJUsing the CES-D in a two-phase survey for depressive disorders among nonreferred adolescents in Taipei: a stratum-specific likelihood ratio analysisJ Affect Disord200482341943015555693
- FunahashiKTakahashiIDanjoKMatsuzakaMUmedaTNakajiSSmoking habits and health-related quality of life in a rural Japanese populationQual Life Res201120219920420857336
- SugawaraNYasui-FurukoriNTakahashiIMatsuzakaMNakajiSAge and gender differences in the factor structure of the Center for Epidemiological Studies Depression Scale among Japanese working individualsCompr Psychiatry20155627227825443978
- SheehanDVLecrubierYSheehanKHThe Mini-International Neuropsychiatric Interview (M.I.N.I.): the development and validation of a structured diagnostic psychiatric interview for DSM-IV and ICD-10J Clin Psychiatry199859suppl 202233
- OtsuboTTanakaKKodaRReliability and validity of Japanese version of the Mini-International Neuropsychiatric InterviewPsychiatry Clin Neurosci200559551752616194252
- SwetsJAMeasuring the accuracy of diagnostic systemsScience19882404857128512933287615
- PeirceJCCornellRGIntegrating stratum-specific likelihood ratios with the analysis of ROC curvesMed Decis Making19931321411518483399
- FurukawaTHiraiTKitamuraTTakahashiKApplication of the Center for Epidemiologic Studies Depression Scale among first-visit psychiatric patients: a new approach to improve its performanceJ Affect Disord19974611139387082
- SimelDLSamsaGPMatcharDBLikelihood ratios for continuous test results – making the clinicians’ job easier or harder?J Clin Epidemiol199346185938433118
- StockingsEDegenhardtLLeeYYSymptom screening scales for detecting major depressive disorder in children and adolescents: a systematic review and meta-analysis of reliability, validity and diagnostic utilityJ Affect Disord201517444746325553406
- VilagutGForeroCGBarbagliaGAlonsoJScreening for depression in the general population with the center for epidemiologic studies depression (CES-D): a systematic review with meta-analysisPLoS One2016115e015543127182821
- PattenSBPerformance of the composite international diagnostic interview short form for major depression in community and clinical samplesChronic Dis Can19971831091129375257
- GuptaSGorenADongPLiuDPrevalence, awareness, and burden of major depressive disorder in urban ChinaExpert Rev Pharmacoecon Outcomes Res201616339340726495800
- ThombsBDCoyneJCCuijpersPRethinking recommendations for screening for depression in primary careCMAJ2012184441341821930744
- KirschIDeaconBJHuedo-MedinaTBScoboriaAMooreTJJohnsonBTInitial severity and antidepressant benefits: a meta-analysis of data submitted to the Food and Drug AdministrationPLoS Med200852e4518303940
- FournierJCDeRubeisRJHollonSDAntidepressant drug effects and depression severity: a patient-level meta-analysisJAMA20103031475320051569
- FujiseNAbeYFukunagaRComparisons of prevalence and related factors of depression in middle-aged adults between urban and rural populations in JapanJ Affect Disord201619077277626618770