
Abstract
Purpose
In recent years, machine learning techniques have received increasing attention as a promising approach to differentiating patients from healthy subjects. Therefore, some resting-state functional magnetic resonance neuroimaging (R-fMRI) studies have used interregional functional connections as discriminative features. The aim of this study was to investigate ADHD-related spatially distributed discriminative features derived from whole-brain resting-state functional connectivity patterns using machine learning.
Patients and Methods
We measured the interregional functional connections of the R-fMRI data from 40 ADHD patients and 28 matched typically developing controls. Machine learning was used to discriminate ADHD patients from controls. Classification performance was assessed by permutation tests.
Results
The results from the model with the highest classification accuracy showed that 85.3% of participants were correctly identified using leave-one-out cross-validation (LOOV) with support vector machine (SVM). The majority of the most discriminative functional connections were located within or between the cerebellum, default mode network (DMN) and frontoparietal regions. Approximately half of the most discriminative connections were associated with the cerebellum. The cerebellum, right superior orbitofrontal cortex, left olfactory cortex, left gyrus rectus, right superior temporal pole, right calcarine gyrus and bilateral inferior occipital cortex showed the highest discriminative power in classification. Regarding the brain–behaviour relationships, some functional connections between the cerebellum and DMN regions were significantly correlated with behavioural symptoms in ADHD (P < 0.05).
Conclusion
This study indicated that whole-brain resting-state functional connections might provide potential neuroimaging-based information for clinically assisting the diagnosis of ADHD.
Introduction
Attention-deficit/hyperactivity disorder (ADHD) labelled as a neurobiologically based developmental disorder, most often occurs and is diagnosed in childhood.Citation1 This disorder is characterized by symptoms that include a persistent pattern of inattention and/or hyperactivity-impulsive behaviour.Citation2 Impairing symptoms of ADHD in many individuals with a childhood diagnosis may persist into adulthood,Citation3 leading to a variety of problems, such as unstable interpersonal relationships and poor job or school performance.Citation4 Despite its high prevalence and risks, the precise pathology of ADHD remains unclear.Citation5 The neural mechanisms underlying these clinical characteristics are still poorly understood and require further investigation to better understand ADHD pathology and to improve diagnosis.Citation6 Clinically, the current diagnosis of ADHD mainly relies on the behavioural symptoms gathered from teachers and/or parents, and objective neurobiological tests are needed.Citation7 Recently, there have been an increasing number of attempts to discover possible neurobiological underpinnings in children with ADHD by using various methods.Citation8 Previous studies of ADHD have mainly focused on localized deficits in some brain regions within attention systems, such as the dorsal lateral prefrontal and anterior cingulate cortices (ACC).Citation8,Citation9 It has subsequently and often been reported that ADHD patients presented interregional functional dysconnectivity and dysregulation of distributed brain networks.Citation10,Citation11 The interactive disruptions between and within various brain networks may underlie ADHD symptoms.Citation12 For example, a prefrontal–striatal pathway is related to cognitive regulation, while dysfunction in this pathway has long been regarded as a neuropsychological correlate of ADHD.Citation13 This pathway has been expanded to include the cerebellum.Citation14,Citation15 Recently, accumulating evidence has also suggested that the prefrontal-striatal-cerebellar pathway associated with ADHD should be extended to include other regions and their interrelationships, such as the involvement of the occipital or temporal cortex.Citation13 Along with these results with ADHD, evidence has supported the hypothesis that clinical symptoms of ADHD result from aberrant interactions in large-scale brain networks.
In recent years, machine learning techniques have received much attention as a promising approach to differentiating psychiatric patients from healthy controls.Citation16,Citation17 Therefore, some studies have adopted whole-brain functional connections as discriminative features to identify patients.Citation18,Citation19 For example, using resting-state functional magnetic resonance neuroimaging (R-fMRI), Zeng et al detected disorder-related connectivity patterns from whole-brain functional connections and then used them to discriminate major depressed patients from matched healthy subjects by means of machine learning.Citation20 Similarly, Li et al utilized a machine learning method based on whole-brain functional connections to extract and analyse classification features that characterized differential connectivity patterns between the schizophrenia group and the healthy control group.Citation21 Rosenberg et al reported that network connections in the brain associated with sustained attention performance were used to predict ADHD symptoms.Citation22 As a data-driven technique, machine learning helps seek potential neuroimaging-based indices to identify patients at the individual level. It also serves in an exploratory manner, based on distributed discriminative features, to further highlight the brain connectivity patterns underlying the behavioural symptoms.Citation23 However, the proportions of functional connections that significantly contribute to ADHD differentiation have not yet been clarified. The ADHD-related brain regions had distributed characteristics, but little is known about the relative contribution of each brain region to ADHD identification.
The present study examined whether machine learning techniques could utilize whole-brain resting-state functional connectivity patterns to differentiate ADHD patients from healthy participants at the individual level with a high degree of accuracy. As mentioned above, dysregulation in the prefrontal-striatal-cerebellar pathway has been shown to be significantly involved in ADHD. We hypothesize that the prefrontal-striatal-cerebellar pathway will have a relevant and highly predictive value in differentiating individuals with ADHD.
Methods
Participants
The characteristics of the participants are specified in . Forty patients with ADHD (40 males, 0 females; mean age 11.83 years and standard deviation of age 2.88) and 28 sex- and age-matched healthy controls (HC; 28 males, 0 females; mean age 11.99 years and standard deviation of age 3.05) were included in the present study. These participants were part of the New York University Child Study Center (NYU) dataset deposited at the Neuroimaging Informatics Tools and Resources Clearinghouse (NITRC) platform (http://fcon_1000.projects.nitrc.org/indi/retro/cobre.html). We screened 68 subjects according to strict exclusion criteria: 1) left or mixed-handedness; 2) poor quality fMRI images (signal loss) or insufficient phenotypic data; 3) intelligence less than 80 and image quality check; and 4) large head motions (see the following section for details) during the R-fMRI scan.
Table 1 Demographic and Clinical Data
The Diagnostic and Statistical Manual of Mental Disorders, Fourth Edition (DSM-IV) was used for diagnosing ADHD. Both ADHD patients and healthy controls had no history of neurological disorders. The present study was carried out in accordance with the principles of the Declaration of Helsinki and was approved by the Institutional Review Board (IRB) of NYU and the NYU School of Medicine. Informed consent was obtained from the parent of each subject before participation.
Image Acquisition and Preprocessing
All images were acquired with a Siemens MAGNETOM Allegra syngo 3.0 T MR Scanner (Siemens AG, Medical Solutions, Erlangen, Germany). A T2*-weighted gradient-echo EPI pulse sequence was acquired in an interleaved order to measure the brain oxygenation level-dependent (BOLD) signal (TR/TE = 2000/15 ms, flip angle = 90°, field of view = 240 × 192 mm2, matrix = 96 × 96, 4 mm isotropic spatial resolution with 33 slices and 176 volumes). A T1-weighted anatomical image in the sagittal orientation was acquired using a magnetization-prepared rapid gradient echo (MPRAGE) sequence (TR/TE = 2530/3.25 ms, flip angle = 7°, slice thickness=1.33 mm) for visualization and localization of the functional data. The participants were instructed to relax and remain still with their eyes close, not to fall asleep, and not to think about anything in particular during the 6-min R-fMRI scan. During wakeful rest, fMRI data recorded the spontaneous fluctuations of BOLD signals which are generally thought to reflect brain activity fluctuation. Functional connectivity is operationally defined as the temporal correlation (measured as a Pearson’s r) between the mean BOLD time series of different brain regions. Image acquisition parameters are found at the ADHD-200 website (http://fcon_1000.projects.nitrc.org/indi/retro/cobre.html).Citation24
Data processing was performed using a combination of DPABI (http://www.rfmri.org/), SPM (http://www.fil.ion.ucl.ac.uk/spm/) and custom code written in MATLAB. For functional images of every subject, the first 10 volumes were discarded to allow for magnetization equilibration effects and the adaptation of the participants to the circumstances. The remaining images were first corrected for time delay between slices, and realigned to the first volume for head-motion correction. The realigning step provided a record of head motions by estimating the translations in each direction and the rotations in angular motion about each axis for each of the consecutive volumes. All participants exhibited a maximum displacement of less than 2 mm at each axis and an angular motion of less than 2 for each axis. Linear regression was also used to control for confounding factors including six motion parameters, and the mean time series of white matter and cerebrospinal fluid signals. The images were then normalized into a standard stereotactic space as defined by the Montreal Neurological Institute (resampling voxel size = 3 mm × 3 mm × 3 mm) and smoothed with a 6-mm full-width at half-maximum Gaussian kernel. Finally, the images underwent temporal bandpass filtering (between 0.01 and 0.08 Hz).
Averaged R-fMRI time series for each of the 116 regions were extracted according to the automated anatomical labelling atlas (, the 90 cerebral and 26 cerebellar regions).Citation25 The 116 brain regions from the automated anatomical labelling atlas were used to represent the whole brain. Interregional functional connections were calculated between all possible pairs of regions using Pearson correlation of their mean R-fMRI time series. Correlation coefficients were converted to z values by Fisher’s r-to-z transformation for further analysis and statistics. For each subject, a 116×116 symmetric matrix was obtained and its matrix’s lower triangle elements were then exacted for feature selection. The feature space was spanned by the (116–115)/2 = 6670 dimensional functional connections.
Table 2 Abbreviations for the 116 Regions Defined in Automated Anatomical Labeling Template
Feature Selection and Support Vector Machine Classification
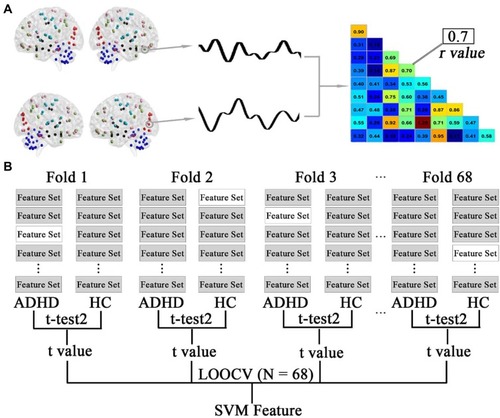
A flowchart of feature selection is shown in . In the present study, the abnormal functional connectivity patterns in the patients with ADHD are represented by the discriminative functional connections. The aim of feature selection was to generate the feature space for classification by retaining the most discriminative connections and eliminating the rest. Following previous studies,Citation20,Citation21 this step was performed using a combination of t-tests and leave-one-out cross-validation (LOOCV). Specifically, the data consisting of 68 observations (connections that were different between ADHD and HC participants) were subdivided into 68 folds. For each LOOCV fold, the features were separately ranked by their absolute between-group t values in descending order, and the same top discriminative connections (from 5 to 500 with step of 5) were selected. Since feature ranking was based on a slightly different dataset of functional connections in each LOOCV iteration and the final feature set after feature selection differed slightly from iteration to iteration, consensus features were introduced here, which were defined as those connections with highly discriminative values in every fold validation. This process was repeated 68 times such that data from each participant were left out once while t values were generated using the remaining data. Support vector machine (SVM) with a linear kernel function was employed for classification based on the dataset of consensus functional connectivity features with high discriminative power.
Figure 1 Schematic diagram of feature extraction and selection. (A) The average time series of all voxels within the automated anatomical labelling (AAL) regions were used to generate a representative time course. A pairwise Pearson correlation of these time courses resulted in a functional connectivity matrix. The lower diagonal of each participant’s matrix was used for a feature set for that participant. (B) Feature selection using a combination of t-tests and leave-one-out cross-validation (LOOCV). The data consisting of 68 observations (connections that were different between ADHD and HC participants) were subdivided into 68 folds. This selection was repeated 68 times such that data from each participant were left out once, while t-test analyses were performed using the remaining data. The left-out participants were denoted as no-shaded feature sets (only one shown here). The features were separately ranked by their absolute between-group t values in descending order, and the same top discriminative connections (from 5 to 500 with step 5) were selected for SVM analysis.
SVM is the most popular algorithm for classification among the machine learning techniques.Citation24 For example, given a set of features (e.g., functional connections) and a label (e.g., patient and healthy), we trained SVM based on the training dataset, which mapped the set of features to their respective labels. The training process found the optimum hyperplane that separated the training data by the maximum margin. Thus, given a new dataset of features derived from an observation, we could then utilize the SVM fit to predict a label (group) for this novel observation.
Statistical Analysis and Permutation Tests
The two-sample t-test was used to compare functional connections between the two groups for further selection of discriminative features. Pearson correlation analysis was performed between clinical behavioural scales (inattention and hyperactivity/impulsivity scales) and functional connections. The statistical threshold was set at P = 0.05. We assessed the classification performance in a framework of permutation tests.Citation20 Choosing the actual value of classification accuracy after SVM analysis as the statistic, permutation tests were used to estimate the statistical significance of the value. Specifically, the class labels of the training data were randomly changed beforehand, and cross-validation was then performed on the permuted dataset. This permutation process was repeated 10,000 times. It was assumed that classification performance was reliable when the generalization rate obtained by the classifier trained on the real class labels exceeded the 95% confidence interval of the classifier trained on randomly relabelled class labels. The sensitivity and specificity of the classifier are commonly used to evaluate the diagnostic values. Sensitivity is the proportion of true positive samples correctly identified by the test, while specificity is the proportion of true negative samples correctly identified by the test.
Results
Classification Results
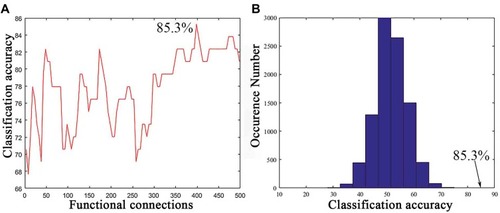
As shown in , a series of classification accuracies are illustrated across the varying threshold ranges from 5 to 500 functional connections with the top between-group t values. The classification accuracy was calculated during the SVM analysis based on the consensus functional connections derived from the cross-validation of t-test analysis. The result with the highest classification accuracy indicated that 85.3% of subjects were correctly classified at a threshold of 365 functional connections (). The sensitivity and specificity were 82.1% and 87.5%, respectively. Permutation tests (repetition times: 10,000) demonstrated that the actual classification accuracy was significantly higher than that with the random label (P < 0.0001; ).
Figure 2 Classification performance of the support vector machine (SVM). (A) Classification accuracy as a function of a selected feature number (from 5 to 500 with step of 5). The selected features for classification in the SVM were derived from the most consensus functional connections with top t values across all LOOCV folds. (B) The permutation distribution of the highest classification accuracy estimate. The permutation was repeated 10,000 times to result in 10,000 classification accuracies based on random labels. The classification accuracy (85.3%) based on the true labels exceeded all classification accuracies across permutations, indicating that the classifier can reliably learn the relationship between the features and the labels with a probability higher than 0.99999.
The Highly Discriminative Functional Connections and Key Brain Regions for ADHD Identification
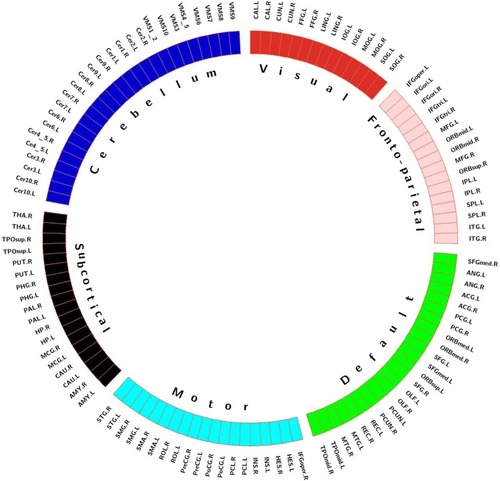
As shown in , to locate these brain regions that played key roles during identifying ADHD using the highly discriminative functional connections, we first partitioned the whole brain into network parts. Because the AAL template already distinguished the cerebellum from the brain,Citation25 the partition analysis did not include the cerebellum. Following a previous study,Citation18 we averaged the functional matrices of all controls to obtain a single 90 × 90 matrix and applied K-means clustering on the matrix rows to partition 90 regions into 5 modules (K = 5, Euclidean distance metric). The value of K, the optimal number of clusters, was evaluated by using the cluster number validity analysis (silhouette) on the functional connectivity of all subjects, where the number varied from 2 to 6. Thus, the whole brain, including the cerebellum, was separated into six networks. This clustering approach enabled the identification of non-overlapping functional networks that spanned the whole brain in a data-driven manner.
Figure 3 Functional connectivity networks identified using clustering analysis. The defined networks were coded with different colours (visual network, red; frontoparietal network, pink; default mode network, green; motor network, cyan; subcortical network, black; and cerebellum, dark blue).
shows the distribution pattern of the consensus functional connections and key brain regions with high discriminative power during SVM analysis. At the aforementioned highest classification result (85.3%), 154 consensus discriminative functional connections across all LOOCV folds were extracted for SVM classification. Based on the aforementioned profile of network subdivision, the majority of these connections were located in the cerebellum, DMN, and frontoparietal network. Approximately half of the most discriminative connections were observed in the cerebellum with connections to the subcortical regions including the putamen, caudate, and pallidum, the visual network including the fusiform gyrus, lingual gyrus, cuneus, and calcarine gyrus, the DMN including the anterior and posterior cingulate cortex, orbitofrontal cortex, and medial and dorsal part of superior frontal gyrus, and the other regions including the inferior and superior temporal gyrus, supramarginal gyrus, insula, rolandic operculum, and paracentral lobule. In addition, functional connections between the olfactory cortex and the inferior and superior parietal gyrus and between the gyrus rectus and other regions including the anterior cingulate gyrus, putamen, caudate, and pallidum were found.
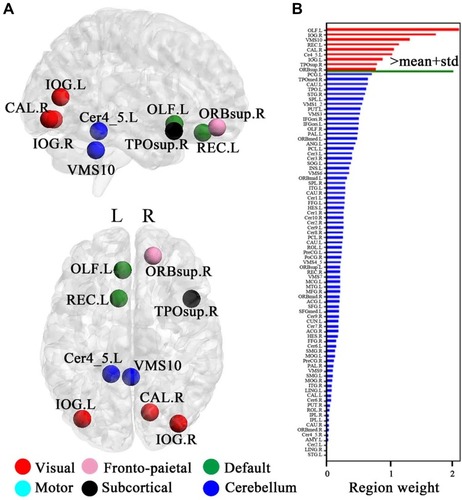
Figure 4 The distribution of consensus discriminative functional connections and their related regional weights. The ROIs are coded in different colours according to the six defined networks. Regional weights are size-coded by discriminative power in machine learning. The line colours, which were scaled with their mean discriminative performance in the LOOCV, represent the relative consensus functional connections. The 116 ROIs scaled by their weights are also displayed. The ROIs are colour-coded according to the defined networks (visual, red; frontoparietal, pink; default, green; motor, cyan; subcortical, black; and cerebellum, dark blue).
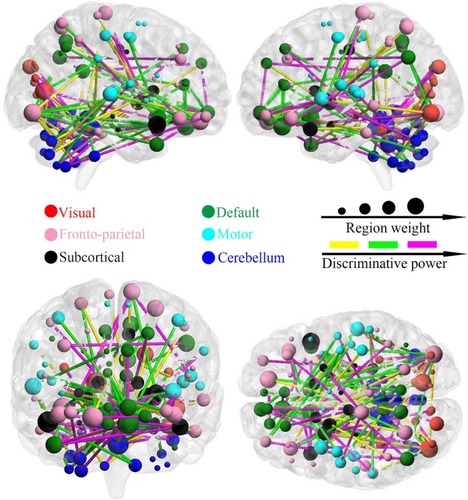
For a visual representation of the importance of key brain regions in the SVM analysis, the diameter of each sphere in was scaled by the corresponding regional weight, which was measured by the sum of the weight of all connections to and from that brain region. As shown in and , there are nine brain regions with greater weight measured by the criterion, and its regional weight is one standard deviation more than the mean of powers of all brain regions. These key regions included the cerebellum (VMS10 and Cer4_5), right superior orbitofrontal cortex, left gyrus rectus, left olfactory cortex, right temporal pole, right calcarine gyrus and bilateral inferior occipital cortex.
Figure 5 Regional importance. (A) The most discriminating brain regions formed by the top nine brain regions based on importance. (B) Regional importance is displayed by bars. The magenta bars indicate the top discriminative regions whose discriminative powers are one standard deviation greater than the mean of powers of all discriminative regions. X- and y-axis labels represent the brain regions and regional weights, respectively.
Brain–Behaviour Relationship
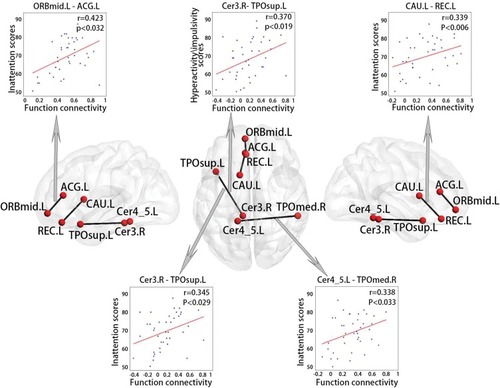
As shown in , the ADHD group exhibited statistically significant correlations between four functional connections and inattention scores (P < 0.05), including the connections between the cerebellum and left superior temporal pole (r = 0.345), the cerebellum and right middle temporal pole (r = 0.338), the left middle orbitofrontal cortex and left anterior cingulum (r = 0.423), and the left gyrus rectus and right caudate (r = 0.339). These regions are mainly located in the DMN and cerebellum. There was a functional connection between the cerebellum and left superior temporal pole that was significantly correlated with the hyperactivity/impulsivity scales (r = 0.370, P < 0.05). These functional connections, which are significantly correlated with clinical behavioural scales, corresponded to 2% of all consensus functional connections.
Figure 6 Correlations between behavioural variables and functional connections in ADHD.
Discussion
The present study adopted whole-brain functional connections as discriminative features to differentiate boys with ADHD from typically developing controls. The results demonstrated that the functional connections with high discriminative power were mainly located in the cerebellum, DMN and frontoparietal network. Nine key brain regions were found according to regional weight that were primarily in the cerebellum, visual cortical areas and (para)limbic regions. In the brain-behaviour relationship, we found statistically significant correlations between clinical behavioural scales (inattention scale and hyperactivity/impulsivity scale) and several functional connections within the DMN or between the cerebellum and DMN. The present study indicated that cerebellar and cerebellar functional connections played an important role in identifying those with ADHD.
The cerebellum is involved in coordinating movement and motor learning.Citation26 Many previous studies have considered that the cerebellum is a focal area of ADHD-related abnormal changes.Citation15,Citation26 For example, a previous study reported that reduced volumes of the cerebellum or its subregions in ADHD were correlated with attentional problems and clinical outcomes.Citation27,Citation28 In the present study, the cerebellum was one of the most discriminative regions and had one of the most discriminative functional connections for ADHD identification. At this level, our findings revealed the magnitude of the involvement of the cerebellum in identifying ADHD. Specifically, we found that most discriminative functional connections were the cerebellar connections with subcortical, DMN and visual regions. The cerebellum is structurally connected with prefrontal and striatal regions.Citation29,Citation30 Our findings found that the connections between the cerebellum and the putamen, caudate and pallidum were highly discriminative, providing new evidence of the prefrontal-striatal-cerebellar pathway being involved in ADHD.Citation31,Citation32 The putamen and caudate are part of the striatum, while the pallidum is the “output region” of the striatum. The striatum is linked to motor performance and coordination, especially the “automatic” performance of previously learned movements.Citation33,Citation34 Highly discriminative connections were observed between the cerebellum and DMN regions, such as the anterior and posterior cingulate gyrus and orbitofrontal cortex. Our findings were consistent with previous studies.Citation35,Citation36 The cingulate gyrus is involved in processing emotions and behaviour regulation and helps to regulate autonomic motor function. The anterior cingulate gyrus plays a role in some functions, including attention processing, sensory information analysis, problem solving and cognitive control.Citation37 The anterior cingulate gyrus and cerebellum work together to form attention conditioning and motor control. The posterior cingulate gyrus is involved in the spatial orientation of objects in an environment.Citation38 Connections with the cerebellum enable the posterior cingulate gyrus to influence functions related to movement, spatial orientation, and navigation. We found that some connections with high discriminative power were those between the cerebellum and visual areas, such as the fusiform gyrus, lingual gyrus, cuneus, and calcarine gyrus, and it may account for impairments in early-stage, “subexecutive” attentional mechanisms.Citation39 The highly discriminative connections also involved the olfactory cortex and gyrus rectus. The anterior (orbital) surface of the frontal lobe is composed of the gyrus rectus, the olfactory sulcus, and orbital gyri. Our findings were consistent with previous studies about impairments and abnormalities in these areas in those with ADHD, such as dysexecutive and orbitofrontal dysfunction of the prefrontal cortex.Citation40 Correspondingly, we also found nine key regions with greater feature weights in the ADHD identification primarily in the cerebellum, (para)limbic regions, and visual areas.
In the ADHD group, several functional connections were significantly positively correlated with ADHD symptoms: hyperactivity/impulsivity or inattention scores. Among these, the functional connection between the cerebellum and temporal pole was significantly related to two ADHD symptoms. A previous study reported that smaller volumes of the cerebellum and temporal pole were correlated with higher levels of trait impulsivity in ADHD patients.Citation40 This finding supports the view that the relationship between the cerebellum and temporal pole might play an important role in ADHD symptoms. The inattention scores were significantly positively correlated with the connection between the anterior cingulate gyrus and orbitofrontal cortex and the connection between the caudate and gyrus rectus. The prefrontal lobe has been the focus of a large number of related studies, including those localizing selective attention in the anterior cingulate gyrus and impulsive behaviour in the orbitofrontal cortex.Citation41,Citation42 The reduction in anterior cingulate gyrus grey matter volume in individuals with ADHD is significantly related to selective attention deficits.Citation43 These associations support the aforementioned discussion on the high discriminative power of the anterior cingulate gyrus and orbitofrontal cortex and are consistent with evidence of the prefrontal-striatal-cerebellar pathway involved in ADHD.Citation14
The present study has some limitations. First, the sample size was relatively small, which might limit generalizability and statistical power for detecting subtle effects. Therefore, the present study should be considered a proof of principle study. Further studies with a larger sample size are needed to assess the reproducibility of our findings. ADHD is three times more common in males than in females, so we screened male subjects. However, the inclusion of only male subjects might also reduce the generalizability of the findings to females with ADHD. Further studies should take into account gender and sample balance between the two groups. Second, the feature selection method might have contained some imperfect processes that limit the classification performance. Therefore, further studies with more effective optimized methods are expected to improve the classification.Citation37 Third, the present study considered that the resting-state brain network contains neurobiological information regarding ADHD-related changes; however, how to specifically influence the pathogenesis of ADHD needs more in-depth research, especially for ADHD-related problems in thought processing.
Conclusion
The present study demonstrated that the machine learning approach based on whole-brain resting-state functional connections could differentiate ADHD individuals from healthy controls. This indicated that discriminative functional connections in the brain might contain biological information for ADHD differentiation. In particular, the majority of the most discriminating functional connections were located within or across the cerebellum, DMN, and frontoparietal regions, thereby indicating that connectomic disturbances in the brain are involved in a large-scale resting-state network. In summary, the present study found that the prefrontal-striatal-cerebellar pathway and cerebellar functional connections showed high predictive value in ADHD identification. Our results suggest that the cerebellum may play important roles in the pathophysiology of ADHD.
Acknowledgments
This study was supported by the Natural Science Foundation of Zhejiang Province (LY17H180007), the Hangzhou Science and Technology Commission Foundation (20170533B06), the Scientific Research Start-up Foundation (PF15002004049) and the cultivation project of the province-leveled preponderant characteristic discipline in the College of Education (18JYXK036) of Hangzhou normal University.
Disclosure
The authors report no conflicts of interest in relation to this work.
References
- Polanczyk G, Rohde LA. Epidemiology of attention-deficit/hyperactivity disorder across the lifespan. Curr Opin Psychiatry. 2007;20:386–392.17551354
- Sharma A, Couture J. A review of the pathophysiology, etiology, and treatment of attention-deficit hyperactivity disorder (ADHD). Ann Pharmacother. 2014;48:209–225. doi:10.1177/106002801351069924259638
- Volkow ND, Swanson JM. Clinical practice: adult attention deficit-hyperactivity disorder. N Engl J Med. 2013;369:1935–1944. doi:10.1056/NEJMcp121262524224626
- Feldman HM, Reiff MI. Clinical practice. Attention deficit-hyperactivity disorder in children and adolescents. N Engl J Med. 2014;370:838–846. doi:10.1056/NEJMcp130721524571756
- Friedman LA, Rapoport JL. Brain development in ADHD. Curr Opin Neurobiol. 2015;30:106–111. doi:10.1016/j.conb.2014.11.00725500059
- Alexander L, Farrelly N. Attending to adult ADHD: a review of the neurobiology behind adult ADHD. Ir J Psychol Med. 2018;35:237–244. doi:10.1017/ipm.2017.7830124185
- Zhou X, Reynolds CR, Zhu J, Kamphaus RW, Zhang O. Evidence-based assessment of ADHD diagnosis in children and adolescents. Appl Neuropsychol Child. 2018;7:150–156. doi:10.1080/21622965.2017.128466128631964
- Dickstein SG, Bannon K, Castellanos FX, Milham MP. The neural correlates of attention deficit hyperactivity disorder: an ALE meta-analysis. J Child Psychol Psychiatry. 2006;47:1051–1062. doi:10.1111/jcpp.2006.47.issue-1017073984
- Cortese S, Castellanos FX. Neuroimaging of attention-deficit/hyperactivity disorder: current neuroscience-informed perspectives for clinicians. Curr Psychiatry Rep. 2012;14:568–578. doi:10.1007/s11920-012-0310-y22851201
- von Rhein D, Beckmann CF, Franke B, et al. Network-level assessment of reward-related activation in patients with ADHD and healthy individuals. Hum Brain Mapp. 2017;38:2359–2369. doi:10.1002/hbm.v38.528176434
- Elton A, Alcauter S, Gao W. Network connectivity abnormality profile supports a categorical-dimensional hybrid model of ADHD. Hum Brain Mapp. 2014;35:4531–4543. doi:10.1002/hbm.2249224615988
- De La Fuente A, Xia S, Branch C, Li X. A review of attention-deficit/hyperactivity disorder from the perspective of brain networks. Front Hum Neurosci. 2013;7:192. doi:10.3389/fnhum.2013.0019223720619
- Cubillo A, Halari R, Smith A, Taylor E, Rubia K. A review of fronto-striatal and fronto-cortical brain abnormalities in children and adults with Attention Deficit Hyperactivity Disorder (ADHD) and new evidence for dysfunction in adults with ADHD during motivation and attention. Cortex. 2012;48:194–215. doi:10.1016/j.cortex.2011.04.00721575934
- Castellanos FX, Proal E. Large-scale brain systems in ADHD: beyond the prefrontal-striatal model. Trends Cogn Sci. 2012;16:17–26. doi:10.1016/j.tics.2011.11.00722169776
- Durston S, van Belle J, de Zeeuw P. Differentiating frontostriatal and fronto-cerebellar circuits in attention-deficit/hyperactivity disorder. Biol Psychiatry. 2011;69:1178–1184. doi:10.1016/j.biopsych.2010.07.03720965496
- Savage N. Machine learning: calculating disease. Nature. 2017;550:S115–S117. doi:10.1038/550S115a29045372
- Huys QJ, Maia TV, Frank MJ. Computational psychiatry as a bridge from neuroscience to clinical applications. Nat Neurosci. 2016;19:404–413. doi:10.1038/nn.423826906507
- Peer M, Pruss H, Ben-dayan I, Paul F, Arzy S, Finke C. Functional connectivity of large-scale brain networks in patients with anti-NMDA receptor encephalitis: an observational study. Lancet Psychiatry. 2017;4:768–774. doi:10.1016/S2215-0366(17)30330-928882707
- Du Y, Fu Z, Calhoun VD. Classification and prediction of brain disorders using functional connectivity: promising but challenging. Front Neurosci. 2018;12:525. doi:10.3389/fnins.2018.0052530127711
- Zeng LL, Shen H, Liu L, et al. Identifying major depression using whole-brain functional connectivity: a multivariate pattern analysis. Brain. 2012;135:1498–1507. doi:10.1093/brain/aws05922418737
- Li J, Sun Y, Huang Y, Bezerianos A, Yu R. Machine learning technique reveals intrinsic characteristics of schizophrenia: an alternative method. Brain Imaging Behav. 2018;13:1386–1396. doi:10.1007/s11682-018-9947-4
- Rosenberg MD, Finn ES, Scheinost D, et al. A neuromarker of sustained attention from whole-brain functional connectivity. Nat Neurosci. 2016;19:165–171. doi:10.1038/nn.417926595653
- Yu Y, Shen H, Zeng LL, Ma Q, Hu D. Convergent and divergent functional connectivity patterns in schizophrenia and depression. PLoS One. 2013;8:e68250. doi:10.1371/journal.pone.006825023844175
- Bellec P, Chu C, Chouinard-decorte F, Benhajali Y, Margulies DS, Craddock RC. The neuro bureau ADHD-200 preprocessed repository. Neuroimage. 2017;144:275–286. doi:10.1016/j.neuroimage.2016.06.03427423255
- Tzourio-mazoyer N, Landeau B, Papathanassiou D, et al. Automated anatomical labeling of activations in SPM using a macroscopic anatomical parcellation of the MNI MRI single-subject brain. Neuroimage. 2002;15:273–289. doi:10.1006/nimg.2001.097811771995
- Siqueira A, Junior CE, Comfort WE, Rohde LA, Sato JR. Abnormal functional resting-state networks in ADHD: graph theory and pattern recognition analysis of fMRI data. Biomed Res Int. 2014;2014:380531.25309910
- Buckner RL. The cerebellum and cognitive function: 25 years of insight from anatomy and neuroimaging. Neuron. 2013;80:807–815. doi:10.1016/j.neuron.2013.10.04424183029
- Stoodley CJ. Distinct regions of the cerebellum show gray matter decreases in autism, ADHD, and developmental dyslexia. Front Syst Neurosci. 2014;8:92. doi:10.3389/fnsys.2014.0009224904314
- Mackie S, Shaw P, Lenroot R, et al. Cerebellar development and clinical outcome in attention deficit hyperactivity disorder. Am J Psychiatry. 2007;164:647–655. doi:10.1176/ajp.2007.164.4.64717403979
- Bostan AC, Strick PL. The cerebellum and basal ganglia are interconnected. Neuropsychol Rev. 2010;20:261–270. doi:10.1007/s11065-010-9143-920811947
- Bostan AC, Dum RP, Strick PL. Functional anatomy of basal ganglia circuits with the cerebral cortex and the cerebellum. Prog Neurol Surg. 2018;33:50–61.29332073
- Dahan A, Reiner M. Evidence for deficient motor planning in ADHD. Sci Rep. 2017;7:9631. doi:10.1038/s41598-017-09984-728852003
- Tzvi E, Munte TF, Kramer UM. Delineating the cortico-striatal-cerebellar network in implicit motor sequence learning. Neuroimage. 2014;94:222–230. doi:10.1016/j.neuroimage.2014.03.00424632466
- Laforce R Jr, Doyon J. Distinct contribution of the striatum and cerebellum to motor learning. Brain Cogn. 2001;45:189–211. doi:10.1006/brcg.2000.123711237366
- Penhune VB, Steele CJ. Parallel contributions of cerebellar, striatal and M1 mechanisms to motor sequence learning. Behav Brain Res. 2012;226:579–591. doi:10.1016/j.bbr.2011.09.04422004979
- Kucyi A, Hove MJ, Biederman J, Van Dijk KR, Valera EM. Disrupted functional connectivity of cerebellar default network areas in attention-deficit/hyperactivity disorder. Hum Brain Mapp. 2015;36:3373–3386. doi:10.1002/hbm.2285026109476
- Tomasi D, Volkow ND. Abnormal functional connectivity in children with attention-deficit/hyperactivity disorder. Biol Psychiatry. 2012;71:443–450. doi:10.1016/j.biopsych.2011.11.00322153589
- Yucel M, Wood SJ, Fornito A, Riffkin J, Velakoulis D, Pantelis C. Anterior cingulate dysfunction: implications for psychiatric disorders? J Psychiatry Neurosci. 2003;28:350–354.14517578
- Leech R, Braga R, Sharp DJ. Echoes of the brain within the posterior cingulate cortex. J Neurosci. 2012;32:215–222. doi:10.1523/JNEUROSCI.3689-11.201222219283
- Ahrendts J, Rusch N, Wilke M, et al. Visual cortex abnormalities in adults with ADHD: a structural MRI study. World J Biol Psychiatry. 2011;12:260–270. doi:10.3109/15622975.2010.51862420879808
- Fernandez-jaen A, Lopez-martin S, Albert J, et al. Cortical thinning of temporal pole and orbitofrontal cortex in medication-naive children and adolescents with ADHD. Psychiatry Res. 2014;224:8–13. doi:10.1016/j.pscychresns.2014.07.00425085707
- Etkin A, Egner T, Kalisch R. Emotional processing in anterior cingulate and medial prefrontal cortex. Trends Cogn Sci. 2011;15:85–93. doi:10.1016/j.tics.2010.11.00421167765
- Zhu Y, Yang D, Ji W, et al. The relationship between neurocircuitry dysfunctions and attention deficit hyperactivity disorder: a review. Biomed Res Int. 2016;2016:3821579. doi:10.1155/2016/382157927689077