
Abstract
Objective
Previous studies demonstrated that myopia could result in alterations of brain activity in specific areas. However, whether the visual function could improve by Lasik surgery, with the brain activity alterations also change, is still unknown. Here, we intended to use the amplitude of low-frequency fluctuation (ALFF) technique to investigate the intrinsic brain activity changes in pre-Lasik (PRL) and post-Lasik (POL) patients.
Methods
A total of 15 patients with myopia (nine male and six female) were recruited in our study, who were matched according to age, weight, and height. These patients comprised both the PRL and POL groups, which is self-controlled. The patients all underwent resting-state functional magnetic resonance imaging (MRI), and the spontaneous brain activity changes were recorded by the ALFF technique. The data were recorded and arranged in the receiver operating characteristic (ROC) curve, which presented how intrinsic activities altered in different brain regions. Moreover, by Graphpad prism 8, we can analyze the linear correlation between HADS (Hospital Anxiety and Depression Scale) and ALFF values as well.
Results
Differences in ALFF values existed in brain regions between the same patient before and after the Lasik operation. The regions with increased ALFF values after Lasik surgery were the left parahippocampal gyrus, cerebellar vermis, and left posterior cingulate cortex. The regions with decreased ALFF values after Lasik surgery were the left supramarginal gyrus and right trigonometric inferior frontal gyrus.
Conclusion
We demonstrated significant fluctuations of ALFF values in specific brain areas between the same patients before and after the Lasik surgery. The altered ALFF values reflected the hyperactivity or hypoactivity of the specific brain areas, which may help predict the recovery level of patients’ vision after Lasik surgery. Furthermore, based on the experimental results that presented significant activity alterations in specific brian regions, patients could be speculated equipped with a better visual function.
Introduction
Myopia is a condition in which the eye is loosely regulated, causing parallel light rays to fall in front of the retina after being refracted by the eye’s refractive system, eventually forming a blurry image. Myopia has become the most common disease in ophthalmology in recent years,Citation1 and teenagers are most susceptible to being affected.Citation2 The overall prevalence of myopia in adults aged above 40 years is 38.9% in Singapore, and that is much lower in Western countries like the US (25.1%).Citation3 And the prevalence is much higher in East Asian children as well; in 12‐year‐old children, the prevalence of myopia is 62.0% in Singapore and 49.7% in Guangzhou (China), while in the US it is just 20.0%.Citation3 It is a condition that should receive high awareness, as the occurrence of myopia has increased progressively over recent years in our country, and a significant number of teenagers are diagnosed with myopia. Researchhas shown that the risk factors include genetic, environmental, and dietary factors, as well as lifestyle and other factors.Citation2 Although myopia is not a type of organic lesion,Citation4 it can cause inconvenience in the daily life of patients. If not managed in a timely manner, reduced vision or even blindness can occur.Citation2 Therefore, the prevention, remission, and treatment of myopia are high-priority topics.
Laser surgery has been considered as the main method to correct the refractive system and myopia, the efficacy of which has been widely accepted in clinics.Citation4 Laser Assisted in Situ Keratomileusis (LASIK) is the surgery most frequently performed worldwide,Citation7 the mechanism of action of which is to change the curvature of the anterior surface of the cornea with a laser, achieving neutralization of the ametropia.Citation4 Although the high precision and high resolution of LASIK surgery can guarantee satisfactory therapeutic outcomes and the minor trauma can facilitate a good prognosis after the surgery,Citation5 several risk factors exist that may affect the operative results; for example, besides the contingent complications after the surgery, dry eyes are the most common adverse effect.Citation6
MRI is a technique that provides advanced and comprehensive brain information, including structural anatomy of the brain as well as information on how it functions, in a harmless and non-invasive manner.Citation8 Recently, a more burgeoning and accurate technique has arisen called functional magnetic resonance imaging (fMRI), which compensates for the limitations of MRI by providing information on the activity level of specific parts of the cerebral cortex.Citation9 One branch of fMRI is BOLD-fMRI (blood oxygenation level-dependent functional MRI), which can detect spontaneous fluctuations of the BOLD-fMRI signal in a resting state, which is detected by ALFF (amplitude of low-frequency fluctuation).Citation10 The spontaneous neurological activity detected by ALFF has been accepted to be considered as a valuable parameter in research.Citation11
Previous studies revealed that a close correlation between neuronal activities changed and visual function impaired existed in patients with high myopia. The majority of previous studies compared nearsighted patients with healthy groups who were matched with age, sex, and educational status to subjects.Citation12,Citation13 Guo et alCitation12 pointed out that, in high myopia patients compared with 20-paired subjects, decreased ALFF was observed in the bilateral frontal lobe, the right inferior parietal lobule, and the left occipital lobe, while increased ALFF values were in the left caudate nucleus, the occipital lobe, and the thalamus. Besides, Huang et alCitation13 discovered the altered regions in high myopia patients that were significantly lower ALFF in the middle temporal gyrus, left inferior frontal gyrus/putamen, right inferior frontal gyrus/putamen/insula, right middle frontal gyrus, and right inferior parietal lobule, and higher ALFF values in the bilateral midcingulate cortex, left postcentral gyrus, and left precuneus/inferior parietal lobule. There were also studies revealing the uncomfortable symptoms and recovery level of visual function after Lasik surgery.Citation4,Citation6 However, to our knowledge, our study is the first to combine ALFF to explore the altered-activity regions of the brain after Lasik surgery. The controlled and experimental groups in this experiment were the same clusters of patients and differed according to whether they had undergone Lasik surgery. We hypothesized that altered ALFF values in specific brain regions was detectable in patients after Lasik surgery, which furthermore could give a clue for the recovery level of patient’s vision and efficiency of Lasik surgery.
Methods
Subjects
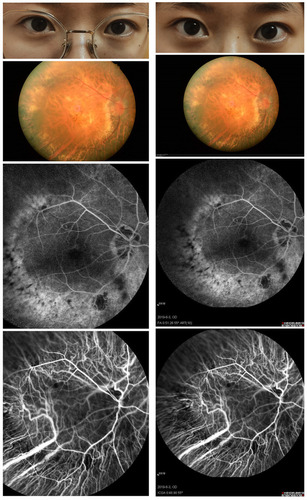
The participants in the study were patients seeking clinical assistance in the Ophthalmology Department of the First Affiliated Hospital of Nanchang University, and we selected 15 of them randomly in this study, including nine males and six females. The inclusion criteria were the following: 1) age between 20–25; 2) patients who decided to undergo Lasik surgery; and 3) patients whose myopia was their only ocular problem. The typical fundus photographs are shown in . The exclusion criteria were the following: 1) patients who had completed Lasik surgery or corrective measures previously; 2) patients with other ocular diseases (eg, glaucoma, optic neuritis, strabismus) besides myopia; 3) patients with psychiatric problems (depression, bipolar disorder), cardiovascular diseases, or cerebral infarction diseases; and 4) patients who were addicted to alcohol or abused drugs. These 15 patients comprised the PRL group, and the POL group included the same group of people. This study was carried out with permission from the Medical Ethics Committee of the First Affiliated Hospital of Nanchang University. We collected data on participants who were informed of the study protocol and the potential risks that could occur, volunteered to participate, and signed informed consent forms.
Figure 1 Typical fundus photographs of myopia patients before and after surgery.
MRI Parameters
Three-Tesla MRI scanners were required for MRI scans. During the process of scanning, the participants were advised to stay still and not open their eyes until the process was complete, which required 15 minutes. A total of 240 images were then collected using the following parameters: 1,900 ms repetition time, 2.26 ms echo time, 1.0 mm thickness, 0.5 mm gap, 256×256 acquisition matrix, 90° flip angle, 250×250 mm field of view, and 29 axial slices.
fMRI Data Processing
We used MRIcro software (https://www.mccauslandcenter.sc.edu/crnl/mricro) to identify valuable data to be collected. To maintain magnetization equilibrium, we abandoned the first 10 time points as well. We employed Data Processing Assistant for Advanced Edition of Resting-State fMRI (DPARSF) software to analyze Digital Imaging Communications in Medicine (DICOM) images, performed correction of head movement, normalized the spatial position and slice time, and performed full-width smoothing with a Gaussian kernel of 6×6×6 mm3 at half-maximum based on the rs-fMRI data analysis toolkit (REST) software and Statistical Parametric Mapping software (SPM). Subjects who had at least a 1.5-mm exceeding shift in x, y, or z or 1.5 angular motion were eliminated. To remove the effects induced by head motion, the Frist on six head motion parameters were introduced.Citation14 After head movement had been corrected, a standard echo plane image template was used to ensure the collected data reached the standards of the Montreal Neurological Institute (MNI). To calculate ALFF, the data were further processed by a Gaussian kernel. Additionally, to increase the accuracy of images and reduce the deviation caused by breathing or cardiac noise, the fMRI images were detrended and bandpass-filtered (0.01–0.08 Hz). A previous study had described the process for calculating ALFF in detail, and the ALFF maps of each patient were divided by the mean value of ALFF.Citation15
Correlation Analysis
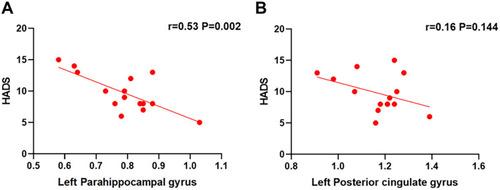
Patients completed a Hospital Anxiety and Depression Scale (HADS), the data of which were statistically analyzed. Graphpad prism 8 was used to analyze the linear correlation between HADS and ALFF values of the left parahippocampal gyrus (P=0.002) and the left posterior cingulate gyrus (P=0.144). After combining the results, a linear correlation graph was generated.
Statistical Analysis
The demographic and clinical variables between PRL and POL groups were compared using SPSS20.0 software (SPSS, IBM Corporation, Armonk, NY, USA) with independent t sample test, the data of which can be considered as significant only when P-values are less than 0.05.
A two-sample t-test was applied by the REST software that aimed to explore the voxel-wise difference between two groups. The statistical threshold of voxel level was set at P<0.05 for multiple comparisons by False Discovery Rate (FDR). And AlphaSim corrected at a voxel level of Q<0.01 and cluster size >40.
All the data were recorded by a receiver operating characteristic (ROC) curve that showed how the ALFF values varied after the Lasik surgery. The correlations between the ALFF values of distinct brain areas and the recovery levels in patients after Lasik surgery were evaluated by the Pearson’s correlation analysis.
Results
Demographics and Visual Measurements
The age, weight, and height between patients in the PRL and POL groups were well matched. We ensured that the spherical equivalent and astigmatism were not significantly different between the left and right eyes. The details are presented in .
Table 1 Demographics and Visual Measurements Between PRL and POL Groups
ALFF Differences
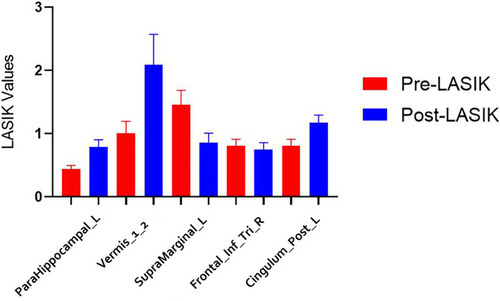
In the POL group, the ALFF values were decreased in the left supramarginal and Frontal_Inf_Tri_R regions ( [blue and green] and ). Furthermore, the brain areas that showed increased ALFF values were ParaHippocampal_L, Vermis_1_2, and Cingulum_Post_L ( [red] and ). The mean values of AFLL are presented in .
Table 2 Brain Areas with Significantly Different ALFF Values Between Groups
Figure 2 Spontaneous brain activity in the PRL and POL groups. (A) The different ALFF regions between the PRL and POL groups. (B) Significant difference of brain activity in cerebrum. The red regions indicate higher ALFF values, and the green and blue regions imply lower AFLL values.
Abbreviations: ALFF, amplitude of low-frequency fluctuation; L, left; R, right.
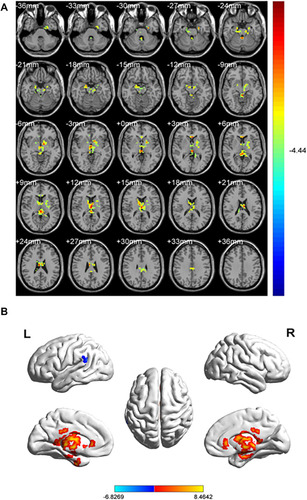
Figure 3 The mean ALFF values between PRL and POL groups.
ROC Curve
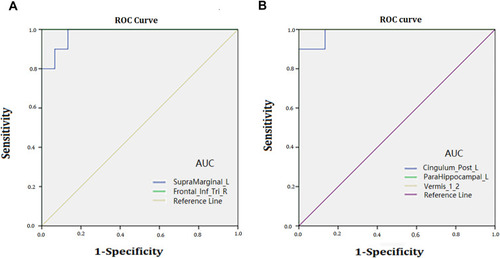
It can be recognized from the diagnostic markers that differences in ALFF existed between the POL and PRL groups, as assessed by the ROC curve. The areas under the curve are presented in and are as follows: SupraMarginal_L (0.980, P<0.001), Frontal_Inf_Tri_R (0.980, P<0.001), Cingulum_Post_L (0.987, P<0.001), ParaHippocampal_L (0.987, P<0.001), and Vermis_1_2 (0.987, P<0.001).
Figure 4 ROC curve analysis of the mean ALFF values for altered brain regions. (A) The area under the ROC curve was 0.980 (P<0.001; 95% CI=0.937–1.000) for SupraMarginal_L, Frontal_Inf_Tri_R 1.000 (P<0.001; 95% CI=1.000–1.000). (B) The area under the ROC curve was 0.987 (P<0.001; 95% CI=0.952–1.000) for Cingulum_Post_L; ParaHippocampal_L 1.000 (P<0.001; 95% CI=1.000–1.000); Vermis_1_2 1.000 (P<0.001; 95% CI=1.000–1.000).
Abbreviations: ALFF, amplitude of low-frequency fluctuation; AUC, area under the curve; ROC, receiver operating characteristic; L, left; R, right; Cingulum_Post_L, left posterior cingulate cortex; Frontal_Inf_Tri_R, right trigonometric inferior frontal gyrus.
Correlation Analysis
The results of the linear analysis showed that the values of HADS in the left parahippocampal gyrus (r=0.53, P=0.002) and left posterior cingulate cortex (r=0.16, P=0.144) were both negatively correlated with ALFF signal values in these two brain areas ().
Figure 5 Correlations between the HADS and ALFF values of left parahippocampal gyrus and left posterior cingulate cortex. The results shown in (A) and (B) both represent a negative correlation with the HADS and ALFF values in left parahippocampal gyrus and left posterior cingulate cortex, respectively.
Abbreviations: HADS, Hospital Anxiety and Depression Scale; ALFF, amplitude of low-frequency fluctuation.
Discussion
To our knowledge, this is the first study aimed at determining whether differences in ALFF values in brain regions exist between the same patient before and after the Lasik operation, as well as where the regions are located and how the values vary.
Analysis of Low ALFF Values in the POL Group
The areas that showed lower ALFF values after Lasik were the left supramarginal gyrus (SMG) and right trigonometric inferior frontal gyrus ().
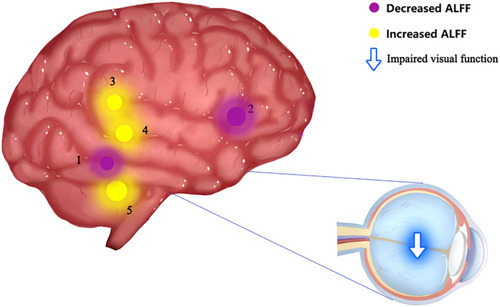
Figure 6 Significant differences in spontaneous brain activity between the PRL and POL groups. Different brain regions that were observed: 1) SupraMarginal_L; 2) Frontal_Inf_Tri_R; 3) Cingulum_Post_L; 4) ParaHippocampal_L; and 5) Vermis_1_2. The yellow areas present brain areas with increased ALFF values, and the purple areas present brain areas with decreased ALFF values.
Abbreviations: ALFF, amplitude of low-frequency fluctuation; L, left; R, right; Cingulum_Post_L, left posterior cingulate cortex; Frontal_Inf_Tri_R, right trigonometric inferior frontal gyrus.
The SMG comprises part of the parietal lobe, which is known as Brodmann area 40,Citation16 and it is equipped with the functions of melody processing, short-term memory,Citation17,Citation18 and visual word recognition.Citation19 ALFF reflected activities of neurons in particular regions of the brain: increased ALFF values indicated a more active state and vice versa.Citation17 A previous study claimed that it detected an overactive turbulence in SMG for patients with monocular blindness.Citation20 Instead, we recorded lower ALFF values in POL patients, which may reflect a rather normal state of SMG after Lasik surgery as well as an improved visual function, indicating the surgery should be efficient. Furthermore, Zeng et alCitation17 discovered that neuronal activities of SMG were decreased in post-stroke depression (PSD) patients, suggesting abnormality of SMG contributed to outcomes of depression. This study may link the potential mechanism of depression with hypoactivity of SMG, and as we detected a decreased ALFF value in POL patients, it may suggest the emotional state of patients was not cheered up after the surgery.
The inferior frontal gyrus (IFG), located in the frontal lobe, has the function of language understanding,Citation21 and the triangular part of it is the grammar center.Citation22 Besides, the right IFG participates in inhibition and attention.Citation23 And a previous study showed lower ALFF values can be detected in the right IFG region of severe myopia patients.Citation24 And as we recorded the similar tendency of neuronal activities, it could be concluded that visual deficiency still occurred even for patients who took Lasik surgery. Thus, the Lasik surgery just partially corrected visual deficiency rather than fully compensated the visual impairment.
Analysis of Higher ALFF Values in the POL Group
The areas that showed higher ALFF values after Lasik were the left parahippocampal gyrus (PHG), cerebellar vermis, and left posterior cingulate cortex ().
The PHG, comprising part of the medial temporal lobe, is located between the hippocampus and fusiform cortex.Citation25 PHG holds a variety of important functions that make it a vital portion of our brain, including scene perception,Citation26,Citation28 spatial representation,Citation29,Citation31 emotional processing,Citation32,Citation35 and episodic memory.Citation25 Besides, dysfunctions of PHG is believed to be related to diseases such as bipolar disorderCitation36 and schizophrenia.Citation37 A previous study showed a hypoactive state of PHG in severe myopia patients,Citation20 indicating severe visual dysfunctions could be related to neuronal activity alterations such as decreased PHG activities. And, the higher ALFF values recorded in our study may indicate compensatory recovery of PHG function after Lasik surgery. Patients thus should represent an elevated state of visuospatial processing. According to HADS results, we observed that patients with higher activities in the left parahippocampal gyrus showed less nervous emotional states, which indicated that patients had a more relaxed emotional state after Lasik surgery ().
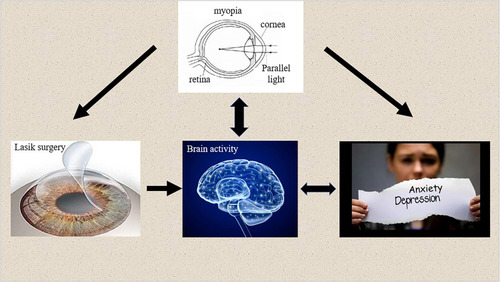
Figure 7 The relationship between changes in internal eye states and vision, brain activity, and emotional state.
There is a longitudinally narrow structure running through the cerebellum, which is curled up like a worm and is called the vermis. The cerebellum is the center of balance and motor control.Citation38 Furthermore, it has also been confirmed to participate in oculomotor processing, in which the vermis has been believed to play a role.Citation39 Vermis activity was altered through visually guided saccades,Citation40 as well as in patients with convergence insufficiency, a prevalent binocular vision disorder.Citation41 Higher ALFF values recorded in POL groups indicated hyperactivity of the vermis. And we speculated a better vision for patients who took the surgery.
The cingulate cortex is located at the medial aspect of the cerebral cortex,Citation42 and the posterior cingulate cortex (PCC) forms part of the posteromedial cortex.Citation43 They comprise part of the limbic system.Citation42 The posterior cingulate cortex is a highly active brain area, with the role of cognition,Citation43 eye movement,Citation44 and visuospatial processing.Citation44 The abnormal structure of the PCC is related to diseases such as Alzheimer’s disease,Citation45 and the disordered neuronal activity in PCC can lead to depression, schizophrenia, and some other diseases.Citation46 We observed higher ALFF values in post-surgery patients that indicated the hyperactivity of the PCC area in the brain. We speculated that the hyperactivity of PCC should be correlated to improved visual functions. And, based on the HADS, we observed that the more active the left posterior cingulate cortex was, the less anxious the patients felt, which may indicate that patients are in a better emotional state after Lasik surgery ().
Conclusion
In summary, we demonstrated significant fluctuations of ALFF values in specific brain areas between the same patients before and after Lasik surgery. The altered ALFF values reflected the hyperactivity or hypoactivity of the brain areas, some of which may indicate better visual function for patients after Lasik; however, how the emotional state changed in patients cannot be determined with certainty ().
Table 3 Brain Regions with Altered ALFF Values and the Potential Impacts
Inevitably, some limitations of our study exist. First, the small sample size may affect the reliability of the results. Second, the differences in vision between patients before the Lasik surgery may affect the recovery level after the surgery. Third, differences in the duration of myopia in patients may also add uncertainty to the final results.
Despite these limitations, the study still provided information on the altered activity in different brain areas. In future research, selecting patients based on more rigorous criteria could increase the accuracy of the results.
Ethics Approval and Consent to Participate
All procedures involving human participants were conducted in accordance with the ethical standards of the Ethical Committee of the First Affiliated Hospital of Nanchang University and with the 1964 Declaration of Helsinki and its later amendments, or comparable ethical standards. The registration number is CDYFY 16021.
Disclosure
This was not an industry supported study. The authors report no conflicts of interest in this work.
Additional information
Funding
References
- Gan JH, Li SM, Kang MT, Wang NL. Research on the status of the social factors for myopia. Rec Adv Ophthalmol. 2018;38(11):1094–1096.
- Cooper J, Tkatchenko AV. A review of current concepts of the etiology and treatment of myopia. Eye Contact Lens. 2018;44(4):231–247. doi:10.1097/ICL.000000000000049929901472
- Ramamurthy D, Lin Chua SY, Saw SM. A review of environmental risk factors for myopia during early life, childhood and adolescence. Clin Exp Optom. 2015;98(6):497–506. doi:10.1111/cxo.1234626497977
- Gao Y. Discussion on clinical safety management of laser refractive surgery in patients with myopia. Smart Healthcare. 2019;5(6).
- Biscevic A, Pidro A, Pjano MA, Grisevic S, Ziga N, Bohac M. Lasik as a solution for high hypermetropia. Med Arch. 2019;73(3):191–194. doi:10.5455/medarh.2019.73.191-19431402804
- Toda I. Dry eye after LASIK. Invest Ophthalmol Vis Sci. 2018;59(14):DES109–DES115. doi:10.1167/iovs.17-2353830481814
- Seven I, Vahdati A, De Stefano VS, Krueger RR, Dupps WJ. Comparison of patient-specific computational modeling predictions and clinical outcomes of LASIK for myopia. Cornea. 2016;57(14):6287–6297.
- Yousaf T, Dervenoulas G, Politis M. Advances in MRI methodology. Int Rev Neurobiol. 2018;141:31–76.30314602
- Zhu PW, Li QH, Shao Y. The application of functional magnetic resonance imaging to optic neuritis. Chin J Magn Reson Imaging. 2018;9(8):570–573.
- Ye L, Kang HH, Shao Y. Application of amplitude of low-frequency fluctuation in ocular disease. Chin J Magn Reson Imaging. 2019;10(5):397–400.
- Logothetis NK, Pauls J, Augath M, Trinath T, Oeltermann A. Neurophysiological investigation of the basis of the fMRI signal. Nature. 2001;412(6843):150–157. doi:10.1038/3508400511449264
- Guo MX, Dong HH, Zhang YT, Zhang Q, Yin XH. ALFF changes in brain areas of human with high myopia revealed by resting-state functional MRI. In: International Conference on Biomedical Engineering and Informatics (1 91–94); IEEE; 2010.
- Huang X, Zhou FQ, Hu YX, et al. Altered spontaneous brain activity pattern in patients with high myopia using amplitude of low-frequency fluctuation: a resting-state fMRI study. Neuropsychiatr Dis Treat. 2016;12:2949–2956.27881920
- Liu X, Yan Z, Wang T, et al. Connectivity pattern differences bilaterally in the cerebellum posterior lobe in healthy subjects after normal sleep and sleep deprivation: a resting-state functional MRI study. Neuropsychiatr Dis Treat. 2015;11:1279–1289. doi:10.2147/NDT.S8420426064046
- Yu-Feng Z, Yong H, Chao-Zhe CZ, et al. Altered baseline brain activity in children with ADHD revealed by resting-state functional MRI. Brain Dev. 2007;29(2):83–91. doi:10.1016/j.braindev.2006.07.00216919409
- Hu YX, He JR, Yang B, et al. Abnormal resting-state functional network centrality in patients with high myopia: evidence from a voxel-wise degree centrality analysis. Int J Ophthalmol. 2018;11(11):1814–1820. doi:10.18240/ijo.2018.11.1330450313
- Zeng Y, Wang X, Huang Z, Zhao Y, Ma ZR. Changes of cerebral resting amplitude of low frequency fluctuation in patients with post-stroke depression and its relationship with clinical symptoms. J Int Psychl. 2018;45(2):305–307.
- Song K, Li J, Zhu YQ, et al. Altered small-world functional network topology in patients with optic neuritis: A resting-state fMRI study. bioRxiv. 2020. doi:10.1101/20200609.141432
- Stoeckel C, Gough PM, Watkins KE, Devlin JT. Supramarginal gyrus involvement in visual word recognition. Cortex. 2009;45(9):1091–1096. doi:10.1016/j.cortex.2008.12.00419232583
- Li Q, Huang X, Ye L, et al. Altered spontaneous brain activity pattern in patients with late monocular blindness in middle-age using amplitude of low-frequency fluctuation: a resting-state functional MRI study. Clin Interv Aging. 2016;11:1773–1780. doi:10.2147/CIA.S11729227980398
- Manjaly ZM, Marshall JC, Stephan KE, Gurd JM, Zilles K, Fink GR. Context-dependent interactions of left posterior inferior frontal gyrus in a local visual search task unrelated to language. Cogn Neuropsychol. 2005;22(3):292–305. doi:10.1080/0264329044200014921038251
- Nauchi A, Sakai KL. Greater leftward lateralization of the inferior frontal gyrus in second language learners with higher syntactic abilities. Hum Brain Mapp. 2009;30(11):3625–3635. doi:10.1002/hbm.2079019399820
- Hampshire A, Chamberlain SR, Monti MM, Duncan J, Owen AM. The role of the right inferior frontal gyrus: inhibition and attentional control. Neuroimage. 2010;50(3):1313–1319. doi:10.1016/j.neuroimage.2009.12.10920056157
- Li Q, Huang X, Ye L, et al. Altered spontaneous brain activity pattern in patients with high myopia using amplitude of low-frequency fluctuation: a resting-state fMRI study. Neuropsychiatr Dis Treat. 2016;12:2949–2956.27881920
- Aminoff EM, Kveraga K, Bar M. The role of the parahippocampal cortex in cognition. Trends Cogn Sci. 2013;17(8):379–390. doi:10.1016/j.tics.2013.06.00923850264
- Epstein R, Kanwisher N. A cortical representation of the local visual environment. Nature. 1998;392:598–601. doi:10.1038/334029560155
- Ekstrom AD, Kahana MJ, Caplan JB, et al. Cellular networks underlying human spatial navigation. Nature. 2003;425:184–188. doi:10.1038/nature0196412968182
- Stevens WD, Kahn I, Wig GS, Schacter DL. Hemispheric asymmetry of visual scene processing in the human brain: evidence from repetition priming and intrinsic activity. Cereb Cortex. 2012;22:1935–1949. doi:10.1093/cercor/bhr27321968568
- Mullally SL, Maguire EA. A new role for the parahippocampal cortex in representing space. Neurosci. 2011;31:7441–7449. doi:10.1523/JNEUROSCI.0267-11.2011
- Park S, Brady TF, Greene MR, Oliva A. Disentangling scene content from spatial boundary: complementary roles for the parahippocampal place area and lateral occipital complex in representing real-world scenes. Neurosci. 2011;31:1333–1340. doi:10.1523/JNEUROSCI.3885-10.2011
- Kravitz DJ, Peng CS, Baker CI. Real-world scene representations in high-level visual cortex: it’s the spaces more than the places. Neurosci. 2011;31:7322–7333. doi:10.1523/JNEUROSCI.4588-10.2011
- Smith APR, Henson RNA, Dolan RJ, Rugg MD. fMRI correlates of the episodic retrieval of emotional contexts. NeuroImage. 2004;22:868–878. doi:10.1016/j.neuroimage.2004.01.04915193617
- Gosselin N, Samson S, Adolphs R, et al. Emotional responses to unpleasant music correlates with damage to the parahippocampal cortex. Brain. 2006;129:2585–2592. doi:10.1093/brain/awl24016959817
- Mitterschiffthaler MT, Fu CH, Dalton JA, Andrew CM, Williams SC. A functional MRI study of happy and sad affective states induced by classical music. Hum Brain Mapp. 2007;28:1150–1162. doi:10.1002/hbm.2033717290372
- den Stock JV, Vandenbulcke M, Sinke CB, de Gelder B. Affective scenes influence fear perception of individual body expressions. Hum Brain Mapp. 2014;35:492–502.23097235
- Wang AY, Lohmann KM, Yang CK, et al. Bipolar disorder type 1 and schizophrenia are accompanied by decreased density of parvalbumin- and somatostatin-positive interneurons in the parahippocampal region. Acta Neuropathol. 2011;122(5):615–626. doi:10.1007/s00401-011-0881-421968533
- Diederen KM, Neggers SF, Daalman K, et al. Deactivation of the parahippocampal gyrus preceding auditory hallucinations in schizophrenia. Am J Psychiatry. 2010;167(4):427–435.20123912
- Herzfeld DJ, Kojima Y, Soetedjo R, Shadmehr R. Encoding of action by the Purkinje cells of the cerebellum. Nature. 2015;526(7573):439–442. doi:10.1038/nature1569326469054
- Guillaume A, Fuller JR, Srimal R, Curtis CE. Cortico-cerebellar network involved in saccade adaptation. J Neurophysiol. 2018;120(5):2583–2594. doi:10.1152/jn.00392.201830207858
- Hayakawa Y, Nakajima T, Takagi M, Fukuhara N, Abe H. Human cerebellar activation in relation to saccadic eye movements: a functional magnetic resonance imaging study. Ophthalmologica. 2002;216(6):399–405. doi:10.1159/00006755112566881
- Alvarez TL, Jaswal R, Gohel S, Biswal BB. Functional activity within the frontal eye fields, posterior parietal cortex, and cerebellar vermis significantly correlates to symmetrical vergence peak velocity: an ROI-based, fMRI study of vergence training. Front Integr Neurosci. 2014;8:50. doi:10.3389/fnint.2014.0005024987340
- Cheng Y, Huang X, Hu YX, et al. Comparison of intrinsic brain activity in individuals with low/moderate myopia versus high myopia revealed by the amplitude of low-frequency fluctuations. Acta Radiol. 2020;61:496–507.31398992
- Leech R, Sharp DJ. The role of the posterior cingulate cortex in cognition and disease. Brain. 2014;137(1):12–32. doi:10.1093/brain/awt16223869106
- Dean HL, Crowley JC, Platt ML. Visual and saccaderelated activity in macaque posterior cingulate cortex. J Neurophysiol. 2004;92:3056–3068. doi:10.1152/jn.00691.200315201314
- Greicius MD, Srivastava G, Reiss AL, Menon V. Default-mode network activity distinguishes Alzheimer’s disease from healthy aging: evidence from functional MRI. Proc Natl Acad Sci USA. 2004;101(13):4637–4642. doi:10.1073/pnas.030862710115070770
- Greicius M. Resting-state functional connectivity in neuropsychiatric disorders. Curr Opin Neurol. 2008;21(4):424–430. doi:10.1097/WCO.0b013e328306f2c518607202