
Abstract
Background
Deregulation of long non-coding RNAs (lncRNAs) is frequently relevant to the malignant phenotypical changes. This study aimed to explore the role of lncRNA GABPB1-AS1 in the malignancy of glioma cells.
Methods
Abnormally expressed genes in glioma were analyzed using a GEO GSE2223 dataset. Short hairpin (sh) RNA silencing of GABPB1-AS1 was introduced in glioma cells to explore its correlation with the proliferation, apoptosis, and invasiveness of cancer cells. The target transcripts of GABPB1-AS1 were predicted by bioinformatics analyses. MicroRNA (miR)-330 inhibition was additionally introduced in the glioma cells after GABPB1-AS1 knockdown for rescue experiments. Animal studies were performed by inducing xenograft tumors in nude mice.
Results
GABPB1-AS1 was highly expressed in the glioma tissues and associated with advanced WHO grades. GABPB1-AS1 knockdown reduced proliferation and invasiveness of glioma cells in vitro and in vivo. miR-330 was a target transcript of GABPB1-AS1. miR-330 inhibition restored the malignancy of glioma cells. miR-330 directly bound to ZNF367. ZNF367 was highly expressed in glioma tissues and positively correlated with GABPB1-AS1 expression, and it was relevant to the cell cycle signaling pathway. Downregulation of GABPB1-AS1 reduced the expression of ZNF367 and reduced the levels of cell cycle-related proteins PCNA, CDC20, CDC7 and CCNA1 in cells.
Conclusion
This study demonstrated that GABPB1-AS1 competitively bound to miR-330 and de-repressed ZNF367 expression, leading to activation of the cell cycle signaling pathway and the growth and metastasis of glioma cells.
Introduction
Glioma, which arises in the glial tissue and primarily occurs in the brain, is the most common type of primary intracranial tumor which accounts for approximately 81% of malignant brain tumors and represents considerable mortality and morbidity.Citation1 Glioma is characterized by aggressive growth, necrosis, and angiogenesis.Citation2 Glioma is classified into four grades (I–IV grades) by World Health Organization (WHO): Grade I and II (astrocytomas, oligodendrogliomas, pleomorphic xanthoastrocytomas, and certain ependymomas), highly malignant Grade III (anaplastic astrocytomas, anaplastic oligodendrogliomas, and anaplastic ependymoma) and Grade IV (glioblastoma, GBM).Citation2,Citation3 GBM represents the most malignant type and the most common type as well (∼45% of all gliomas), which leads to an extremely low 5-year survival rate of approximately 5%.Citation1 The current clinical treatment for glioma includes surgical resection, conventional chemotherapy and radiotherapy, targeted therapy and immunotherapy.Citation4 Unfortunately, the prognosis remains unfavorable with a rather high recurrence rate after initial treatment, particularly for high-grade glioma.Citation5 Identifying effective options for glioma management is of great importance, which requires further understanding in the molecules involved in the pathogenesis of this malignancy.
Long non-coding (lncRNAs) represent a class of ncRNAs over 200 nucleotides in length whose deregulation is frequently involved in tumorigenesis and the malignant phenotypical changes.Citation6 This is also true for glioma since the functions of lncRNAs have been increasingly recognized in glioma through targeting microRNAs (miRNAs) and signaling pathways.Citation7 miRNAs are another major type of ncRNAs regulating a broad array of biological processes through their potent regulation on thousands of protein-coding mRNAs.Citation8,Citation9 There has been a endogenous RNA (ceRNA) theory which suggests that when localizing in cytoplasm, some transcripts including lncRNAs may sequester a miRNA and then block its inhibitory functions on other transcripts.Citation10,Citation11 Such RNA interactions have been observed involved in the pathogenesis in glioma.Citation12,Citation13 In this paper, according a GSE2223 dataset from the Gene Expression Omnibus (GEO) database, GA binding protein transcription factor beta subunit 1 antisense RNA 1 (GABPB1-AS1) was indicated as a significantly upregulated lncRNA in glioma. This lncRNA was first identified in human-induced pluripotent stem cells and was highly expressed in cells under the chemical stresses.Citation14 The relevance of GABPB1-AS1 to tumorigenesis has been rarely concerned. Our subsequent integrated bioinformatics analyses suggested a candidate GABPB1-AS1/miR-330/zinc finger protein 367 (ZNF367) axis in glioma. Either oncogenicCitation15,Citation16 or tumor suppressive functionsCitation17,Citation18 of miR-330 have been reported, which might be attributed to the different target genes involved. ZNF367 is a member of zinc finger proteins with a unique zinc finger motif comprises two contiguous Cys2His2-type fingers.Citation19 The zinc finger factors are one of the largest transcription factor family of human genome and are frequently involved in cancer onset and progression.Citation20,Citation21 The function of ZNF-367 in glioma remains unexplored. Here, we supposed that GABPB1-AS1 serves as a ceRNA for ZNF367 and upregulates its expression by competing with miR-330.
Materials and Methods
Bioinformatic Analysis
A GSE2223 dataset comprising gene expression data of 4 normal brain tissues and 29 glioma tissues was obtained from the GEO database. Differentially expressed genes were identified with the thresholds of |Log FC > 2| and p < 0.05. The heatmaps were produced using a pHeatmap Package. Sub-cellular localization of GABPB1-AS1 in cells was predicted on the bioinformatics system LncAtlas (LncAtlas.org). Genes show a strong correlation (an over 0.5 correlation coefficient) with ZNF367 in TCGA-GBM database were searched on the UALCAN website (http://ualcan.path.uab.edu/index.html). A Kyoto Encyclopedia of Genes and Genomes (KEGG) pathway enrichment analysis was conducted using the DAVID 6.8 bioinformatic system (https://david.ncifcrf.gov/tools.jsp).
Collection of Clinical Samples
The tumor samples from glioma patients and normal tissues were obtained from the neurosurgery department of Caoxian People’s Hospital. This research was ratified by the Ethics Committee of Caoxian People’s Hospital. All procedures were conducted according to the Declaration of Helsinki. Signed informed consents were received from the respondents. The resected brain tumors (n = 58) were collected from May 2015 to May 2019. All tumor tissues were diagnosed as glioma through clinical and histopathological examination. Normal brain tissues were collected at a same period from 14 patients who underwent surgical resection for craniocerebral trauma. All tissue samples were rinsed by phosphate-buffered saline (PBS) after surgery, cut into pieces, soaked in RNAhold (TransGen Biotech., Beijing, China), and stored at −80°C until subsequent use.
Reverse Transcription Quantitative Polymerase Chain Reaction (RT-qPCR)
Total RNA from cells or tissues was isolated using the TRIzol reagent (Invitrogen, Thermo Fisher Scientific Inc., Waltham, MA, USA). Then, 1 μg RNA, quantified by NanoDrop ND-3300 (Thermo Fisher Scientific), was reverse-transcribed into cDNA using a GoScript Reverse Transcription System (Promega Corp., Madison, WI, USA). Real-time qPCR was conducted using TransStart Top Green qPCR SuperMix (+ Dye II) (TransGen) on an ABI Q5 sequence detection system (Applied Biosystems, Foster City, CA, USA). A Bulge-Loop miRNA-specific primer (RiboBio Co., Ltd., Guangzhou, Guangdong, China) was used to measure the expression of miR-330 in line with the manufacturer’s instructions. The primers are listed in , in which U6 was used as the internal loading for miRNA while glyceraldehyde-3-phosphate dehydrogenase (GAPDH) was used as the internal loading for genes. Relative gene expression was examined using the 2−ΔΔCt method. All primers were produced by Sangon Biotech Co., Ltd. (Shanghai, China).
Table 1 Primer Sequences for RT-qPCR
Cell Culture and Treatment
Glioma cell lines LN229 (GBM, CRL-2611, American Type Culture Collection, Manassas, VA, USA), U251 (astrocytoma, GDC0093, China Center for Type Culture Collection, Wuhan, Hubei, China), SHG44 (astrocytoma, CCRID; 3131C0001000700048, Biomedical Cell Resource, Beijing, China) and a human astrocyte cell line (A735, Cell Bank of Chinese Academy of Sciences, Shanghai, China) were used. All cells were maintained in DMEM supplemented with 10% fetal bovine serum (Gibco Company, Grand Island, NY, USA). The cells were cultured at 37°C in a humidified incubator enriched with 5% CO2. Exponentially growing LN229 and U251 cells were transfected with short hairpin RNA (shRNA) of GABPB1-AS1: shRNA-#1 (CUGUUGAAAGACGGAGAGUTT) and shRNA-#2 (AUGGCUUUCCCAACCUAGUTT), or transfected with miR-330 mimic (UCUCUGGGCCUGUGUCUUAGGC) and the corresponding negative controls (NC) using Lipofectamine 2000 (Invitrogen, Thermo Fisher Scientific) according to the manufacturer’s instructions. After 48 h, the cells were harvested for subsequent use.
Cell Counting Kit-8 (CCK-8) Method for Cell Proliferation
Exponentially growing cells were cultured in 96-well plates at 100 μL (1 × 10³ cells) per well. Three duplicated wells were set for each group. Each well was filled with 10 µL CCK-8 solution (Beyotime Biotechnology Co. Ltd., Shanghai, China) at the 24th, 48th, and 72nd h, respectively, followed by another 1 h of incubation at 37°C. The optical density (OD) at 450 nm was evaluated using a microplate reader, and the cell proliferation curves were produced 4 d later.
Flow Cytometry for Cell Apoptosis
After transfection, U251 and SHG44 cells were cultured in 6-well plates at 2×10⁵ cells per well. The cells were centrifuged and resuspended in Annexin V binding buffer, and then stained using a fluorescein isothiocyanate (FITC)/propidium iodide (PI) staining kit (RiboBio) according to the manufacturer’s instructions. The apoptosis rate in cells was analyzed using a Gallios flow cytometer (Beckman Coulter, Inc., Chaska, MN, USA).
Transwell Assay for Cell Migration and Invasion
After transfection, the U251 and SHG44 cells were resuspended and adjusted in serum-free medium to 5×10⁵ cells/mL. Then, 200 μL cell suspension was filled into the Transwell apical chambers (8 μm in diameter, Corning Glass Works, Corning, NY, USA). The basolateral chambers were filled with 10% FBS-supplemented medium. Three duplicate chambers were set for each group. Cells were incubated at 37°C with 5% CO2. After 48 h, cells migrated into the basolateral chambers were fixed in absolute alcohol for 15 min and stained with 0.1% crystal violet for 20 min. The average number of migrated cells was collected from five random fields under the microscope. Cell invasion was examined in a similar manner with the additional precoating of Matrigel (Millipore, Bedford, MA, USA) in the apical chambers.
Animal Experiments
All animal studies were performed under the approval of the Ethics Committee of Caoxian People’s Hospital. All animal procedures were performed in compliance with the Guide for the Care and Use of Laboratory Animals published by the National Institutes of Health (NIH, Bethesda, Maryland, USA). The report of animal experiments is in accordance with the ARRIVE guidelines. NOD/SCID mice (6–8 weeks old) were acquired from SLAC Laboratory Animal Co., Ltd. (Shanghai, China). U251 and SHG44 cells stably transfected with sh-GABPB1-AS1 were administrated into nude mice through subcutaneous injection (for tumor growth assay) or tail vein injection (for metastasis assay) (1 × 10⁶ cells/20 µL per mouse). For the growth of xenograft tumors, the tumor size was examined every 5 d using a standard caliper. The tumor volume (V) was calculated as a × b2/2, where “a” indicates the length while “b” indicates the width. The mice were euthanized on the 30th d, and the tumors were collected and weighed. In the metastasis assay, the animals were euthanized on the 45th d, and the lung and liver tissues from mice were collected for hematoxylin and eosin (HE) staining. For animal euthanasia, at the end point, the anaesthetized mice were intraperitoneally injected with an over dose of pentobarbital sodium (150 mg/kg). The animal death was confirmed by the loss of nerve reflex and blink reflex, respiratory arrest and loss of heartbeat rather than cardiac arrest 30 min after injection.
Immunohistochemical (IHC) Staining
The xenograft tumor samples were fixed in formalin overnight, dehydrated, embedded in paraffin, and cut into 5-μm sections. Then, the sections were dewaxed, and the section slides were blocked using 5% normal goat serum, and the incubated with anti-Ki67 (ab15580, Abcam Inc., Cambridge, MA, USA) at 4°C overnight. After three PBS washes, the sections were further incubated with horseradish peroxidase (HRP)-conjugated secondary antibody (ab6721, Abcam) at 37°C for 2 h. Next, the sections were counter-stained with hematoxylin. The positive staining was examined using the Image J software.
Cytoplasmic and Nuclear RNA Separation Assay
The cytoplasmic and nuclear RNA of cells was separated using a nuclear RNA separation kit (Keygen Biotech Co., Ltd., Nanjing, Jiangsu, China) according to the instructions of the manufacturer. The distribution of GABPB1-AS1 in U251 and SHG44 cells was determined using RT-qPCR. U6 was used as the internal loading for the measurement of nuclear RNA, while GAPDH was used as the control for the measurement of cytoplasmic RNA.
Dual-Luciferase Reporter Gene Assay
The wild type (wt) GABPB1-AS1 or ZNF367 sequences containing the putative binding site with miR-330 were synthetized and cloned into pmiRGLO luciferase reporter vectors to construct GABPB1-AS1-wt and ZNF367-wt vectors. The mutant type (mt) vectors were constructed based on the mutant binding (mt) sites accordingly and named GABPB1-AS1-mt and ZNF367-mt vectors, respectively. Well-constructed vectors were co-transfected with miR-330 mimic or mimic control into HEK293T cells (ATCC, Manassas, VA, USA). After 48 h, the cells were collected and lysed. Relative luciferase activity in cells was determined using a Dual-Luciferase-Reporter-Gene System (Promega, Madison, WI, USA). The activity of firefly luciferase was normalized to the activity of the Renilla luciferase.
RNA Pull-Down Assay
An RNA pull-down assay was examined using a PureBinding RNA-Protein pull-down Kit (GENESEED, Guangzhou, Guangdong, China). In short, SHG44 and U251 cell lysates were transfected with biotinylated GABPB1-AS1 probe (Bio-GABPB1-AS1-probe) or a negative control probe (Bio-NC-probe). At 48 h after transfection, the complexes were collected. The miR-330 level in the complexes was examined using RT-qPCR.
Western Blot analysis
Cells were lysed in radio-immunoprecipitation assay cell lysis buffer (Thermo Fisher Scientific) to extract total protein. The protein concentration was examined using a bicinchoninic acid kit (Bio-Rad, Inc., Hercules, CA, USA). Then, the protein was separated on 10% SDS-PAGE and transferred onto polyvinylidene fluoride membranes. The membranes were blocked in 5% non-fat milk for 2 h and then incubated with the primary antibodies against proliferating cell nuclear antigen (PCNA, ab29, Abcam), CDC20 (#PA5-63103, Invitrogen, Thermo Fisher Scientific), CDC7 (ab229187, Abcam), cyclin A1 (CCNA1, #PA5-16519, Invitrogen, Thermo Fisher Scientific), GABPB1 (ab88746), telomerase reverse transcriptase (TERT, ab32020, Abcam) and GAPDH (ab8245, Abcam) at 4°C for 2 h, and then incubated with HRP-labeled secondary antibody (ab6721, Abcam) at 25°C for 1 h. The protein blots were developed using an enhanced chemiluminescence kit (Millipore, Corp. Billerica, MA, USA), and the protein expression was quantified using the Image J software.
Statistical Analysis
SPSS system (version 23.0, IBM Corp., Armonk, NY, USA) and Prism software (version 7.0, GraphPad, La Jolla, CA, USA) were used for data analysis. Data were collected from three independent experiments and expressed as the mean ± standard deviation (SD). Differences were compared by the Student’s t-test, and one-way or two-way analysis of variance (ANOVA) was used for multiple data groups. Correlations between GABPB1-AS1 and miR-330 as well as ZNF367 in human tissue samples were analyzed by Spearman’s rank test. The diagnostic value of GABPB1-AS1 on glioma was evaluated using a receiver operating characteristic (ROC) curve. p was obtained from two-tailed tests, and p < 0.05 was considered statistically significant.
Results
LncRNA GABPB1-AS1 is Highly Expressed in Glioma Samples
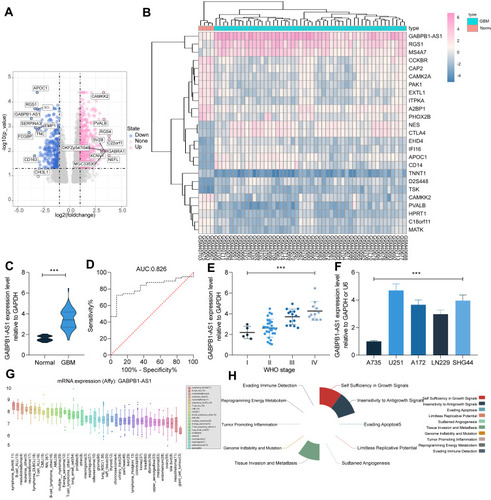
First, abnormally expressed genes in glioma were analyzed using a GSE2223 dataset containing gene expression data of 4 cases of normal brain tissues and 29 cases of glioma tissues. GABPB1-AS1 was indicated as a significantly highly expressed lncRNA in glioma in the setting of Log FC > 2 ( and ). A similar trend was validated in the collected normal brain tissues (n = 14) and glioma tissues (n = 58), where we confirmed an upregulation of GABPB1-AS1 in the glioma tissue samples using RT-qPCR (). Next, a ROC curve was produced, which suggested that GABPB1-AS1 has an ideal diagnostic value in patients, and the area under curve (AUC) was 0.826 (1 indicates a 100% value) (). We also analyzed the correlation between GABPB1-AS1 expression and the WHO grade of the patients. It was found that patients in advanced WHO grades had significant increased expression of GABPB1-AS1 (). Next, expression of GABPB1-AS1 in the glioma cell lines (LN229, U251, SHG44 and A172) and in the astrocyte cell-line A735 was examined using RT-qPCR. A similar trend was found in cells that high expression of GABPB1-AS1 was found in all glioma cell lines compared to A735 cells (). In addition, we analyzed the GABPB1-AS1 expression profiles in different cancer cells using the CCLE bioinformatic system (https://portals.broadinstitute.org/ccle/about). Interestingly, it was suggested that the level of GABPB1-AS1 was in the middle of the graph (). Further, we predicted the major functions of GABPB1-AS1 in different cancer cell using the LnCecell system (http://www.bio-bigdata.net/LnCeCell/). It was indicated that GABPB1-AS1 was closely correlated with the proliferation and metastasis of cancer cells ().
Figure 1 LncRNA GABPB1-AS1 is highly expressed in glioma samples. (A and B) differentially expressed mRNAs and lncRNAs between glioma tissues and normal tissues analyzed using a GEO GSE2223 dataset; (C) expression of GABPB1-AS1 in collected normal brain tissues (n = 14) and glioma tissues (n = 58) examined by RT-qPCR; (D) diagnostic value of GABPB1-AS1 in glioma analyzed using a ROC; (E) correlation of GABPB1-AS1 expression with the glioma grade in patients; (F) GABPB1-AS1 expression in glioma cell lines LN229, U251, SHG44 and A172 and in the astrocyte cell line A735 examined by RT-qPCR; (G) expression of GABPB1-AS1 in different type of cancer cells predicted using CCLE bioinformatic system; (H) major roles of GABPB1 in cancer cells predicted using the LnCecell system. Data were collected from three independent experiments and expressed as the mean ± SD. Data were analyzed by unpaired t-test (C) or one-way ANOVA (E and F). ***p < 0.001 vs Normal/Grade I/A735 cells.
GABPB1-AS1 Knockdown Suppresses Growth and Invasiveness of Glioma Cells in vitro
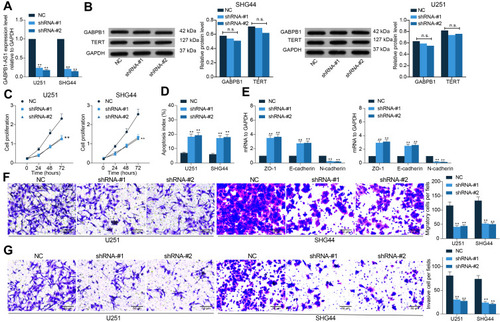
As shown in , the U251 and SHG44 cells showed the highest expression of GABPB1-AS1 among the four glioma cell lines. Therefore, these two cell lines were selected for the functional experiments. To confirm the role of GABPB1-AS1 in glioma, two shRNAs of GABPB1-AS1 were transfected into U251 and SHG44 cells, and the successful knockdown of GABPB1-AS1 was confirmed by RT-qPCR (). ETS family transcription factors GABPA and GABPB1 have been shown as master drivers for the mutant TERT promoter activity, which is a prerequisite step in malignant transformation and progression.Citation22 Therefore, there is a possibility that GABPB1-AS1 affects GABPB1 expression and resultantly affects the mutation of the TERT promoter to influence the glioma cell progression. We therefore examined the levels of GABPB1 and TERT in U251 and SNG44 cells after GABPB1-AS1 knockdown. However, the protein levels of GABPB1 and TERT in glioma cells, according to the Western blot analysis, were not significantly changed upon GABPB1-AS1 downregulation (). After that, we examined the viability of cells using a CCK-8 kit, which suggested that the proliferation of U251 and SHG44 cells was suppressed in the setting of GABPB1-AS1 knockdown (). The apoptosis of cells was then examined using flow cytometry. After GABPB1-AS1 downregulation, both the number of early apoptotic cells (Annexin V+PI−) and late apoptotic cells (Annexin V+PI+) was significantly increased (). Then, the expression of epithelial-mesenchymal transition (EMT)-related markers ZO-1, E-cadherin and N-cadherin in cells was examined using RT-qPCR. After GABPB1-AS1 knockdown, the expression of epithelial-marker proteins ZO-1 and E-cadherin in U251 and SHG44 cells was significantly elevated, while the expression of the mesenchymal-marker protein N-cadherin in cells was decreased (), indicating reduced EMT activity in cells. The direct relevance of GABPB1-AS1 to cell invasiveness was further examined by Transwell assays. After GABPB1-AS1 knockdown, it was found that the number of U251 and SHG44 cells migrated or invaded into the basolateral cells was significantly reduced ( and ).
Figure 2 GABPB1-AS1 knockdown suppresses growth of glioma cells. (A) transfection efficacy of shRNA-#1 and shRNA-#2 of GABPB1-AS1 in U251 and SHG44 cells examined by RT-qPCR; (B) protein levels of GABPB1 and TERT in U251 and SHG44 cells examined by Western blot analysis; (C) viability of cells after GABPB1-AS1 knockdown determined by the CCK-8 method; (D) apoptosis rate of U251 and SHG44 cells after GABPB1-AS1 knockdown examined by flow cytometry; (E) expression of EMT-related markers ZO-1, E-cadherin and N-cadherin in U251 and SHG44 cells after GABPB1-AS1 inhibition quantified by RT-qPCR; (F and G) migration (F) and invasion (G) abilities of U251 and SHG44 cells after GABPB1-AS1 downregulation detected by Transwell assays. Data were collected from three independent experiments and expressed as the mean ± SD. Data were analyzed by two-way ANOVA. **p < 0.01.
GABPB1-AS1 Knockdown Suppresses Growth and Metastasis of Glioma Cells in vivo
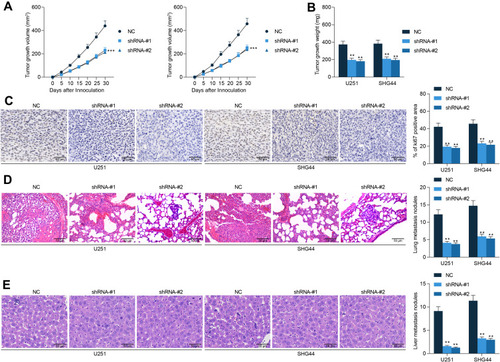
Following the findings above, we further analyzed the functions of GABPB1-AS1 in glioma cell growth in vivo. U251 and SHG44 cells stably transfected with sh-GABPB1-AS1 were implanted into nude mice through subcutaneous injection (for growth measurement) or tail vein injection (for metastasis measurement). The volume of the xenograft tumors was examined every 5 d. It was found that downregulation of GABPB1-AS1 reduced the growth rate of tumors in nude mice (). On the 30th d, the tumors were taken out and weighed. Accordingly, the weight of xenograft tumors was reduced on GABPB1-AS1 silencing (). In addition, the IHC staining confirmed that GABPB1-AS1 knockdown led to a decline in the staining intensity of Ki67 in the collected tumor tissues (). In the metastasis, the animals were euthanized on the 45th d, and then the HE staining results showed that the number of metastatic nodules in mouse lung and liver tissues formed by U251 and SHG44 cells was notably decreased upon GABPB1-AS1 knockdown ( and )
Figure 3 GABPB1-AS1 knockdown suppresses growth and metastasis of glioma cells in vivo. (A) growth rate of the xenograft tumors in nude mice within 30 d after subcutaneous injection of U251 and SHG44 cells; (B) weight of the xenograft tumors in nude mice on the 30th d; (C) Ki67 expression in the xenograft determined by IHC staining; (D and E) number of metastatic nodules in mouse lung and liver tissues observed by HE staining. N = 6 in each group. Data were collected from three independent experiments and expressed as the mean ± SD. Data were analyzed by two-way ANOVA. **p < 0.01, ***p < 0.001 vs NC group.
GABPB1-AS1 is Sub-Localized in Cytoplasm in Glioma Cells and Binds to miR-330
To further confirm the molecular mechanism of action, we first predicted the subcellular localization of GABPB1-AS1 in different type of cells using the LncAtlas system (LncAtlas.org). Both cytoplasm-localization and nucleus-localization of GABPB1-AS1 was found in cells (). Further, according to the data from the LnCeCell system, GABPB1-AS1 was suggested to be distributed in multiple compositions in cells (). Then, using a nuclear-cytoplasmic RNA separation assay, we confirmed a cytoplasm-abundance of GABPB1-AS1 in U251 and SHG44 cells (). Next, we explored the target miRNAs of GABPB1-AS1 using three bioinformatic systems including Starbase (http://starbase.sysu.edu.cn/), RNA22 (https://cm.jefferson.edu/rna22/) and DIANA (http://carolina.imis.athena-innovation.gr/diana_tools/web/index.php), and six common outcomes were predicted (). We then analyzed the expression profiles of the six miRNAs in TCGA-GBM database. It was suggested that miR-330 expression was notably downregulated in glioma tissues compared to healthy tissues (). In addition, poor expression of miR-330 was suggested to be correlated with unfavorable diagnosis in glioma patients (). To validate this, we examined the expression of miR-330 in the collected clinical tissue samples. It was found that miR-330 expression was notably reduced in the glioma tissues compared to the healthy brain tissues (), which showed an inverse correlation with the GABPB1-AS1 expression ().
Figure 4 GABPB1-AS1 is sub-localized in cytoplasm and binds to miR-330. (A and B) subcellular localization of GABPB1-AS1 in cells predicted using the Lncatlas and LnCeCell systems; (C) subcellular localization of GABPB1-AS1 in U251 and SHG44 confirmed by a cytoplasmic and nuclear RNA separation assay; (D) candidate target miRNAs of GABPB1-AS1 predicted using three bioinformatic systems (StarBase, RNA22 and DIANA); (E) expression profiles of miR-330, miR-582, miR-590, miR-744, miR-151a and miR-301 in glioma predicted using the TCGA-GBM database; (F) correlation between poor miR-330 expression with prognosis in glioma according to the data in the TCGA-GBM database; (G) expression of miR-330 in collected normal brain tissues (n = 14) and glioma tissues (n = 58) examined by RT-qPCR; (H) a negative correlation between miR-330 and GABPB1-AS1 in glioma tissues according to a Spearman’s rank test; (I) putative binding sequence between GABPB1-AS1 and miR-330 and the mutant sequence for the construction of luciferase reporter vectors; (J and K) binding relationship between GABPB1-AS1 and miR-330 validated through a luciferase reporter gene assay (J) and an RNA pull-down assay; (L) expression of miR-330 in glioma cell lines LN229, U251, SHG44 and A172 and in the astrocyte cell line A735 examined using RT-qPCR; (M) expression of miR-330 in U251 and SHG44 after GABPB1-AS1 knockdown determined by RT-qPCR. Data were collected from three independent experiments and expressed as the mean ± SD. Data were analyzed by the unpaired t-test (G), one-way ANOVA (K), or two-way ANOVA (C, J and L). **p < 0.01, ***p < 0.001.
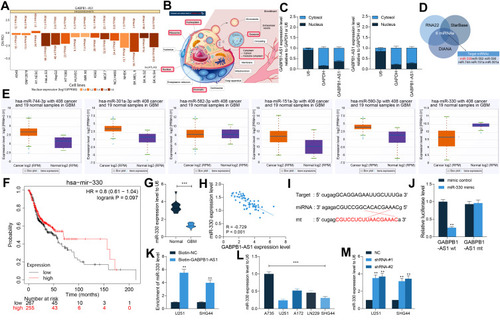
To further validate the binding relationship between GABPB1-AS1 and miR-330, the GABPB1-AS1-wt luciferase vector containing the putative binding site with miR-330 and the corresponding GABPB1-AS1-mt vector () were constructed and co-transfected with miR-330 mimic or mimic control into 293T cells. It was found that miR-330 mimic reduced the luciferase activity of GABPB1-AS1-wt in cells (). To further validate the binding relationship between GABPB1-AS1 and miR-330, an RNA pull-down assay was performed. An abundance of miR-330 fragments were enriched by the biotin-labeled GABPB1-AS1 probe compared to the Bio-NC (), indicating a binding relationship between GABPB1-AS1 and miR-330. We further detected the expression of miR-330 in glioma cell lines LN229, U251, SHG44 and A172 and in the astrocyte cell line A735 using RT-qPCR. Consequently, miR-330 was found to be poorly expressed in the glioma cell lines as well compared to that in A735 cells (). In addition, an increase in miR-330 expression was observed in U251 and SHG44 cells where GABPB1-AS1 was knocked down ().
miR-330 Restores Viability of Glioma Cells Suppressed by Sh-GABPB1-AS1
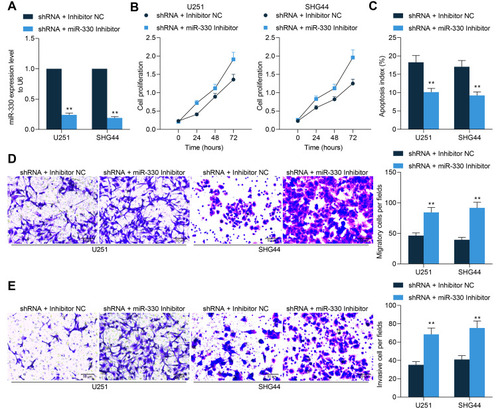
To explore the function of miR-330 in the behaviors of glioma cells, U251 and SHG44 cells stably transfected with sh-GABPB1-AS1 were further administrated with miR-330 inhibitor, and the successful transfection was confirmed by RT-qPCR (). Then, the CCK-8 method confirmed that further downregulation of miR-330 restored the proliferation activity of U251 and SHG44 cells (). The apoptosis of U251 and SHG44 cells, initially enhanced after GABPB1-AS1 knockdown, was then reduced following further miR-330 inhibition (). The Transwell assays also suggested that miR-330 inhibitor increased the migratory and invasive potentials of SHG44 and U251 cells ( and ).
Figure 5 miR-330 restores viability of glioma cells suppressed by sh-GABPB1-AS1. (A) downregulation of miR-330 was further introduced in U251 and SHG44 cells following sh-GABPB1-AS1 transfection, and the transfection efficacy was validated by RT-qPCR; (B) viability of U251 and SHG44 cells after miR-330 inhibition determined by the CCK-8 method; (C) apoptosis rate of U251 and SHG44 cells after miR-330 inhibition examined by flow cytometry; (D–E) migration (D) and invasion (E) abilities of U251 and SHG44 cells after miR-330 inhibition detected by Transwell assays. Data were collected from three independent experiments and expressed as the mean ± SD. Data were analyzed by two-way ANOVA. **p < 0.01 vs shRNA + Inhibitor NC group.
miR-330 Directly Binds to ZNF367 mRNA
To investigate the downstream mRNAs of miR-330, we first analyzed the mRNAs having a less than −0.4 correlation coefficient with miR-330 in TCGA-GBM database using a R Corr Package. The outcomes were further intersected with the target mRNAs of miR-330 predicted using three bioinformatic systems TargetScan (http://www.targetscan.org/vert_72/), miRDB (http://mirdb.org/) and StarBase. In TargetScan, the screening threshold was Total context++ score > −0.34; in miRDB, the screening threshold was set as: Target Score >90. Using these thresholds, ZNF367 was indicated as a candidate target mRNA of miR-330 (). The data in the TCGA-GBM database suggested that ZNF367 was highly expressed in glioma tissues (). We further analyzed the relevance of ZNF367 to the immune infiltration in glioma using a bioinformatic system TIMER (https://cistrome.shinyapps.io/timer/), and it was predicted that ZNF367 expression was positively correlated with the purity of glioma (). However, data in the TCGA-GBM database suggested that ZNF367 expression showed no correlation with the survival rate of glioma patients (). According to the CCLE database, ZNF367 was suggested to be highly expressed in glioma cells compared to other cancer cells ().
Figure 6 miR-330 negatively regulates ZNF367. (A) mRNAs showing a less than −0.4 correlation coefficient with miR-330 in the TCGA-GBM database were analyzed using a R Corr Package, and the outcomes were compared with the targeting mRNAs of miR-330 predicted using bioinformatic systems TargetScan, miRDB and StarBase; (B) expression of ZNF367 in the TCGA-GBM database; (C) correlation between ZNF367 expression and the immune infiltration in glioma predicted using the TIMER website; (D) correlation between ZNF367 expression and the survival of patients with glioma; (E) ZNF367 expression in different cell lines according to the data from the CCLE database; (F) ZNF367 expression in 14 normal brain tissues and 58 glioma tissues examined by RT-qPCR; (G) correlation between ZNF367 expression and GABPB1-AS1 or miR-330; (H) putative binding site between miR-330 and ZNF367 mRNA obtained from the StarBase system; (I) binding relationship between miR-330 and ZNF367 mRNA validated using a luciferase reporter gene assay; (J) expression of ZNF367 in glioma cells and A735 cells examined by RT-qPCR; (K) expression of ZNF367 in U251 and SHG44 cells examined by RT-qPCR. Data were collected from three independent experiments and expressed as the mean ± SD. Data were analyzed by the unpaired t-test (F), one-way ANOVA (J), or two-way ANOVA (I and K). *p < 0.05, **p < 0.01, ***p < 0.001 vs normal/mimic control/A735 cells/NC; ##p < 0.01 vs shRNA + Inhibitor NC.
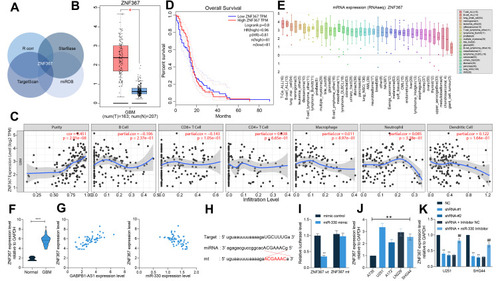
Thereafter, the expression of ZNF367 in the collected clinical tissue samples was examined as well using RT-qPCR. Likewise, higher expression of ZNF367 was confirmed in the glioma tissues than that in normal brain tissues (), which showed a positive correlation with GABPB1-AS1 expression, while a negative correlation with miR-330 expression ().
The direct binding between miR-330 and ZNF367 was validated using a luciferase assay as well. Likewise, co-transfection of miR-330 mimic and ZNF-367-wt led to a notable decline in the luciferase activity in 293T cells ( and ). In addition, the subsequent RT-qPCR results confirmed highly expressed ZNF367 in the glioma cell lines compared to A735 cells (). In U251 and SHG44 cells, the ZNF367 expression was decreased after GABPB1-AS1 knockdown but increased after further miR-330 inhibition ().
ZNF367 Activates the Cell Cycle Signaling Pathway to Augment Glioma Progression
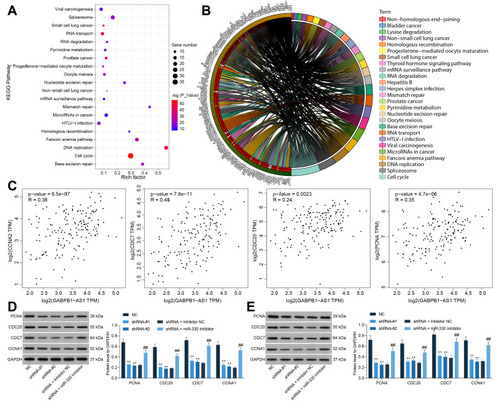
Following the findings above, we further analyzed the genes having a strong correlation with ZNF367 (an over 0.5 correlation coefficient) in TCGA-GBM database using the UALCAN system (http://ualcan.path.uab.edu/index.html). Setting the correlation coefficient R > 0.05 as a threshold, we obtained a total of 806 related genes. Next, a KEGG enrichment analysis was performed using the DAVID 6.8 bioinformatic system (https://david.ncifcrf.gov/) based on these genes, and a total of 29 signaling pathways were suggested to be enriched ( and ). Among them, the cell cycle signaling pathway was significantly enriched. We then surmised that the GABPB1-AS1/miR-330/ZNF36 axis might regulate the cell cycle progress to affect glioma development. Therefore, we analyzed the correlations between GABPB1-AS1 and the cell cycle-related factors PCNA, CDC20, CDC7 and CCNA1 in the TCGA-GBM database, and positive correlations between GABPB1-AS1 and these factors were confirmed (). Next, we examined the protein levels of these factors in U251 and SHG44 cells. It was found that the levels of PCNA, CDC20, CDC7 and CCNA1 in cells were decreased after GABPB1-AS1 knockdown but enhanced after further miR-330 inhibition ( and ). These results collectively suggested that GABPB1-AS1 sponges miR-330 and upregulates ZNF367, which activates the cell cycle signaling pathway and enhances growth and metastasis of glioma cells.
Figure 7 ZNF367 activates the cell cycle signaling pathway to promote glioma progression. (A and B) a KEGG analysis based on the genes showing a strong relevance (correlation coefficient R > 0.05) to ZNF367 in the TCGA-GBM database; (C) correlations between GABPB1-AS1 and the cell cycle-related factors PCNA, CDC20, CDC7 and CCNA1 predicted in the TCGA-GBM database; (D and E) protein levels of PCNA, CDC20, CDC7 and CCNA1 in U251 and SHG44 cells examined by Western blot analysis. Data were collected from three independent experiments and expressed as the mean ± SD. Data were analyzed by two-way ANOVA. **p < 0.01 vs NC group, ##p < 0.01 vs shRNA + Inhibitor NC group.
Discussion
Glioma remains an incurable disease despite of a variety of existing therapies including surgical resection, radiation and chemotherapy. The mean survival time for patients with the most aggressive type GBM was reported as short as 14.6 months even following surgery and radio- and chemo-therapies.Citation23 Advanced bioinformatic systems such as GEO and TCGA obtabases and several advantaged analytical methods have allowed researchers to obtain the specific gene expression patterns in different pathological conditions.Citation24 Here, our study reported that lncRNA GABPB1-AS1 competitively bound to miR-330 and de-repressed ZNF367 expression, leading to activation of the cell cycle signaling pathway and the growth and metastasis of glioma cells.
LncRNAs are specifically expressed in differentiated tissues or certain cancer types including glioma and implicated in a wide array of biological processes, and they are closely correlated with tumorigenesis, metastasis, and tumor stage.Citation25 For instance, a lncRNA paternally expressed 10 (PEG10) was found to be highly expressed in glioma patients and associated with increased pathological grades and risk of occurrence but reduced Karnofsky performance status and survival time.Citation26 Likewise, a hox transcript antisense intergenic RNA (HOTAIR) was found with a higher abundancy in patients in Grades II–IV than those in Grade I.Citation27 Here, the GEO GSE2223 dataset suggested that GABPB1-AS1 was highly expressed in glioma tissues. This trend was validated in the clinical samples, and this lncRNA was analyzed to show an ideal prognostic value in glioma and indicate increased glioma grades. Interestingly, a recent study by Ou et al suggested that GABPB1-AS1 was upregulated in human papillomaviruses-positive cervical cancer samples and associated with increased tumor size, lymph node metastasis, as well as reduced survival.Citation28 In addition to the diagnostic and prognostic values, lncRNAs also have potent regulatory functions in cell behaviors such as proliferation, migration, and invasion.Citation25,Citation29 Therefore, artificial downregulation of GABPB1-AS1 was introduced into glioma U251 and SHG44 cell lines. In this setting, the proliferation, EMT process, migration, and invasion of cells were notably reduced, while the cell apoptosis was enhanced. Here, we confirmed a similar oncogenic role of GABPB1-AS1 in glioma cells. In addition, the above results were reproduced in vivo where downregulation of GABPB1-AS1 suppressed growth and metastasis of xenograft tumors induced by glioma cells in nude mice.
GABPA and GABPB1 have been shown as master drivers for the mutant TERT promoter activity, which is a prerequisite step in malignant transformation and progression.Citation22 However, the Western blot analysis suggested the protein levels of GABPB1 and TERT in glioma cells were not significantly changed upon GABPB1-AS1 downregulation. The cytoplasm-localization of GABPB1-AS1 indicated that it may exert functions through ceRNA networks. Subsequently, the integrated bioinformatic analyses and experiments suggested that miR-330, as a candidate target miRNA of GABPB1-AS1, was poorly expressed in glioma tissues. miR-330 has been frequently identified with tumor-suppressing roles in several human cancer types such as colorectal cancer,Citation17,Citation30 lung cancerCitation18 and cervical cancer.Citation31 More relevantly, decreased expression of miR-330 has been reported to promote proliferation and stem cell property of the glioma stem cells.Citation32 Likewise, miR-330-5p exerted anti-proliferative and anti-migratory functions in glioma cells through targeting CELF1 in a recent report by Wang et al.Citation33 Here, to validate the roles of miR-330 in glioma cells, the rescue experiments showed that downregulation of miR-330 restored the viability and invasiveness of glioma cells that were initially suppressed after GABPB1-AS1 knockdown. Since miR-330 was poorly expressed in the collected glioma tissues, we believed that downregulation of miR-330 is involved in the oncogenic events mediated by GABPB1-AS1.
Next, ZNF367 was confirmed as a target of miR-330 and was highly expressed in glioma tissues. As a member of the zinc finger transcription factor family, ZNF367 has been reported to accelerate metastasis and progression of breast cancerCitation34,Citation35 and pancreatic cancer.Citation36 Here, the subsequent KEGG pathway enrichment analysis suggested that the ZNF367-related genes were enriched on the cell cycle signaling pathway. Then, we confirmed the positive correlations between GABPB1-AS1 with ZNF367 and with the cell cycle-related factors including PCNA, CDC20, CDC7 and CCNA1. Deregulation of cell cycle represents one of the main mechanisms of the indefinite proliferation and metastasis of malignant glioma cells.Citation37 Although there is limited evidence concerning the correlation between GABPB1-AS1 and cell cycle progression, the miR-330 has been reported to induce cell cycle arrest in lung cancer,Citation18 gastric cancerCitation38 and glioma.Citation39 ZNF367 has been reported has a key controller of the neuroblast cell cycle,Citation40 and it has been reported to accelerate cell cycle progression in breast cancer.Citation35 Importantly, our rescue experiments confirmed that downregulation of miR-330 in U251 and SHG44 cells restored the levels of PCNA, CDC20, CDC7 and CCNA1, indicating that the GABPB1-AS1/miR-330/ZNF367 axis regulates the cell cycle signaling pathway to govern the malignant behaviors of glioma cells.
Conclusion
To sum up, this study confirmed that GABPB1-AS1 competitively bound to miR-330 and blocked its suppressive role in ZNF367, leading to ZNF367 upregulation and the activation of the cell cycle signaling pathway and the malignant progression of glioma. Although there remains a far way to go for the clinical application of these molecules as potential therapeutic targets or tools, these findings may offer novel insights into the management of glioma and may serve as candidate clinical biomarkers. Due to the time and funding limits, we did not include more concerns of the role of GABPB1-AS1 in TERT mutant promoter activity in the current study, which is a major limitation of the paper. We hope further studies will be conducted to verify our findings and to understand more molecular mechanism involved in glioma progression.
Acknowledgments
We thanks to the Caoxian People’s Hospital for the experiment support.
Disclosure
The authors declare no potential conflicts of interest.
Additional information
Funding
References
- Ostrom QT, Bauchet L, Davis FG, et al. The epidemiology of glioma in adults: a “state of the science” review. Neuro Oncol. 2014;16(7):896–913. doi:10.1093/neuonc/nou08724842956
- Louis DN, Perry A, Reifenberger G, et al. The 2016 World Health Organization classification of tumors of the central nervous system: a summary. Acta Neuropathol. 2016;131(6):803–820. doi:10.1007/s00401-016-1545-127157931
- Tamtaji OR, Mirzaei H, Shamshirian A, Shamshirian D, Behnam M, Asemi Z. New trends in glioma cancer therapy: targeting Na(+)/H (+) exchangers. J Cell Physiol. 2020;235(2):658–665. doi:10.1002/jcp.2901431250444
- Weller M, Cloughesy T, Perry JR, Wick W. Standards of care for treatment of recurrent glioblastoma–are we there yet? Neuro Oncol. 2013;15(1):4–27. doi:10.1093/neuonc/nos27323136223
- Kumar AA, Abraham Koshy A. Regression of recurrent high-grade glioma with temozolomide, dexamethasone, and levetiracetam: case report and review of the literature. World Neurosurg. 2017;108(990):e911–990 e916. doi:10.1016/j.wneu.2017.08.136
- Lorenzi L, Avila Cobos F, Decock A, et al. Long noncoding RNA expression profiling in cancer: challenges and opportunities. Genes Chromosomes Cancer. 2019;58(4):191–199. doi:10.1002/gcc.2270930461116
- Dang Y, Wei X, Xue L, Wen F, Gu J, Zheng H. Long non-coding RNA in Glioma: target miRNA and signaling pathways. Clin Lab. 2018;64(6):887–894. doi:10.7754/Clin.Lab.2018.18010729945317
- Adams BD, Kasinski AL, Slack FJ. Aberrant regulation and function of microRNAs in cancer. Curr Biol. 2014;24(16):R762–776. doi:10.1016/j.cub.2014.06.04325137592
- Harrandah AM, Mora RA, Chan EKL. Emerging microRNAs in cancer diagnosis, progression, and immune surveillance. Cancer Lett. 2018;438:126–132. doi:10.1016/j.canlet.2018.09.01930237038
- Salmena L, Poliseno L, Tay Y, Kats L, Pandolfi PP. A ceRNA hypothesis: the Rosetta Stone of a hidden RNA language? Cell. 2011;146(3):353–358. doi:10.1016/j.cell.2011.07.01421802130
- Smillie CL, Sirey T, Ponting CP. Complexities of post-transcriptional regulation and the modeling of ceRNA crosstalk. Crit Rev Biochem Mol Biol. 2018;53(3):231–245. doi:10.1080/10409238.2018.144754229569941
- Wang C, Chen Y, Wang Y, et al. Inhibition of COX-2, mPGES-1 and CYP4A by isoliquiritigenin blocks the angiogenic Akt signaling in glioma through ceRNA effect of miR-194-5p and lncRNA NEAT1. J Exp Clin Cancer Res. 2019;38(1):371. doi:10.1186/s13046-019-1361-231438982
- Zhong C, Yu Q, Peng Y, et al. Novel LncRNA OXCT1-AS1 indicates poor prognosis and contributes to tumorigenesis by regulating miR-195/CDC25A axis in glioblastoma. J Exp Clin Cancer Res. 2021;40(1):123. doi:10.1186/s13046-021-01928-433832517
- Tani H, Onuma Y, Ito Y, Torimura M. Long non-coding RNAs as surrogate indicators for chemical stress responses in human-induced pluripotent stem cells. PLoS One. 2014;9(8):e106282. doi:10.1371/journal.pone.010628225171338
- Cui L, Nai M, Zhang K, Li L, Li R. lncRNA WT1-AS inhibits the aggressiveness of cervical cancer cell via regulating p53 expression via sponging miR-330-5p. Cancer Manag Res. 2019;11:651–667. doi:10.2147/CMAR.S17652530666161
- Xiong X, Shi Q, Yang X, Wang W, Tao J. LINC00052 functions as a tumor suppressor through negatively modulating miR-330-3p in pancreatic cancer. J Cell Physiol. 2019;234(9):15619–15626. doi:10.1002/jcp.2820930712321
- Mansoori B, Mohammadi A, Naghizadeh S, et al. miR-330 suppresses EMT and induces apoptosis by downregulating HMGA2 in human colorectal cancer. J Cell Physiol. 2020;235(2):920–931. doi:10.1002/jcp.2900731241772
- Mohammadi A, Mansoori B, Duijf PHG, et al. Restoration of miR-330 expression suppresses lung cancer cell viability, proliferation, and migration. J Cell Physiol. 2021;236(1):273–283. doi:10.1002/jcp.2984032583462
- Asano H, Murate T, Naoe T, Saito H, Stamatoyannopoulos G. Molecular cloning and characterization of ZFF29: a protein containing a unique Cys2His2 zinc-finger motif. Biochem J. 2004;384(Pt 3):647–653. doi:10.1042/BJ2004039415344908
- Aslan B, Monroig P, Hsu MC, et al. The ZNF304-integrin axis protects against anoikis in cancer. Nat Commun. 2015;6(1):7351. doi:10.1038/ncomms835126081979
- Jen J, Wang YC. Zinc finger proteins in cancer progression. J Biomed Sci. 2016;23(1):53. doi:10.1186/s12929-016-0269-927411336
- Yuan X, Dai M, Xu D. TERT promoter mutations and GABP transcription factors in carcinogenesis: more foes than friends. Cancer Lett. 2020;493:1–9. doi:10.1016/j.canlet.2020.07.00332768523
- Seliger C, Luber C, Gerken M, et al. Use of metformin and survival of patients with high-grade glioma. Int J Cancer. 2019;144(2):273–280. doi:10.1002/ijc.3178330091464
- Chen Z, Huang J, Feng Y, Li Z, Jiang Y. Screening and bioinformatics analysis of a ceRNA network based on the circular RNAs, miRNAs, and mRNAs in pan-cancer. Cancer Med. 2020;9(19):7279–7292. doi:10.1002/cam4.337533094914
- Li J, Zhu Y, Wang H, Ji X. Targeting long noncoding RNA in Glioma: a pathway perspective. Mol Ther Nucleic Acids. 2018;13:431–441. doi:10.1016/j.omtn.2018.09.02330388617
- Xiao H, Ding N, Liao H, et al. Prediction of relapse and prognosis by expression levels of long noncoding RNA PEG10 in glioma patients. Medicine (Baltimore). 2019;98(45):e17583. doi:10.1097/MD.000000000001758331702614
- Zhao WH, Yuan HY, Ren XY, Huang K, Guo ZY. Association between expression of HOTAIR and invasiveness of gliomas, and its predictive value. Adv Clin Exp Med. 2019;28(9):1179–1183. doi:10.17219/acem/9952731414734
- Ou R, Lv M, Liu X, et al. HPV16 E6 oncoprotein-induced upregulation of lncRNA GABPB1-AS1 facilitates cervical cancer progression by regulating miR-519e-5p/Notch2 axis. FASEB J. 2020;34(10):13211–13223. doi:10.1096/fj.202000762R32844486
- Wu DM, Wang S, Wen X, et al. Long noncoding RNA nuclear enriched abundant transcript 1 impacts cell proliferation, invasion, and migration of glioma through regulating miR-139-5p/CDK6. J Cell Physiol. 2019;234(5):5972–5987. doi:10.1002/jcp.2709330515782
- Huang Y, Sun H, Ma X, et al. HLA-F-AS1/miR-330-3p/PFN1 axis promotes colorectal cancer progression. Life Sci. 2020;254:117180. doi:10.1016/j.lfs.2019.11718031863778
- Zhao H, Hu GM, Wang WL, Wang ZH, Fang Y, Liu YL. LncRNA TDRG1 functions as an oncogene in cervical cancer through sponging miR-330-5p to modulate ELK1 expression. Eur Rev Med Pharmacol Sci. 2019;23(17):7295–7306. doi:10.26355/eurrev_201909_1883431539116
- Chen J, Chen T, Zhu Y, et al. circPTN sponges miR-145-5p/miR-330-5p to promote proliferation and stemness in glioma. J Exp Clin Cancer Res. 2019;38(1):398. doi:10.1186/s13046-019-1376-831511040
- Wang H, Liu G, Li T, Wang N, Wu J, Zhi H. MiR-330-3p functions as a tumor suppressor that regulates glioma cell proliferation and migration by targeting CELF1. Arch Med Sci. 2020;16(5):1166–1175. doi:10.5114/aoms.2020.9502732864006
- Wu X, Zhang X, Yu L, et al. Zinc finger protein 367 promotes metastasis by inhibiting the Hippo pathway in breast cancer. Oncogene. 2020;39(12):2568–2582. doi:10.1038/s41388-020-1166-y31988454
- Zeng H, Li T, Zhai D, et al. ZNF367-induced transcriptional activation of KIF15 accelerates the progression of breast cancer. Int J Biol Sci. 2020;16(12):2084–2093. doi:10.7150/ijbs.4420432549756
- Shi H, Li H, Zhen T, Dong Y, Pei X, Zhang X. The potential therapeutic role of exosomal microRNA-520b derived from normal fibroblasts in pancreatic cancer. Mol Ther Nucleic Acids. 2020;20:373–384. doi:10.1016/j.omtn.2019.12.02932200272
- Ouyang Q, Xu L, Cui H, Xu M, Yi L. MicroRNAs and cell cycle of malignant glioma. Int J Neurosci. 2016;126(1):1–9. doi:10.3109/00207454.2015.101788126000816
- Wang Z, Qu H, Gong W, Liu A. Up-regulation and tumor-promoting role of SPHK1 were attenuated by miR-330-3p in gastric cancer. IUBMB Life. 2018;70(11):1164–1176. doi:10.1002/iub.193430281914
- Feng L, Ma J, Ji H, Liu Y, Hu W. miR-330-5p suppresses glioblastoma cell proliferation and invasiveness through targeting ITGA5. Biosci Rep. 2017;37(3). doi:10.1042/BSR20170019
- Naef V, Monticelli S, Corsinovi D, Mazzetto MT, Cellerino A, Ori M. The age-regulated zinc finger factor ZNF367 is a new modulator of neuroblast proliferation during embryonic neurogenesis. Sci Rep. 2018;8(1):11836. doi:10.1038/s41598-018-30302-230087422