
Abstract
Purpose
To investigate cerebral blood flow (CBF) characteristics in individuals with generalized tonic‒clonic seizures (GTCS) during the interictal phase using voxel-based analysis of 3D pseudocontinuous arterial spin labeling (PCASL).
Patients and Methods
Patients with GTCS (GTCS group) (during the interictal period) and healthy volunteers (control group) underwent head MR imaging with a 3.0T MR scanner with a 3D PCASL sequence. CBF was compared between the two groups. Spearman correlations of CBF in regions of interest (ROIs) in GTCS patients with the duration of disease and age of onset were analyzed and corrected using the false discovery rate (FDR).
Results
Twenty patients with GTCS (GTCS group) and twenty healthy volunteers (control group) were recruited for this study. On 3D PCASL, (1) GTCS patients had lower CBF in the brainstem, right cerebellum, right inferior temporal gyrus, parahippocampal gyrus, superior frontal gyrus, middle frontal gyrus, triangular part of inferior frontal gyrus, left temporal pole of superior temporal gyrus and thalamus and had higher CBF in the bilateral superior parietal gyri, precuneus, precentral gyri, postcentral gyri, and left dorsolateral superior frontal gyrus than controls. (2) The CBF of the right temporal pole of the middle temporal gyrus was negatively correlated with the duration of disease (PFDRcorrected<0.05), with a correlation coefficient r of −0.7333 and a PFDRcorrected value of 0.04.
Conclusion
Voxel-based analysis of 3D PCASL imaging can be used to sensitively detect brain perfusion differences in GTCS patients. The decrease in CBF in the right temporal pole of the middle temporal gyrus may be associated with disease onset. These findings may offer new perspectives on the pathogenesis of GTCS and the underlying pathophysiological changes associated with perfusion.
Introduction
Generalized tonic‒clonic seizures (GTCS) are the most common type of genetic generalized epilepsies (GGE) and the most severe manifestation seen in patients with epilepsy. Altered cerebral blood flow (CBF) is one of the possible mechanisms of neurological dysfunction following seizures. Cerebral hemodynamic impairment before, during, and after a generalized epileptic seizure is a very complex process. It is necessary to study cerebral perfusion patterns during different periods of epilepsy to better understand their pathogenesis.Citation1,Citation2 Previous neuroimaging studies have shown that patients with GTCS have abnormalities in cerebral functional and structural architecture;Citation3–6 nevertheless, the CBF changes in patients with GTCS are not well understood.
In recent years, MRI techniques have rapidly evolved in their imaging and visualization abilities for assessing white matter tracts, oxygenation, perfusion, and metabolites, which helps in the noninvasive identification of epileptogenic foci and epileptic networks in patients with epilepsy.Citation2,Citation7 It is now generally accepted that the epileptic network consisting of the cortex, subcortical nuclei and cerebellum is the pathophysiological basis for the occurrence and propagation of epileptic activity and underlies brain impairments in GTCS patients.Citation8–12
CBF changes in epilepsy are rather complex, and abnormal pathophysiological changes in the brain persist even during the interictal stage; hence, long-term pathological damage is often present in epileptogenic foci and distant brain regions.Citation1 Changes in CBF in patients with generalized epilepsy have been studied using single photon emission computed tomography (SPECT).Citation13 In one study, 21 patients with GGE (including 14 patients with generalized tonic‒clonic seizures) were examined by brain interictal 99mTc-ethylcysteinate dimer SPECT.Citation13 The results showed that the regional cerebral blood flow in the thalamus and brainstem of the GGE patients was significantly decreased.
ASL is an effective, sensitive, radiation-free tool to measure differences in CBF by magnetically labeling inflowing arterial blood, is the only non-invasive perfusion imaging technique currently. Arterial blood water was used as an endogenous reference. The label is created by inverting the bulk magnetization of the arterial blood water protons with a long series of radiofrequency (RF) pulses. A typical ASL test consists of a pair of images: the labeled image, in which the blood proton magnetization is inverted, and the “control” image, in which the blood proton magnetization is not inverted. The signal difference of these two images can reflect the amount of blood that entered the tissue. With this method, there are no side effects on patients with hepatic or renal insufficiency, including children and those who require multiple follow-ups. Perfusion can reflect spontaneous correlated fluctuations to identify the network, and ASL can capture these fluctuations, showing a similar functionally connected network to that seen in BOLD imaging, and it is worth noting that ASL also has amazing quantitative features. The great diversity of schemes used by different researchers was a major hurdle for adoption of ASL. The labeling of pseudo-continuous ASL (PCASL) is achieved by using a train of short RF pulses, which is designed to invert the inflowing arterial blood magnetization in a pseudo steady-state or adiabatic manner.Citation14,Citation15 3D PCASL has high reproducibility and repeatability and has been regarded as the preferred labeling method for obtaining clinical images.Citation16–19 ASL can be used to identify pathological hippocampal tissue in patients with temporal lobe epilepsy and localize epileptogenic foci based on differences in interictal and ictal cerebral perfusion and is regarded as a routine examination for the preoperative evaluation of drug-resistant focal epilepsy patients. The perfusion data collected from ASL, positron emission tomography (PET) and SPECT exhibit good consistency; notably, ASL has greater application value based on its noninvasiveness and its ability to provide more information to help localize the epileptogenic focus.Citation7,Citation20–22
Aberrant CBF patterns detected using arterial spin labeling (ASL) perfusion MRI in epilepsy patients remain rarely explored. According to a studyCitation1 that applied ASL MRI to GGE patients with absence seizures, epileptic activity may be associated with cortical dysfunction of the fusiform gyrus and temporal lobe.
However, previous reports all focus on perfusion patterns of GGE and lack detailed discussion of GTCS. The brain regions involved in GTCS during the interictal phase have not been thoroughly investigated in humans. The characteristics of CBF in GTCS are not clear, and the relationship between CBF and seizures is not clear.
Thus, we conducted this study to detect cerebral perfusion differences in GTCS patients by using a voxel-based analysis method, including (1) investigating whether there were significant differences in CBF between GTCS patients and normal control subjects using voxel-based analysis and (2) assessing the correlation between these obtained neuroimaging results and the course of disease and age of onset.
Materials and Methods
This study was reviewed and approved by the Ethics Committee of North Sichuan Medical College (NSMC), based on the Declaration of Helsinki. All the participants signed informed consent. GTCS patients were enrolled in the Department of Neurology of the Affiliated Hospital of NSMC.
Patients were diagnosed with GTCS according to the classification scheme of the International League Against Epilepsy (ILAE),Citation23 and EEG results showing a generalized ictal discharge at the onset, and normal background activity interictally. The disease duration was defined as the interval between the first seizure and the time of enrollment of the patients.
The Inclusion Criteria for Patients in the GTCS Group Were as Follows
(1) they had a clear clinical diagnosis based on the ILAE classification scheme;Citation23 (2) no obvious brain structural abnormalities were found on routine MRI examination; (3) they were right-handed; and (4) they had never taken antiepileptic drugs.
The Exclusion Criteria for the GTCS Group Were as Follows
(l) they had neurological dysfunction such as transient ischemic attack (TIA), migraine, or syncope; (2) they had secondary epilepsy (epilepsy due to infective, structural, metabolic, or immune cause);Citation24 (3) they used antiepileptic drugs; and (4) they had severe diseases, cognitive dysfunction, or psychiatric disorders.
Control Group
The inclusion criteria included the following: (1) no systemic diseases and neurological symptoms or signs; (2) no abnormalities on electroencephalography (EEG) examination or significant structural abnormalities on routine cranial MRI imaging; and (3) no psychiatric disorders, including alcohol or drug dependence.
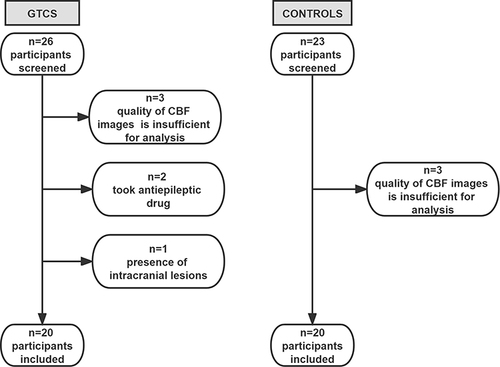
Enrollment flow chart is shown in .
Figure 1 Enrollment flow chart.
MRI Techniques
All subjects were scanned on a 3.0T GE DISCOVERY MR 750 scanner (GE Healthcare, Milwaukee, Wisconsin, USA) with a 32-channel cranial coil. The subjects were instructed to close their eyes in a relaxed state but remain awake; they also wore earplugs to reduce the noise and had their head immobilized with soft pads.Citation20 First, a cranial MRI scan was performed, including AX-T1WI, AX-T2WI, AX-FLAIR, and diffusion-weighted imaging, to exclude subjects with structural brain abnormalities. The parameters of the conventional MRI sequence are shown in Supplementary Table S1.
The 3D PCASL sequence was performed with the following parameters: 3D fast spin‒echo acquisition, k-space spiral filling, presence of M0, background suppression, 3D stack of spiral fast spin echo readout, Arms=8, point=512, Effective resolution=3.75×3.75×4, TR=4632 ms, TE=10.5 ms, FOV=24 cm×24 cm, slice thickness=4.0 mm, bandwidth=62.5 kHz, NEX=3, post label delay=1525 ms, and axial slices=36. The total acquisition time for the 3D PCASL scan was 4 min 29s. During 3D PCASL sequence scanning, we selected the CBF automatic generation option. The generated CBF data was then used for data preprocessing.
Image Preprocessing
(1) During image preprocessing, the DICOM format CBF image files were converted into NIFTI images using dcm2nii software (https://people.cas.sc.edu/rorden/mricron/index.html) and were preprocessed on the MATLAB 2012a (The MathWorks, Inc., Natick, MA, USA) platform with the SPM8 toolbox (https://www.fil.ion.ucl.ac.uk/spm) before the statistical analysis.
We excluded subjects whose head motion exceeded 2 mm or/and 1° as determined during the postprocessing process.
The preprocessing steps of the CBF data were as follows: First, CBF images were corrected for motion. Then, CBF images were normalized to the Montreal Neurological Institute (MNI) space, and the alignment parameters were applied to the corresponding perfusion maps and resampled to 2 mm×2 mm×2 mm. Each CBF map was divided by the subject’s global mean CBF value of the GM for standardization. Finally, we used a 6 mm×6 mm× 6 mm full-width at half-maximum (FWHM) Gaussian kernel for spatial smoothing to improve the signal-to-noise ratio of the image.Citation25 The detailed preprocessing steps of the PCASL data are described in the Supplementary Material 1.
(2) During region of interest (ROI) selection, ten ROIs were selected on the ch2bet structural template images based on MRIcro software (Neuropsychology Lab, Columbia, SC), namely, the bilateral thalamus, bilateral inferior temporal gyri, bilateral parahippocampal gyri, and bilateral temporal poles (including the superior and middle temporal gyrus).
The mean CBF values within these ROIs were extracted from the preprocessed images based on drawn templates, and the correlation between CBF and disease duration and the age of onset in the GTCS group was investigated.
Statistical Analysis
SPSS for Windows version 19.0 SPSS (IBM Corp, Armonk, NY) was used to analyze all the demographic and clinical data of the participants. All continuous variables were reported as the mean ± standard deviation (SD) and medians with interquartile ranges according to the normality of the distribution. The normality of the variables was examined by the Kolmogorov‒Smirnov test. The two-sample t-test was used to assess normally distributed continuous variables, while the categorical variables were compared by the chi-squared test. Results with P values of < 0.05 were considered statistically significant, as shown in .
Table 1 Participant Characteristics
A voxel-based analysis was performed using the MATLAB platform with statistical parametric mapping (SPM) 8 software. The preprocessed CBF brain perfusion functional maps of the two groups were subjected to a two-sample t-test with sex and age as covariates and a significance level of p<0.05; familywise error (FWE) correction was performed, and an extent threshold of 20 voxels was used. The corrected statistical parametric brain atlases were then superimposed on the MNI coordinate system to yield CBF maps with significant differences between the two groups in the resting state. Effect sizes, using Cohen’s D, were calculated for significant group effects on G*Power v.3.1,Citation26 as shown in . Spearman correlation analysis was performed to assess the correlation between the CBF in the ROIs obtained from GTCS patients and disease duration and onset age. A false discovery rate (FDR)-corrected P value of < 0.05 for the relevance analysis was considered statistically significant.
Table 2 CBF Patterns in Patients with GTCS and Control Subjects
Results
Demographic and Other Variables
Twenty patients with a clinical diagnosis of GTCS (GTCS group) were prospectively enrolled, including 9 males and 11 females, with a mean age ± SD of 20.31 ± 5.57 years (range: 13–31 years), and the duration of disease since onset ranged from 6 months to 17 years.
Twenty right-handed healthy volunteers matched with epilepsy patients in terms of sex and age were selected as the control group; the group included 10 males and 10 females with an age range of 16–33 years and a mean age ± SD of 18.01±7.20 years.
There were no significant differences in sex, age, or education between the GTCS group and the control group (P =0.752; 0.401; 0.292, respectively). The data are shown in .
Conventional cranial MRI showed no abnormalities in the heads of any GTCS patients or control subjects.
CBF Patterns on 3D PCASL for GTCS Patients
GTCS patients had lower CBF than normal controls in the brainstem, right cerebellum, right inferior temporal gyrus, right parahippocampal gyrus, right superior frontal gyrus, middle frontal gyrus, triangular part of inferior frontal gyrus, left temporal pole of superior temporal gyrus and thalamus. Areas of higher CBF in GTCS patients were seen in the bilateral superior parietal gyri, precuneus, precentral gyri, postcentral gyri, and left dorsolateral superior frontal gyrus. The results are shown in , and .
Figure 2 The cerebral regions with significantly different normalized CBF between the GTCS patients and healthy subjects in the axial sections. (FWE corrected p < 0.05). The normalized CBF was significantly decreased in the bilateral brainstem, right cerebellum, right inferior temporal gyrus, right parahippocampal gyrus, right superior frontal gyrus (orbital part), right superior frontal gyrus, frontal middle gyrus, inferior frontal gyrus (triangular part), left temporal pole and thalamus. The normalized CBF was increased in the bilateral superior parietal gyri, bilateral precuneus, bilateral precentral gyri, bilateral postcentral gyri, left superior frontal gyrus (dorsolateral part), and right superior parietal gyrus.
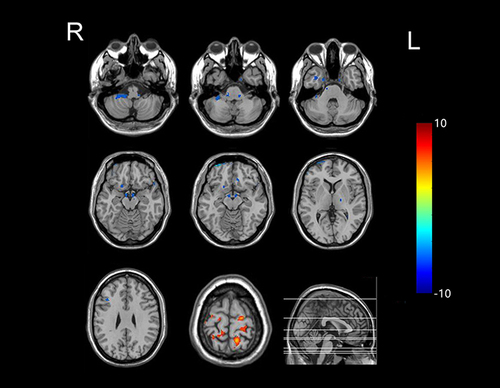
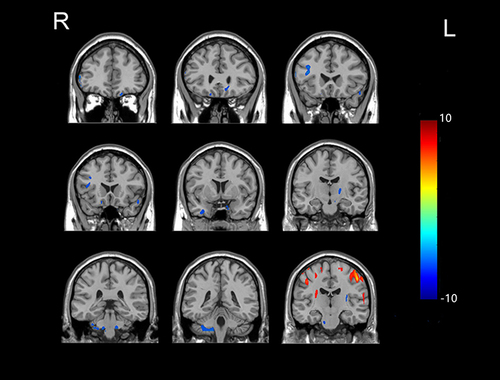
Figure 3 The cerebral regions with significantly different normalized CBF between the GTCS patients and healthy subjects in the coronal sectional image. (FWE corrected p < 0.05). The locations of the brain regions are the same as those in .
The Correlations of the CBF Patterns on 3D PCASL with the Disease Duration and Age of Onset
In the twenty GTCS patients, the CBF values in the right temporal pole of the middle temporal gyrus were negatively correlated with the disease duration (PFDRcorrected<0.05), with a correlation coefficient r of −0.7333 and a PFDRcorrected value of 0.04; there was no correlation between CBF and duration of disease in the bilateral thalamus, bilateral inferior temporal gyri, bilateral parahippocampal gyri, bilateral temporal poles of the superior temporal gyrus or the left temporal pole of the middle temporal gyrus. There were no correlations between age of onset and CBF in the bilateral thalamus, bilateral inferior temporal gyri, bilateral parahippocampal gyri, bilateral temporal poles of superior temporal gyrus or temporal poles of middle temporal gyrus as shown in .
Table 3 Correlation of CBF with Disease Duration and Onset Age in GTCS Patients
Discussion
We identified hypoperfusion in the brainstem, right cerebellum, right inferior temporal gyrus, right parahippocampal gyrus, right superior frontal gyrus, middle frontal gyrus, triangular part of the inferior frontal gyrus, left temporal pole of the superior temporal gyrus and thalamus; hyperperfusion in the bilateral superior parietal gyri, precuneus, precentral gyri, postcentral gyri, and left dorsolateral superior frontal gyrus in GTCS patients; and a correlation between CBF in the right temporal pole of the middle temporal gyrus and the onset of disease. Our study contributed novel imaging evidence obtained with a noninvasive method for understanding the cerebral hemodynamic differences in GTCS patients.
PCASL has superior efficiency and high signal to noise ratio, is the recommended method currently used to assess brain perfusion among the various ASL techniques.Citation16 In this project, we combined k-space spiral filling and 3D stack of spiral fast spin echo readout with background suppression techniques to increase ASL temporal signal-to-noise ratio, reduce readout times and blurring.3D PCASL can be used to noninvasively detect cerebral hemodynamic changes that occur during the interictal period in GTCS patients, and the altered CBF in these regions may be correlated with their functional disruption and structural abnormalities; this approach imaging helps to further clarify the pathogenesis and pathophysiological characteristics of GTCS.
In this study, the regions exhibiting abnormal CBF in GTCS patients are widely distributed, included the bilateral brainstem, right cerebellum, thalamus, neocortex, and limbic system, which are involved in the cortico-striato-thalamo-cerebellar network pathway. There is currently a lack of reports using ASL in patients with GTCS. However, previous studies have demonstrated that the cortico-striato-thalamo-cerebellar network is the basis of the structural changes of GTCSs on a large time scale.Citation5 The largest sample collaborative neuroimaging study at present indicated that epilepsy patients exhibited shared, diffuse structural differences in brain regions including the pallidum, precentral, paracentral, superior frontal cortices, and thalamus.Citation27 Our finding supports the work of other studies about brain structures in this area. A possible explanation for this might be that abnormal regional CBF shown in the brains of GTCS patients are associated with structural abnormalities, due to the CBF is closely related to brain structure through the functional and structural interdependence between vessels and neural cells in the neurovascular unit.Citation28 Our study is consistent with electrophysiological or neuroimaging studies in rodents or baboons.Citation29 These results provide a deeper insight into the neuropathological mechanisms of GTCS.
Our results show that CBF decreased in the thalamus, brainstem and cerebellum. Previous research suggested that the decreased CBF in the epileptic network consisting of cortex-subcortical nuclei-cerebellum connections, especially in the thalamus, brainstem, and cerebellum, may be a potential cause or consequence of repetitive epileptic discharge in GTCS. Selective neuronal loss after prolonged epileptic activity may be due to excitotoxicity related to glutamate,Citation30,Citation31 eventually resulting in decreased CBF. Clinical, anatomical, and electrophysiological studies have shown that the cerebellum can play a part in the epileptic network, and may be a possible driver of seizure activity and potential target to suppress seizures.Citation32 Epilepsy patients at high risk of sudden unexpected death had structural changes of cerebellum.Citation33 Optogenetic work on animal models provides strong evidence that cerebellar modulation can suppress the onset of epilepsy.Citation34 The thalamus is the principal subcortical structure involved in epilepsy and plays a considerable role in generalized seizures of reciprocal cortico-thalamic networks.Citation35 We speculate that decreased CBF in the thalamus, brainstem and cerebellum may be involved in the dysfunction associated with and development of generalized epilepsy.
Currently, there are many studies showing frontal and temporal lobes abnormalities in GTCS patients. Xu et al showed that gray matter volume and covariances involving frontal, motor and somatosensory cortices were notably changed in the GTCS group.Citation5 Others have found epileptiform discharges are restricted in a cortical network, including parts of the frontal and temporal cortices, during propagation.Citation36 Chen et al showed that cortical morphologic changes in the temporal and frontal lobe have been observed in patients with GTCS.Citation1 These results may help explain the decrease in CBF in the frontal and temporal lobes that was observed in our study. Our results also showed a decreased CBF in the right parahippocampal gyrus. In theory, the parahippocampal gyrus plays a vital role in memory storage. There are memory and cognitive impairments in patients with GGE according to previous work.Citation37 Other studies have indicated that morphometric abnormalities in the hippocampus are associated with frontotemporal lobe activation during the process of episodic memory.Citation38 As mentioned above, we observed abnormal CBF in the parahippocampal gyrus and parts of frontal and temporal cortices, it is reasonable to believe that parahippocampal gyrus, frontal and temporal lobes are affected by generalized tonic‒clonic seizures.
In a previous study, 21 primary generalized epilepsy patients (including 16 GTCS patients) showed significantly reduced CBF in regions of the thalamus, brainstem, cerebellum, and cingulate gyrus during the interictal period on SPECT imaging, but no brain regions with significantly increased CBF were found.Citation13 This differs from the findings presented here, we found CBF increases in some parietal and frontal regions. There are several potential reasons for this result. On one hand, this discrepancy may be caused by different perfusion imaging modalities or calculation methods of CBF. On the other hand, the reason may be related to neuropathological mechanisms of GTCS. Some researchers believe that not all generalized spike-and-wave discharges (GSWD) are produced by similar mechanisms because partial brain areas become more hyperactive and others less so.Citation39 Others have shown that brain structure changes occur in patients with GTCS: seizures accompanied by severe hypoxia may be related to brain volume loss,Citation4 and cortical thinning is observed in GTCS patients. However, GTCS patients have also been demonstrated to exhibit thicker cortices than controls in some of the brain regions,Citation6 which possibly reflects structural changes caused by neuroglial, neuronal, or synaptic reorganizationCitation40 and may help explain the findings of increased perfusion in some parietal and frontal regions in the present study.
In our work, the CBF values in the right temporal pole of the middle temporal gyrus in the GTCS group had a negative correlation with the disease duration. These data indicated that the CBF in the right temporal pole of the middle temporal gyrus decreased as the disease duration increased. The temporal pole is a part of the paralimbic systemCitation41 and a multi-modal cortical convergence area, with widespread connectivity to the basal ganglia, the paralimbic system, other cortical regions, and cerebellum.Citation42 A PET-based imaging study showed reduced right temporal polar metabolism in patients presenting widespread postictal EEG suppression and relatively high frequency of GTCS. Their result could suggest that possible interictal metabolic disruption in the temporal pole within a right-sided cortico-subcortical network.Citation43 We speculate that the reduced CBF or less metabolically active in right temporal pole may reflect the most notable feature of interictal brain metabolic changes.
Past studies have indicated that GTCS patients showed a negative correlation between epilepsy duration and the average gray matter volume (GMV) in cortical structures, subcortical nuclei, and the cerebellum.Citation5 Previous researchers used graph theory to investigate the topological organization of functional networks in GTCS children.Citation44 They found the nodal local efficiency and the clustering coefficient in the bilateral temporal pole of the middle temporal gyrus (MTG) significant negatively correlated with the epilepsy duration, and suggested that the bilateral temporal pole serves a vital role in reflecting the impact of chronic epilepsy on the topological properties in GTCS. In summary, we infer that the longer the duration of GTCS disease, the greater the extent of GMV loss or the lower CBF in the corresponding brain regions. It can be assumed that long-term recurrent seizures tend to progressively increase damage to the corresponding brain regions, leading to progressive damage to brain function and structure.
Our work has some limitations. First, the sample size was small and may reflect only some of the cerebral perfusion characteristics of these patients. Second, our study lacked follow-up data for longitudinal analysis, which may limit our ability to verify the impact of disease duration. Third, we did not use an EEG-fMRI platform and the slices we used in the MRI protocol are too thick to detect small lesions. Last, the study is aiming to evaluate interictal blood flow abnormalities, the relationship between CBF and the last seizure has not been studied. We will continue to expand the sample size and improve the scan protocol in the future research, further analyze the association between CBF and clinical characteristics, and continue to conduct studies involving patient follow-up and monitoring of treatment effects using this technique.
Conclusion
In summary, our study innovatively used a voxel-based 3D PCASL analysis with a noninvasive method and contributed novel imaging evidence for understanding the cerebral hemodynamic differences in GTCS, provides a reference for clinical application and related research.
Disclosure
The authors report no conflicts of interest in this work.
Acknowledgments
This study was supported by the Sichuan Science and Technology Program (2019YJ0380), the Nanchong Science and Technology Program (20SXZRKX0011), North Sichuan Medical College (Grant No. CBY22-PT01), and the school-level Program of North Sichuan Medical College (CBY21-QA43).
References
- Chen G, Lei D, Ren J, et al. Patterns of postictal cerebral perfusion in idiopathic generalized epilepsy: a multi-delay multi-parametric arterial spin labelling perfusion MRI study. Sci Rep. 2016;6:28867. doi:10.1038/srep28867
- Sidhu MK, Duncan JS, Sander JW. Neuroimaging in epilepsy. Curr Opin Neurol. 2018;31(4):371–378. doi:10.1097/WCO.0000000000000568
- Ma S, Jiang S, Peng R, et al. Altered local spatiotemporal consistency of resting-state BOLD signals in patients with generalized tonic-clonic seizures. Front Comput Neurosci. 2017;11:90. doi:10.3389/fncom.2017.00090
- Allen LA, Harper RM, Vos SB, et al. Peri-ictal hypoxia is related to extent of regional brain volume loss accompanying generalized tonic-clonic seizures. Epilepsia. 2020;61(8):1570–1580. doi:10.1111/epi.16615
- Xu Q, Zhang Q, Yang F, et al. Cortico-striato-thalamo-cerebellar networks of structural covariance underlying different epilepsy syndromes associated with generalized tonic-clonic seizures. Hum Brain Mapp. 2021;42(4):1102–1115. doi:10.1002/hbm.25279
- Ogren JA, Tripathi R, Macey PM, et al. Regional cortical thickness changes accompanying generalized tonic-clonic seizures. Neuroimage Clin. 2018;20:205–215. doi:10.1016/j.nicl.2018.07.015
- Wiest R, Beisteiner R. Recent developments in imaging of epilepsy. Curr Opin Neurol. 2019;32(4):530–538. doi:10.1097/WCO.0000000000000704
- He X, Chaitanya G, Asma B, et al. Disrupted basal ganglia-thalamocortical loops in focal to bilateral tonic-clonic seizures. Brain. 2020;143(1):175–190. doi:10.1093/brain/awz361
- Dabrowska N, Joshi S, Williamson J, et al. Parallel pathways of seizure generalization. Brain. 2019;142(8):2336–2351. doi:10.1093/brain/awz170
- Guo JN, Kim R, Chen Y, et al. Impaired consciousness in patients with absence seizures investigated by functional MRI, EEG, and behavioural measures: a cross-sectional study. Lancet Neurol. 2016;15(13):1336–1345. doi:10.1016/S1474-4422(16)30295-2
- Foit NA, Bernasconi A, Bernasconi N. Functional networks in epilepsy presurgical evaluation. Neurosurg Clin N Am. 2020;31(3):395–405. doi:10.1016/j.nec.2020.03.004
- Ji GJ, Zhang Z, Xu Q, et al. Identifying corticothalamic network epicenters in patients with idiopathic generalized epilepsy. AJNR Am J Neuroradiol. 2015;36(8):1494–1500. doi:10.3174/ajnr.A4308
- Joo EY, Tae WS, Hong SB. Cerebral blood flow abnormality in patients with idiopathic generalized epilepsy. J Neurol. 2008;255(4):520–525. doi:10.1007/s00415-008-0727-8
- Haller S, Zaharchuk G, Thomas DL, et al. Arterial spin labeling perfusion of the brain: emerging clinical applications. Radiology. 2016;281(2):337–356. doi:10.1148/radiol.2016150789
- Hernandez-Garcia L, Lahiri A, Schollenberger J. Recent progress in ASL. Neuroimage. 2019;187:3–16. doi:10.1016/j.neuroimage.2017.12.095
- Alsop DC, Detre JA, Golay X, et al. Recommended implementation of arterial spin-labeled perfusion MRI for clinical applications: a consensus of the ISMRM perfusion study group and the European consortium for ASL in dementia. Magn Reson Med. 2015;73(1):102–116. doi:10.1002/mrm.25197
- Cha YH, Jog MA, Kim YC, et al. Regional correlation between resting state FDG PET and pCASL perfusion MRI. J Cereb Blood Flow Metab. 2013;33(12):1909–1914. doi:10.1038/jcbfm.2013.147
- Spann SM, Shao X, Wang DJ, et al. Robust single-shot acquisition of high resolution whole brain ASL images by combining time-dependent 2D CAPIRINHA sampling with spatio-temporal TGV reconstruction. Neuroimage. 2020;206:116337. doi:10.1016/j.neuroimage.2019.116337
- Yang W, Yang R, Tang F, et al. Decreased relative cerebral blood flow in unmedicated heroin-dependent individuals. Front Psychiatry. 2020;11:643. doi:10.3389/fpsyt.2020.00643
- Gaxiola-Valdez I, Singh S, Perera T, et al. Seizure onset zone localization using postictal hypoperfusion detected by arterial spin labelling MRI. Brain. 2017;140(11):2895–2911. doi:10.1093/brain/awx241
- Sierra-Marcos A, Carreño M, Setoain X, et al. Accuracy of arterial spin labeling magnetic resonance imaging (MRI) perfusion in detecting the epileptogenic zone in patients with drug-resistant neocortical epilepsy: comparison with electrophysiological data, structural MRI, SISCOM and FDG-PET. Eur J Neurol. 2016;23(1):160–167. doi:10.1111/ene.12826
- Zijlmans M, Zweiphenning W, van Klink N. Changing concepts in presurgical assessment for epilepsy surgery. Nat Rev Neurol. 2019;15(10):594–606. doi:10.1038/s41582-019-0224-y
- Fisher RS. the new classification of seizures by the international league against epilepsy 2017. Curr Neurol Neurosci Rep. 2017;17(6):48. doi:10.1007/s11910-017-0758-6
- Beghi E, Giussani G, Nichols E; GBD 2016 Epilepsy Collaborators. Global, regional, and national burden of epilepsy, 1990–2016: a systematic analysis for the global burden of disease study 2016. Lancet Neurol. 2019;18(4):357–375. doi:10.1016/S1474-4422(18)30454-X
- Guo X, Zhu J, Zhang N, et al. Altered neurovascular coupling in neuromyelitis optica. Hum Brain Mapp. 2019;40(3):976–986. doi:10.1002/hbm.24426
- Faul F, Erdfelder E, Buchner A, et al. Statistical power analyses using G*Power 3.1: tests for correlation and regression analyses. Behav Res Methods. 2009;41(4):1149–1160. doi:10.3758/BRM.41.4.1149
- Whelan CD, Altmann A, Botía JA, et al. Structural brain abnormalities in the common epilepsies assessed in a worldwide ENIGMA study. Brain. 2018;141(2):391–408. doi:10.1093/brain/awx341
- Iadecola C. The neurovascular unit coming of age: a journey through neurovascular coupling in health and disease. Neuron. 2017;96(1):17–42. doi:10.1016/j.neuron.2017.07.030
- Szabo CA, Salinas FS. Neuroimaging in the epileptic baboon. Front Vet Sci. 2022;9:908801. doi:10.3389/fvets.2022.908801
- Meldrum BS, Brierley JB. Neuronal loss and gliosis in the hippocampus following repetitive epileptic seizures induced in adolescent baboons by allylglycine. Brain Res. 1972;48:361–365. doi:10.1016/0006-8993(72)90190-4
- Meldrum BS. Excitotoxicity and selective neuronal loss in epilepsy. Brain Pathol. 1993;3(4):405–412. doi:10.1111/j.1750-3639.1993.tb00768.x
- Streng ML, Krook-Magnuson E. The cerebellum and epilepsy. Epilepsy Behav. 2021;121(Pt B):106909. doi:10.1016/j.yebeh.2020.106909
- Allen LA, Vos SB, Kumar R, et al. Cerebellar, limbic, and midbrain volume alterations in sudden unexpected death in epilepsy. Epilepsia. 2019;60(4):718–729. doi:10.1111/epi.14689
- Walker MC, Kullmann DM. Optogenetic and chemogenetic therapies for epilepsy. Neuropharmacology. 2020;168:107751. doi:10.1016/j.neuropharm.2019.107751
- Wang Z, Larivière S, Xu Q, et al. Community-informed connectomics of the thalamocortical system in generalized epilepsy. Neurology. 2019;93(11):e1112–e1122. doi:10.1212/WNL.0000000000008096
- Holmes MD, Quiring J, Tucker DM. Evidence that juvenile myoclonic epilepsy is a disorder of frontotemporal corticothalamic networks. Neuroimage. 2010;49(1):80–93. doi:10.1016/j.neuroimage.2009.08.004
- Realmuto S, Zummo L, Cerami C, et al. Social cognition dysfunctions in patients with epilepsy: evidence from patients with temporal lobe and idiopathic generalized epilepsies. Epilepsy Behav. 2015;47:98–103. doi:10.1016/j.yebeh.2015.04.048
- Ratcliffe C, Wandschneider B, Baxendale S, et al. Cognitive function in genetic generalized epilepsies: insights from neuropsychology and neuroimaging. Front Neurol. 2020;11:144. doi:10.3389/fneur.2020.00144
- Aghakhani Y, Bagshaw AP, Bénar CG, et al. FMRI activation during spike and wave discharges in idiopathic generalized epilepsy. Brain. 2004;127(Pt 5):1127–1144. doi:10.1093/brain/awh136
- Colciaghi F, Finardi A, Nobili P, et al. Progressive brain damage, synaptic reorganization and NMDA activation in a model of epileptogenic cortical dysplasia. PLoS One. 2014;9(2):e89898. doi:10.1371/journal.pone.0089898
- Olson IR, Plotzker A, Ezzyat Y. The enigmatic temporal pole: a review of findings on social and emotional processing. Brain. 2007;130:1718–1731. doi:10.1093/brain/awm052
- Pascual B, Masdeu JC, Hollenbeck M, et al. Largescale brain networks of the human left temporal pole: a functional connectivity MRI study. Cerebral Cortex. 2013;25:680–702. doi:10.1093/cercor/bht260
- McGonigal A, El Youssef N, Bartolomei F, et al. Interictal 18F-FDG brain PET metabolism in patients with postictal EEG suppression. Epilepsy Behav. 2021;116:107742. doi:10.1016/j.yebeh.2020.107742
- Li Y, Chen Q, Huang W. Disrupted topological properties of functional networks in epileptic children with generalized tonic-clonic seizures. Brain Behav. 2020;10(12):e01890. doi:10.1002/brb3.1890