Abstract
Background
The aim of this study was to search for predictors of acute side effects of stimulant medication in pediatric attention deficit/hyperactivity disorder (ADHD), emphasizing variables from quantitative electroencephalography (QEEG), event-related potentials (ERPs), and behavior data from a visual continuous-performance test (VCPT).
Methods
Seventy medication-naïve ADHD patients aged 7–16 years were tested with QEEG, including a go/no-go task condition (VCPT) from which behavior data and ERPs were extracted, followed by a systematic trial on stimulant medication lasting at least 4 weeks. Based on data from rating scales and interviews, two psychologists who were blind to the QEEG/ERP test results independently rated the patients as having no or small side effects (n = 37) or troublesome side effects (n = 33). We determined if the side effects were related to sex, age, IQ, ADHD subtype, comorbidities, clinical outcome, and variables in QEEG, ERPs, and VCPT.
Results
There was a moderate negative correlation between clinical outcome and side effects. Three variables were significantly associated with side effects in a multivariate logistic regression analysis. In the ERP independent component – contingent negative variation – which reflected action preparation and time evaluation, patients with high amplitudes (close to normal values) experienced more side effects than patients with lower amplitudes. A faster-than-normal reaction time in VCPT was associated with side effects, as was a high amplitude in an early ERP component (early visual independent component), reported to be influenced by attention, perceptual sensitivity, and anxiety.
Conclusion
The group with troublesome side effects had normal action-preparation electrical brain activity, a faster-than-normal reaction time, and an increased level of anxiety (measured by ERP) compared with the no side-effects group.
Introduction
Attention deficit/hyperactivity disorder (ADHD)Citation1,Citation2 is considered a neurodevelopmental disorder, with a prevalence of approximately 3%–6% in school-age children.Citation3 It is characterized by age-inappropriate levels of inattention and/or hyperactivity and impulsivity, creating significant impairment in social relations and in school and home environments. Comorbid conditions like disorders of behavior, anxiety, and learning are seen in the majority of cases.Citation4 The most common treatment for children with ADHD is the use of psychostimulants like methylphenidate (MPH), dextroamphetamine (DEX) and the nonstimulant atomoxetine. MPH has shown a therapeutic response in approximately 70% of patients.Citation5 A shift to DEX or atomoxetine for nonresponders increases therapeutic effects to 80%.Citation6 Therapeutic response to MPH may vary from patient to patient, and includes a reduction of motor hyperactivity, more focused task-oriented behavior, reduction of impulsive behavior, improved executive function, and reduced emotional lability.Citation7–Citation12
The disadvantages and limitations of stimulants include side effects (SEs), reservations about taking medication, and 10%–25% non-responders.Citation13,Citation14 The most common SEs are loss of appetite and insomnia. Preexisting comorbid conditions like anxiety, mental retardation, and autism spectrum disorder may increase the risk for adverse effects.Citation15–Citation20 Acute neurological SEs are headaches, dizziness, and sleep problems. Psychiatric SEs, although rare and usually solvable, include irritable mood, dysphoria, enhanced depressive symptoms, cognitive overfocusing, tics, and psychotic symptoms.Citation21 Sonuga-Barke et alCitation20 found that adverse events related to emotionality or sleep and appetite were not predictable from patients’ personal and clinical characteristics, such as age, sex, weight, height, and comorbid conditions. They found limited evidence that adverse effects were related to therapeutic effects. A negative correlation has been reported between therapeutic effects and mood/anxiety SEs.Citation22
Using electroencephalography (EEG), a large number of studies have found excess theta activity (4–7 Hz) and/or an increased theta:beta ratio (ie, 4–7 Hz: 13–21 Hz) in ADHD, in agreement with theories of cortical underactivation.Citation23 Newer studies, however, have found that the excessive theta:beta ratio characterizes only a subgroup of ADHD. We recently found this pattern in 26% of pediatric ADHD patients, compared to 2.5% in healthy controls.Citation23,Citation24 In addition to excess theta, other EEG-based subtypes of ADHD have been reported: excess beta, low alpha peak, and hypercoherence.Citation23,Citation25–Citation29
Event-related potentials (ERPs) reflect electrical cortical responses to stimuli in various task conditions, and are obtained by averaging the brain’s electrical response to the stimuli over a number of trials. ERPs exhibit characteristic peaks and troughs, which are associated with underlying stages of sensory-related and action-related information flow in various cortical areas. The early ERP waves associated with visual processing (P1, N1, and N2 waves), peaking 100–200 ms after stimulus presentation, seem to form a cluster that is sensitive to emotional content and anxiety/perceptual sensitivity.Citation30 The P3b wave can be found in paradigms like oddball and go/no-go, where action is involved.Citation31 Many studies have found the P3 waves (peaking 300–500 ms after stimulus presentation) to be deviant in ADHD.Citation32–Citation34 In addition, deviations are found for the contingent negative variation (CNV), a low potential evoked in cued paradigms (go/no-go, signal stop) when an individual prepares for action.Citation35–Citation37 In a recent longitudinal study,Citation38 the main finding was that CNV was the only ERP component that had significantly smaller amplitudes in ADHD at all ages compared with healthy controls. The CNV can be seen as a dopaminergic biomarker, since the amplitude of this component was shown to increase following intake of stimulant medication in a group of healthy young adults.Citation39
ERP waves are regarded as the sum of multiple sources generated in different locations and associated with different neural processes.Citation40 Attempts have been made to separate these multiple sources comprising the ERP waves, including the use of independent component analysis (ICA).Citation41 One approach to the use of ICA in ERP research is its application on averaged ERPs recorded in few task conditions across many individuals.Citation42,Citation43 In a previous study of ours, this approach has been applied to ERPs elicited in the go/no-go paradigm, showing that the traditional ERP waves can be decomposed into reliable independent components (ICs) with different functional meanings.Citation44,Citation45 For adults with ADHD, these ICs have been shown to have strong discriminative power.Citation46 We used ICs from the same visual go/no-go task that were used in the studies cited in this paragraph.
Although the literature on quantitative EEG (QEEG) and ERPs in ADHD is relatively extensive, we found no studies that focused explicitly on acute SEs of stimulants. The aim of the present study was to search for variables predicting SEs of stimulant medication in pediatric ADHD. The primary aim was to see if parameters in a go/no-go test (visual continuous-performance test [VCPT]), EEG spectra, and ERPs – variables in research found to be associated with ADHD – can predict acute SEs of stimulant medication. We also analyzed the data with regard to clinical outcome, ie, reduction of symptoms as a result of medication, focusing on the relation between SEs and clinical outcome. Based on the literature and on clinical experience, we hypothesized that comorbid conditions and indexes of anxiety in QEEG and ERPs (increased beta, excess power in ERP early components) would increase the risk of acute SEs.
Methods
Patients
Seventy unselected, consecutive clinical cases were examined and included in the study. They had been referred to a neuropsychiatric team in the county of Østfold, Norway. They had been screened by the school psychology service, the GP, or the local child psychiatry outpatient clinic with regard to symptoms of ADHD. They were referred for further diagnostic assessment and treatment. The 70 patients were diagnosed with ADHD, combined or inattentive subtype. The majority had comorbid diagnoses (). All diagnostic conclusions were in accordance with the Diagnostic and Statistical Manual of Mental Disorders, fourth edition, and based on clinical interviews with parents (Kiddie Schedule for Affective Disorders and Schizophrenia or Development and Well-Being Assessment scales);Citation47,Citation48 developmental and medical history; rating scales from parents, teachers, and in some cases self-reports; and intelligence testing (Wechsler Intelligence Scale for Children III/IV or the abbreviated form Wechsler Abbreviated Scale of Intelligence). These data were supplemented with neuropsychological assessment, reports from the school psychology service and GP, and in some cases more informal meetings with parents and teachers. In most cases, Conners’ Rating Scale – Revised,Citation49 parent and teacher forms, and the Behavior Rating Inventory of Executive FunctionCitation50 were used. Reports from the schools and the school psychology service included information regarding learning problems, needs for special education, social function, and behavior. Diagnostic conclusions were discussed in the team, consisting of two specialists in neuropsychology, a pediatrician, and an educator specializing in school psychology. Learning disorders comprised a mixed group of general learning disabilities: IQ below 80 and significant learning problems in several school subjects requiring special education, and specific learning disabilities, including dyslexia, dyscalculia, and IQ above 80. The category – “other disorders” – included Tourette’s syndrome and reactive attachment disorder.
Table 1 Demographics of the sample by sex
After diagnostic conclusions were drawn, all 70 patients were offered a systematic trial on stimulant medication lasting at least 4 weeks. The standard procedure was MPH single tablets during the trial period, titrated from 5 mg × 1 per day up to a maximum of 20 mg × 3 per day, or lower if SEs occurred, or if significant clinical effects were observed on lower doses. Seven of the patients underwent a similar procedure on DEX. (A Chi-squared test showed no difference between DEX and MPH regarding SEs [P = 1.0]). Parents and teachers filled in daily ratings of ADHD symptoms before the trial period started and during the 4-week period. Children 10 years or older were asked to fill in daily self-ratings. The Barkley Stimulant Side Effects Rating Scale was used weekly in the majority of cases, the first registration before onset of medication. The parents were invited to contact us with any questions during this period. After 4 weeks, we arranged a meeting with parents and teachers. The majority of patients older than 12 years also accepted the invitation. Parents, teachers, and children were asked informally to tell us about the last 4 weeks. Was there anything new, anything positive, or anything negative? Did they perceive any changes that the medication had brought about? What were the effects of increased doses? We also asked about SEs, compared with the weeks before medication started. The rating scales were examined, and a conclusion was usually drawn about further medication. This decision was followed by telephone contacts and meetings as needed before the case was referred back to the outpatient clinic.
The forms used to evaluate therapeutic effects and SEs were not the same in all cases. Some key information conveyed in meetings and phone calls did not show up in the rating scales. We therefore used the following method to evaluate SEs: all information from meetings, phone calls, rating scales, and testing was registered in the patient journals. This information, which did not contain data from QEEG/ERP testing, was independently evaluated by the first author and a psychologist in the team. The following criteria were used: a score of 0 was given if no SEs were reported or if they disappeared within a few days and did not represent a problem. A score of 1 was given if SEs continued to be a problem. Troublesome SEs sometimes resulted in a change to another stimulant or dose, or in a few cases cessation of treatment. The interrater reliability was 0.9. Cases of disagreement were discussed before conclusions were drawn. In 24 of 33 side-effect cases, medication was continued because of positive therapeutic effects and actions taken to reduce the impact of SEs.
A similar procedure was used in evaluation of clinical outcome, starting with a 2-1-0 scale (2, significant positive changes; 1, moderate changes, or only seen at school or at home; 0, small/insignificant or negative clinical changes). These ratings were later converted into a 1-0 scale. The agreement on the 2-1-0 scale was 80% before discussions. The parents gave written consent for their children to participate, and the children were informed. The project was approved by the Regional Committee for Medical Research Ethics.
Normal controls
In the final model, three variables discriminated significantly between the two clinical groups. The results on thesevariables were compared with a group of 40 sex- and age-matched normal controls from the HBImed database (www.hbimed.com). The controls were typically developing children without neurological disorders, learning disabilities, or psychiatric problems. The testing procedures were identical for patients and controls.
Assessment of QEEG and ERP
EEG was recorded using a Mitsar 201, a PC-controlled 19-channel EEG system (Mitsar Co Ltd, Saint Petersburg, Russia). The input signals referenced to the linked ears were filtered between 0.5 and 50 Hz and digitized at a sampling rate of 250 Hz. Impedance was kept below 5 kΩ for all electrodes. Electrodes were placed according to the International 10–20 system, using an electrode cap with tin electrodes (Electro-Cap International, Eaton, OH, USA). Quantitative data were obtained using WinEEG software (Mitsar Co Ltd), common-reference montage, prior to data processing.Citation51 Eye-blink artifacts were corrected by zeroing the activation curves of individual ICA components corresponding to eye blinks.Citation51 In addition, epochs of the filtered EEG with excessive amplitude (>100 μV) and/or presenting with excessively fast (>35 μV in the 20–35 Hz band) and slow (>50 μV in the 0–1 Hz band) frequency activities were automatically marked and excluded from further analysis. Finally, the EEG was manually inspected to verify artifact removal. All 70 patients and controls were tested in eyes-closed, eyes-open, and task conditions in a go/no-go task (VCPT), lasting 20 minutes and consisting of 400 pairs of pictures. The instructions were to press the button only when the two pictures in a pair are animals, and not “animal-plant,” “plant-human,” or “plant-plant” (100 pairs of pictures in each category). ERPs were recorded during VCPT.
Variables in the model
The differences between the two groups (before medication) were checked on continuous and categorical/dichotomous variables, from five categories. The logistic regression model contained twelve continuous and six dichotomous variables.
Category 1: demographic variables – sex, age, IQ
Category 2: diagnostic variables – subtype of ADHD (ADHD-C or ADHD-I); comorbidity (behavior problems [oppositional defiant disorder (ODD)/conduct disorder], emotional problems [anxiety/depression], learning disorders, and autism spectrum disorders)
Category 3: test variables from the VCPT test – omission errors, commission errors, reaction time (RT), and RT variability
Category 4: deviances in QEEG spectra – grand average spectra for the SE and no-SE groups were computed in WinEEG. No significant differences between the groups were found. This finding was confirmed when each patient was compared with the HBI database and classified as deviant or not in theta, beta, or alpha bands. No individual data regarding spectra were exported to the statistics program SPSS (IBM, Armonk, NY, USA) for further analysis. Alpha peak frequency, defined as frequency with maximal reduction in alpha power from the eyes-closed to the eyes-open condition, was registered for each individual
Category 5: in WinEEG, differences between the two groups were checked for a number of traditional ERPs (waves) reported in the ADHD literature, and corresponding IC ERPs. Four ERP components (described below) were significantly different between the two groups in WinEEG, and were further explored by exporting individual data to SPSS.
The method of decomposing ERPs into ICs is described by Kropotov et alCitation44,Citation51 and Brunner et al.Citation45 In this study, the filters for ICs were based on more than 100 age-matched healthy controls from the HBI database.
The following ERPs were used in the statistical analyses: IC early visual (mean power at site O1 in the time interval 100–300 ms after stimulus 1), P3 go wave (mean power at site T5 in the time interval 330–550 ms after stimulus 2), and IC CNV late (mean power at site Cz in the time interval 900–1,100 ms after stimulus 1). The time intervals were selected on the basis of the grand-average files.
For variables IC cue P3 (appearing after stimulus 1 when it is a target) at site Pz and IC P3 no-go early at site Cz, peak values in μV and latencies in milliseconds were registered individually. The time window was defined by the grand-average files. Explicit scoring criteria, including rules for scoring difficult cases, were followed for both groups.
Statistical methods
Logistic regression was used to identify factors associated with SEs of stimulant medication. In the first step, all 18 variables were checked for significant differences between the groups based on t-tests (continuous variables) and chi-squared analysis (categorical variables). All variables were correlated. Because we found no correlations >0.70 or <−0.70, no variables were excluded from the model. All significant variables in step 1 were used in logistic regression applying forward variable selection (Wald). Statistical analyses were performed in SPSS, and significance level was set at 5%.
Results
The positive effects of medication reported for the group of 52 medication responders were put into the following partly overlapping categories: emotion – increased emotional stability, reduced irritability, better mood; social – improved social interaction, reduction of peer conflicts; attention – improvements in attention, academic function, homework, better vigilance, more focused; executive function – increased initiative, less dependent on others, better routines, completing tasks; impulsivity – reduction in impulsive acts; hyperactivity – reduction of overactivity and restlessness; alert – more awake, engaged, increased effort; other – reduced fatigue, fewer tics. The ratings were as follows: emotion 17, social 9, attention 43, executive function 13, impulsivity 6, hyperactivity 19, alert 5, other 5.
The SEs experienced in the 33 children in the SE group were loss of appetite (eight), increased insomnia (eleven), more stomach pain (five), more headaches (four), increased anxiety (nine), and increased lability/irritability/mood swings (14).
Five continuous and two categorical variables were significantly different in the SE and no-SE groups. Four of these were ERP components: IC early visual, IC CNV late, IC no-go early amplitude and P3 go (wave) (see and ). We also found significantly more SEs in boys than in girls, and more in the group with comorbid learning disabilities. Logistic regression, forward variable selection (Wald), was performed to assess the impact of the seven significant variables on the likelihood of acute SEs of stimulant medication. The model as a whole explained 53% (Nagelkerke R2) of the variance in SE status.
Table 2 Independent-samples t-test showing variables with significant differences between the SE group and the no-SE group
Table 3 Categorical variables significantly different in SE and no-SE groups
Three of the independent variables were statistically significant in the multivariate logistic regression model predicting SEs (IC CNV late [action preparation], RT, and IC early visual [sensitive to anxiety]). Results for IC CNV late and IC early visual are shown in and . Increased power of the IC CNV late component – closer to normal levels – was associated with SEs. A fast RT in the VCPT task (even faster than normal controls) and increased amplitude of the IC early visual task were also associated with elevated levels of adverse events. A significant correlation of 0.32 (P = 0.01) was found between IC CNV late and RT.
Figure 1 Percent of side effects in each quartile group. The number of patients in each quartile group (1, 2, 3, 4) was 17 or 18. The figure indicates that among the 18 patients with lowest scores on the side-effects index scale, only 13% had side effects. Among the 18 patients with highest scores, 91% had side effects.
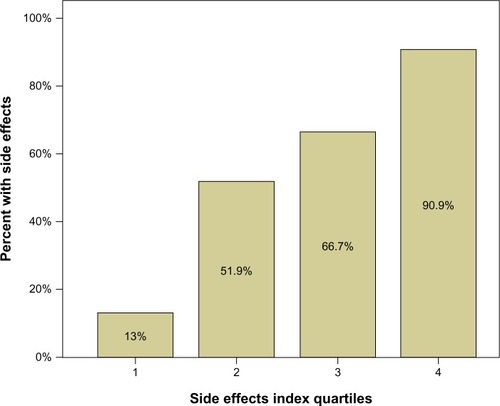
Figure 2 ERP component IC CNV late for SE group (thick black line), no-SE group (red dotted line), and normal controls (thin green line). At 1,100 ms after stimulus 1: controls, −2.92 μV; SE group, −2.35 μV; no-SE group, −0.98 μV.
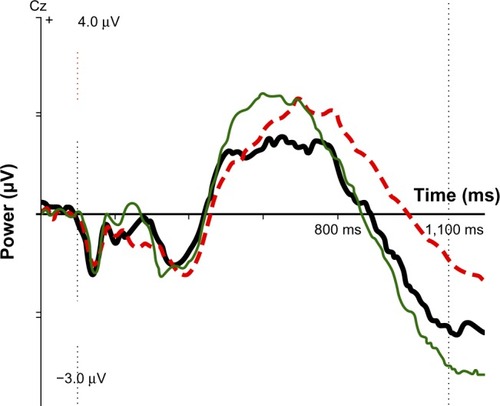
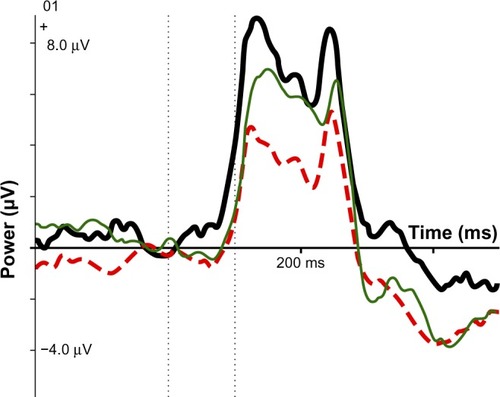
Figure 3 ERP IC early visual: SE group (thick black line), no-SE group (dotted red line), normal controls (thin green line).
These three variables were transformed into quartiles, quartile 1 on each variable representing the 25% of the children with fewest SEs. The quartile scores for each person were then summed (SE index), resulting in scores from 3 to 12. This 10-point scale was afterwards transformed to a quartile scale (SE index quartiles). shows that only 13% of the children in quartile 1 demonstrated SEs, compared to 91% in quartile 4.
Age, IQ, subtype of ADHD, comorbid behavior disorders, theta, alpha, and beta levels in EEG spectra, alpha peak frequency, ERP waves (except P3 go), omissions, commissions, and RT variability in the VCPT task were not significantly different in the SE and no-SE groups.
As mentioned, all patients were also classified as responders or nonresponders regarding outcome in the medication trial. A chi-squared analysis showed there was a significant negative correlation (r = −0.38) between responders and the SE group. The Mann–Whitney U-test was employed to test the difference between responders and nonresponders on the three variables significantly different in the SE and no-SE groups. IC CNV late close to normal levels was associated with lack of clinical effects (P = 0.028). IC early visual and RT were not significantly different in responders and nonresponders.
Comparisons with normal controls
Scores on the three significant variables were compared with 40 age- and sex-matched normal controls from the HBI database. For mean RT, controls were 457 ms, the no-SE group was 437 ms, and the SE group was 370 ms; the SE group was faster than controls and the no-SE group. As indicates, the SE group was close to normal on the IC CNV late variable, whereas the no-SE group had a small component deviating strongly from the norm. Regarding IC early visual, neither group differed significantly from the norm, but the component was stronger than the norm in the SE group and smaller than the norm in the no-SE group.
Discussion
Three variables (IC CNV late, RT, and IC early visual) contributed significantly to the prediction of acute SEs of stimulant medication. They all seemed to be related to cortical activation. Additional comparisons with normal controls were conducted with these three variables. The SE group had a close-to-normal IC CNV late, reflecting normal action preparation; a shorter-than-normal RT in the VCPT task, requiring a high readiness to respond; and an increased amplitude of the IC early visual component, indicating increased effort and/or anxiety.Citation30 Based on these variables, an index was calculated. Adverse effects were seen in only 13% of the patients in the first quartile of this index and 91% in the fourth quartile. Psychologically, the SE group seems to have been more alert or activated than the no-SE group was. They were less likely to experience positive clinical effects of stimulants (SEs and positive clinical effects correlated −0.38), and were closer to normal controls on several variables. Deficits in state regulation or activation have been linked to ADHD.Citation52–Citation54 It seems that the SE group was not as “typical ADHD” as the no-SE group.
SEs have been reported to be more common in ADHD patients with comorbid conditions like autism spectrum disorders, mental retardation, and anxiety disorders. The number of patients with comorbid autism spectrum disorder/Asperger’s syndrome in our sample was too small for statistical analysis. SEs were more common in the approximately 50% of our group with comorbid learning disabilities, perhaps partly reflecting some other underlying pathology. There were no significant differences between the SE group and the no-SE group regarding comorbid emotional or behavior disorders based on clinical interviews and rating scales. The ERP component IC early visual is assumed to be influenced by anxiety, however. Our hypothesis of increased SEs in the group with comorbid emotional/anxiety disorder was supported by this finding. In addition, trait anxiety has been associated with increased amplitude of CNV, interpreted as a compensatory mechanism to maintain normal task performance.Citation37 An alternative or supplementary explanation to normal CNVs in the SE group is that this factor also reflects an increased level of anxiety.
Although significantly different in the SE and no-SE group, two categorical and two continuous variables did not contribute to the final predictive model. We found that boys exhibited significantly more acute SEs than girls did. We can offer no obvious explanation for this finding, which requires confirmation from other studies. IC no-go early amplitude was closer to normal levels in the SE group than in the no-SE group. The amplitude of this component, corresponding to the early part of the P3 no-go wave, has been found in several studies to be smaller in ADHD patients than in healthy controls.Citation34 We also found that the P3 go-wave amplitude was closer to normal levels in the SE group than in the no-SE group. No differences between the clinical groups were found regarding IQ, age, subtype of ADHD, or comorbid ODD, partly confirming the findings of Sonuga-Barke et al.Citation20 Deviances in EEG spectra did not differ between the two groups. One of our hypotheses was not confirmed: that excess beta, probably representing high levels of activation or anxiety, would be more common in the SE group.
Limitations of the study
As in most regression analyses considering many factors, the effect of some variables may be overestimated, needing confirmation from other studies. On the other hand, the three variables significantly associated with SEs seem to form a meaningful cluster, supporting the view that they are not random.
Our data lend support to the view that such SEs as increased problems with sleep, appetite, irritability, emotional lability, and anxiety can be considered a unity. The systematic use of a scale like the Barkley Stimulant Side Effects Rating Scale may obtain more details regarding subtypes of SEs, but in the clinic the most important question is whether there are serious SEs or not.
When interpreting IC ERPs, we refer to the literature based on ERP waves. So far, there have been few studies explicitly documenting these interpretations. In some cases, we found significant differences between the groups based on ERP waves (CNV, P3 no-go). We reported the corresponding IC ERPs because they demonstrated more significant differences and larger effect sizes.
Conclusion and clinical implications
A substantial number of children with ADHD for whom medication is initiated discontinue treatment. A recent studyCitation55 found SEs in 58% of discontinuers vs 21% in continuers, lending support to the common clinical experience that SEs relatively often result in discontinuation of treatment. Our SE index may be helpful in predicting who is at greatest risk for adverse events and in need of more careful titration, medication follow-up, or consideration of other treatment options.
On several variables, we found that the SE group was closer to normal controls and less underactivated than the no-SE group. This study also lends some support to the view that serious SEs of stimulant medication may be an indication of another primary disorder or significant problems related to comorbidity.
Acknowledgments
This study was financially supported by Østfold Hospital Trust, Norway. Professionally, the project is connected to the Institute of Psychology, Norwegian University of Science and Technology (NTNU), Trondheim, Norway. The statistical consultant was professor in statistics Leiv Sandvik, Oslo University Hospital. Access to healthy controls in the HBI database was given by Dr Andreas Müller, director of the Research Clinic, Chur, Switzerland, and CEO Brain and Trauma Foundation, Switzerland.
Disclosure
The authors report no conflicts of interest in this work.
References
- [No authors listed]Clinical practice guideline: Diagnosis and evaluation of the child with attention-deficit/hyperactivity disorderPediatrics200010551158117010836893
- American Psychiatric AssociationDiagnostic and Statistical Manual of Mental Disorders4th ed text revisionWashingtonAmerican Psychiatric Association2000
- PolanczykGJensenPEpidemiologic considerations in attention deficit hyperactivity disorder: a review and updateChild Adolesc Psychiatr Clin N Am200817224526018295145
- GillbergCGillbergICRasmussenPCo-existing disorders in ADHD – implications for diagnosis and interventionEur Child Adolesc Psychiatry200413Suppl 1I80I9215322959
- SpencerTBiedermanJWilensTHardingMO’DonnellDGriffinSPharmacotherapy of attention-deficit hyperactivity disorder across the life cycleJ Am Acad Child Adolesc Psychiatry19963544094328919704
- BarkleyRAAttention-Deficit Hyperactivity Disorder: A Handbook for Diagnosis and Treatment3rd edNew YorkGuilford2006
- ZeinerPBryhnGBjerckeCTruyenKStrandGResponse to methylphenidate in boys with attention-deficit hyperactivity disorderActa Paediatr199988329830310229041
- TannockRSchacharRJCarrRPChajczykDLoganGDEffects of methylphenidate on inhibitory control in hyperactive childrenJ Abnorm Child Psychol19891754734912681316
- SchweitzerJBLeeDOHanfordRBEffect of methylphenidate on executive functioning in adults with attention-deficit/hyperactivity disorder: normalization of behavior but not related brain activityBiol Psychiatry200456859760615476690
- BiedermanJPettyCRDoyleAEStability of executive function deficits in girls with ADHD: a prospective longitudinal followup study into adolescenceDev Neuropsychol2008331446118443969
- PietrzakRHMollicaCMMaruffPSnyderPJCognitive effects of immediate-release methylphenidate in children with attention-deficit/hyperactivity disorderNeurosci Biobehav Rev20063081225124517161238
- AtkinsonMHollisCNICE guideline: attention deficit hyperactivity disorderArch Dis Child Educ Pract Ed2010951242720145015
- TaylorEDöpfnerMSergeantJEuropean clinical guidelines for hyperkinetic disorder – first upgradeEur Child Adolesc Psychiatry200413Suppl 1I7I3015322953
- BanaschewskiTCoghillDSantoshPLong-acting medications for the hyperkinetic disorders. A systematic review and European treatment guidelineEur Child Adolesc Psychiatry200615847649516680409
- SolantoMNewcornJVailLGilbertSIvanovILaraRStimulant drug response in the predominantly inattentive and combined subtypes of attention-deficit/hyperactivity disorderJ Child Adolesc Psychopharmacol200919666367120035584
- AhmannPAWaltonenSJOlsonKATheyeFWVan EremAJLaPlantRJPlacebo-controlled evaluation of ritalin side effectsPediatrics1993916110111068502509
- BarkleyRAMcMurrayMBEdelbrockCSRobbinsKSide effects of methylphenidate in children with attention deficit hyperactivity disorder: a systemic, placebo-controlled evaluationPediatrics19908621841922196520
- RapportMDKoflerMJCoiroMMRaikerJSSarverDEAldersonRMUnexpected effects of methylphenidate in attention-deficit/hyperactivity disorder reflect decreases in core/secondary symptoms and physical complaints common to all childrenJ Child Adolesc Psychopharmacol200818323724718582178
- EfronDJarmanFBarkerMSide effects of methylphenidate and dexamphetamine in children with attention deficit hyperactivity disorder: a double-blind, crossover trialPediatrics199710046626669310521
- Sonuga-BarkeEJCoghillDWigalTDeBackerMSwansonJAdverse reactions to methylphenidate treatment for attention-deficit/hyperactivity disorder: structure and associations with clinical characteristics and symptom controlJ Child Adolesc Psychopharmacol200919668369020035586
- GrahamJCoghillDAdverse effects of pharmacotherapies for attention-deficit hyperactivity disorder: epidemiology, prevention and managementCNS Drugs200822321323718278977
- LeeJGrizenkoNBhatVSenguptaSPolotskaiaAJooberRRelation between therapeutic response and side effects induced by methylphenidate as observed by parents and teachers of children with ADHDBMC Psychiatry2011117021510895
- LooSKMakeigSClinical utility of EEG in attention-deficit/hyperactivity disorder: a research updateNeurotherapeutics20129356958722814935
- OgrimGKropotovJHestadKThe quantitative EEG theta/beta ratio in attention deficit/hyperactivity disorder and normal controls: sensitivity, specificity, and behavioral correlatesPsychiatry Res2012198348248822425468
- ArnsMGunkelmanJBretelerMSpronkDEEG phenotypes predict treatment outcome to stimulants in children with ADHDJ Integr Neurosci20087342143818988300
- LiechtiMDValkoLMüllerUCDiagnostic value of resting electroencephalogram in attention-deficit/hyperactivity disorder across the lifespanBrain Topogr201326113515123053601
- BarryRJClarkeARJohnstoneSJA review of electrophysiology in attention-deficit/hyperactivity disorder: I. Qualitative and quantitative electroencephalographyClin Neurophysiol2003114217118312559224
- ClarkeARBarryRJMcCarthyRSelikowitzMEEG-defined subtypes of children with attention-deficit/hyperactivity disorderClin Neurophysiol2001112112098210511682348
- ClarkeARBarryRJMcCarthyRSelikowitzMExcess beta activity in children with attention-deficit/hyperactivity disorder: an atypical electrophysiological groupPsychiatry Res20011032–320521811549408
- HajcakGWeinbergAMacNamaraAFotiDERPs and the study of emotionLuckSJKappenmanESThe Oxford Handbook of Event-Related Potential ComponentsNew YorkOxford University Press2012441473
- FalkensteinMHoormannJHohnsbeinJERP components in Go/Nogo tasks and their relation to inhibitionActa Psychol (Amst)19991012–326729110344188
- BrandeisDBanaschewskiTBavingLMulticenter P300 brain mapping of impaired attention to cues in hyperactive childrenJ Am Acad Child Adolesc Psychiatry200241899099812162635
- WiersemaJRRoeyersHERP correlates of effortful control in children with varying levels of ADHD symptomsJ Abnorm Child Psychol200937332733619037722
- JohnstoneSJBarryRJClarkeARTen years on: a follow-up review of ERP research in attention-deficit/hyperactivity disorderClin Neurophysiol2013124464465723063669
- van RijnHKononowiczTWMeckWHNgKKPenneyTBContingent negative variation and its relation to time estimation: a theoretical evaluationFront Integr Neurosci201159122207841
- BruniaCHMvan BoxtelGJMBöckerKBENegative slow waves as indices of anticipationLuckSJKappermannESThe Oxford Handbook of Event-Related Potential ComponentsNew YorkOxford University Press2012189208
- AnsariTLDerakshanNThe neural correlates of cognitive effort in anxiety: effects on processing efficiencyBiol Psychol201186333734821277934
- DoehnertMBrandeisDSchneiderGDrechslerRSteinhausenHCA neurophysiological marker of impaired preparation in an 11-year follow-up study of attention-deficit/hyperactivity disorder (ADHD)J Child Psychol Psychiatry201354326027022788246
- LinssenAMVuurmanEFSambethAContingent negative variation as a dopaminergic biomarker: evidence from dose-related effects of methylphenidatePsychopharmacology (Berl)2011218353354221597989
- KappenmanESLuckSJERP components: the ups and downs of brainwave recordingsLuckSJKappenmanESThe Oxford Handbook of Event-Related Potential ComponentsNew YorkOxford University Press2012329
- MakeigSBellAJJungTIndependent component analysis of electroencephalographic dataAdv Neural Inf Process Syst19968145151
- KropotovJDPonomarevVADecomposing N2 nogo wave of event-related potentials into independent componentsNeuroreport200920181592159619904220
- OlbrichHMMaesHValeriusGLangoschJMFeigeBEvent-related potential correlates selectively reflect cognitive dysfunction in schizophrenicsJ Neural Transm2005112228329515657643
- KropotovJDPonomarevVAHollupSMuellerADissociating action inhibition, conflict monitoring and sensory mismatch into independent components of event related potentials in go/nogo taskNeuroimage201157256557521571079
- BrunnerJFHansenTIOlsenASkandsenTHåbergAKropotovJLong-term test-retest reliability of the P3 nogo wave and two independent components decomposed from P3 NoGo wave in a visual go/nogo taskInt J Psychophysiol Epub6122013
- MuellerACandrianGGraneVAKropotovJDPonomarevVABascheraGMDiscriminating between ADHD adults and controls using independent ERP components and a support vector machine: a validation studyNonlinear Biomed Phys20115521771289
- KaufmanJBirmaherBBrentDSchedule for affective disorders and schizophrenia for school-age children-present and lifetime version (K-SADSPL): Initial reliability and validity dataJ Am Acad Child Adolesc Psychiatry1997369809889204677
- GoodmanRFordTRichardsHGatwardRMeltzerHThe development and well-being assessment: description and initial validation of an integrated assessment of child and adolescent psychopathologyJ Child Psychol Psychiatry200041564565510946756
- ConnersCKSitareniosGParkerJDEpsteinJNThe revised Conners’ Parent Rating Scale (CPRS-R): factor structure, reliability, and criterion validityJ Abnorm Child Psychol19982642572689700518
- GioiaGAIsquithPKBRIEF: Behavior Rating Inventory of Executive FunctionLutz (FL)PAR2000
- KropotovJDQuantitative EEG Event-Related Potentials and NeurotherapyAmsterdamElsevier2009
- van der MeereJThe role of attentionSandbergSHyperactivity Disorders of ChildhoodCambridge University Press1996111148
- JärveläinenLPauliinaNEvent Related Brain Potential (ERP) Correlates of Activation and Effort in State Regulation among Children with Attentional ProblemsJyväskylä, FinlandUniversity of Jyväskylä2000
- SergeantJThe cognitive-energetic model: an empirical approach to attention-deficit hyperactivity disorderNeurosci Biobehav Rev200024171210654654
- ToomeySLSoxCMRusinakDFinkelsteinJAWhy do children with ADHD discontinue their medication?Clin Pediatr (Phila)201251876376922584541