
Abstract
This paper illustrates a sequential item development process to create a new self-report instrument of depression refined with Rasch analysis from a larger pool of potential diagnostic items elicited through a consensus approach by clinical experts according to the latest edition of the Diagnostic and Statistical Manual of Mental Disorders criteria for major depression. A 51-item pool was administered to a sample of 529 subjects (300 healthy community-dwelling adults and 229 psychiatric outpatients). Item selection resulted in a 21-item set, named the Teate Depression Inventory, with an excellent Person Separation Index and no evidence of bias due to an item–trait interaction (χ2=147.71; df =168; P=0.48). Additional support for the unidimensionality, local independence, appropriateness of the response format, and discrimination ability between clinical and nonclinical subjects was provided. No substantial differential item functioning by sex was observed. The Teate Depression Inventory shows considerable promise as a unidimensional tool for the screening of depression. Finally, advantages and disadvantages of this methodology will be discussed in terms of subsequent possible mathematical analyses, statistical tests, and implications for clinical investigations.
Introduction
Depression is one of the most clinically relevant psychiatric disorders, and many assessment instruments have been developed to measure it. If left unrecognized and untreated, depressive disorders may result in the onset of physical, cognitive, and social impairment,Citation1–Citation4 as well as increased health care utilization and elevated societal costs.Citation5,Citation6 Thus, assessing the severity of depression is an important challenge that both clinicians and health assessment researchers face.Citation7 Self-report measures may provide time-saving tools to screen for the presence of, and discrimination between, different levels of depression.Citation8 According to Nezu’sCitation9 rating, the self-rating scales of depression with both high clinical and research utility are the Self-Rating Depression Scale of Zung, the Center for Epidemiological Studies Depression Scale (CES-D), and the Beck Depression Inventory-II (BDI-II).Citation10–Citation13 These established measures, developed according to classical test theory (CTT), have shown some psychometric limitations, mainly inherent in the theory assumptions.Citation14–Citation20 First, their traditional method of scoring (ie, to compute a raw total score by summing responses to individual items), by weighing each item equally, assumes that each item or symptom on the scale represents a comparable level of psychiatric severity, so that a score of 4 (always) could be obtained for endorsement of “suicidal thoughts” but also for endorsement of “feeling blue,” although feeling blue should be considered a “less severe” item on the spectrum, whereas suicidal thoughts is clearly a “more severe” symptom.Citation21–Citation25
Second, the comparison of total scores between different populations assumes that each item has identical properties across samples. Whether items are equally effective across different samples is debatable. Items that reliably discriminate between high and low levels of depression in psychiatrically ill patients may not be equally effective in assessing severity of depression in medically ill patients. The sample-dependent psychometric characteristics of these depression instruments might aggravate the comparison of results across different samples or studies.Citation23
Third, the total score method assumes that each symptom on the scale is equally related to the construct of interest. The violation of this assumption is also easy, as the use of factor analytic methods to determine latent structure in psychopathology research may mask the presence of a general, second-order, psychological distress factor.Citation26,Citation27
In the aforementioned depression instruments, the unidimensionality has been found lacking because some items related to a different latent trait, such as physical illness, were included.Citation12,Citation18,Citation19,Citation28–Citation31 Thus, the use of a single summed score might obscure the distinct dimensions encased within it and result in its unclear interpretation. Accordingly, two individuals with the same total score might differ in terms of the relative severity and frequency of different components of depressive symptomatology. Under these conditions, any effects of an intervention targeting only one of these aspects would be harder to detect.
Fourth, the scoring method of the aforementioned CTT-based depression measures assumes that the distance that separates each pair of adjacent categories of the underlying construct is equal in each item and the response scale for each item (eg, five-point Likert scale) functions as intended, although no techniques for evaluating this assumption is provided. Violation of this assumption could lead to misinference of the findings deriving from these instruments. Considering a five-level rating scale: never, almost never, often, sometimes, and always (scored 0, 1, 2, 3, and 4, respectively), a reduction from category 2 to category 0 represents a greater relief than a change from category 2 to category 1, but not necessarily twice as much. These numbers indicate only an ordering relationship and cannot be considered as measures.Citation32–Citation35 Nevertheless, sophisticated parametric analyses, such as change scores, or parametric effect sizes, are often performed on scores obtained on these ordinal scales.Citation32–Citation34
In addition, several authors have criticized some of the depression measures for being lengthy, laborious, and exhausting for patients, especially when applied repeatedly in order to track changes.Citation36–Citation39 For example, the BDI-II includes 21 depressive symptoms, each of which is represented by four items with increasing severity. Thus, a total of more than 80 statements have to be processed. This can pose an excessive demand for severely depressed patients and result in reduced clinical efficiency. Further problems may arise on content grounds. For example, the CES-D and the BDI-II contain items tapping various types of anxiety. The inclusion of the nondepression-related content might contribute to the discriminant validity problems, unnecessarily enlarge test burden, and reduce their specificity for clinical depression substantially.Citation17,Citation20,Citation40
Alternative psychometric models, such as the Rasch measurement model,Citation41 have been found to offer a useful approach to addressing some drawbacks of the CTT-based instruments and to develop new assessment measures to use in psychiatric settings.Citation19,Citation23,Citation42–Citation46 The Rasch model allows the assessment of the performance of each individual item rather than the total score, as in CTT, on the basis of the assumption that the probability of endorsing any response category to an item is given by a logistic function of the difference between a person’s ability (in this case, a patient’s depression level and item difficulty (the level of depression expressed by the item).Citation41 From the observed answering patterns, the parameters of items and patients are calculated separately to produce estimates that are sample and item independent, respectively. This is a fundamental difference with factor analysis, in which items and subjects estimates reciprocally interfere. In other words, item parameter estimates are assumed to be sample free, and patient parameter estimates are supposed to be test free.Citation47,Citation48 Since this estimate separation, which yields the invariance of measurement property, is a mathematical property of the Rasch model, but not of the data, it is necessary to check if the formally assumed invariance “holds” empirically too.Citation49 If the model fits the data structure, then the score in logits can be taken as a reasonable estimate of a person’s position on the latent dimension (the depression). Thus, the main strength of the Rasch model over the CTT is to provide a transformation of the raw ordinal variable scale into an interval variable scale (using the log-odds unit, or logit).Citation27,Citation46,Citation50–Citation58 In addition, by using the Rasch model it is possible to identify a core set of items with proven psychometric properties.Citation18,Citation23,Citation59–Citation62 Furthermore, other relevant issues, such as category ordering (whether the categories of an item work as expected) and item bias, or differential item functioning (DIF), are usually addressed in a successive phase.Citation63
In sum, the properties of the Rasch model (ie, unidimensionality, local independence, invariance) provide an instrument that improves measurement precision and yields estimates, which result to be sample-free and test-free. Indeed, what we lack in the assessment of depression is an objective measure of the uniqueness of a particular individual’s depression, so that individuals with the same total score will exhibit the same depressive symptom profiles. Some Rasch-based measures of depressed mood already exist,Citation64–Citation66 and computer adaptive testing has been utilized as well.Citation67–Citation70 However, to our knowledge, there have been no attempts at applying the Rasch model, following all the steps of such strategy for developing a completely new depression mood measure.
Purpose of the study
The present study aimed at applying Rasch analysis to the item selection for a new self-report instrument of depression from a larger pool of potential diagnostic items elicited through a consensus approach by clinical experts according to the Diagnostic and Statistical Manual of Mental Disorders, Fourth Edition, Text Revision (DSM-IV-TR) criteria for a major depressive episode (MDE).Citation71 Psychometric properties of a newly created measure were analyzed within the framework of the Rasch measurement model.
A core set of items with proven psychometric properties for assessing depression severity along a single dimension is expected to emerge by administering a larger pool of items to clinical and nonclinical samples. Subjects belonging to the nonclinical sample are expected to show a lower level of depression (resulting in a low level of endorsement to items reflecting high levels of depression) compared with those belonging to the clinical sample, and vice versa.
Finally, the advantages and disadvantages of the traditional strategy versus the Rasch strategy will be discussed in a comparative perspective.
Method
Measures
Teate Depression Item Pool
The Teate Depression Item Pool, which constitutes the starting pool of items to be subjected to the Rasch analysis, was created in a four-step process:
Generation of the preliminary item list. The DSM-IV-TR MDE was chosen as prototypical for representing a clinically significant depressive syndrome, and its nine diagnostic criteria served as “generating criteria” for eliciting items.Citation71–Citation73 It should be noted that in the new version of the DSM (DSM-V), the MDE criteria have remained unchanged.Citation74 Five experts (psychiatrists and psychotherapists; mean clinical experience 26.02±7.4 years) were asked to formulate simple and direct statements, similar to the typical verbal descriptions of their depressed patients, worded both negatively (representing the presence of depression) and positively (in the opposite direction, representing its absence). A total of 152 items were generated.
Rating of the initial item pool. A second group of five independent clinicians (psychiatrists and psychotherapists; mean clinical experience 21.57±4.8 years) were provided the 152 items generated in the first step, and were asked to evaluate the correspondence between each item and the DSM-IV-TR diagnostic criterion from which it was elicited, using a five-point Likert scale ranging from 0 “not at all corresponding” to 4 “extremely corresponding.” Only the items with a mean score of 2.5 or higher were retained. On the basis of these judgments, 41 items were deleted and the survey was completed by adding the instructions and the response format. Respondents were required to rate each item on a five-point Likert scale from 0 “always” to 4 “never.” The individual items measure how much of the time the symptoms have been present over the last 14 days, in order to be consistent with the DSM-IV-TR criteria for MDE.
Refinement of the initial item pool. Five psychometricians (mean experience 16.02±5.6 years in the field of clinical assessment) rated independently the 111 items that survived the previous step in terms of the degree to which they clearly and unambiguously represented any depressive symptom and adhered to the proposed response format.Citation75 Each item was retained only if it reached at least 2.5 as an average score on a five-point Likert scale ranging from 0 “not at all adequate” to 4 “extremely adequate.” Fifty-seven items were dropped. Finally, the order of the remaining 54 items was randomized for presentation on the assessment form.
Item comprehensibility examination. Twenty nonclinical subjects (50% females; mean age 33.14±10.58 years) and 20 outpatients (50% females; mean age 34.35±5.25 years) with various psychiatric diagnoses were asked to read each item and evaluate its comprehensibility. Following their suggestions, three items were removed and four reformulated. The final item pool consisted of 51 statements, 36 negatively and 15 positively worded, with at least five items assessing each DSM-IV-TR diagnostic criterion for the MDE.
General neuropsychiatric interview
The assessment was made by a general semistructured interview assessing for Axis I disorders outlined by the DSM-IV-TR. In the clinical sample, such diagnoses were confirmed by clinical DSM-IV-TR diagnoses assigned by a staff psychiatrist.
Participants
A total of 529 subjects participated in the study. All participants were recruited between January 2005 and November 2006. They participated on a voluntary and anonymous basis, received no honorarium for completing the assessment, and provided written informed consent. The study design was approved by the local Institutional Review Board. The analyzed overall sample was divided into clinical and nonclinical subsamples to allow for evaluation of the performance of the items across different samples.
Clinical sample
The clinical sample was composed of 229 (females =147, 64.2%; males =82, 35.8%) psychiatric outpatients. Their average age was 33.95 years (standard deviation [SD] =10.33; range: 18–66 years), and their average education was 12.43 years (SD =3.35; range: 1–24 years). Inclusion criteria for the clinical sample were: 1) a current diagnosis according to the DSM-IV-TR criteria;Citation71 2) possible presence of treatment with antidepressant drugs and/or psychotherapy for not more than 2 months; and 3) age 17 years or older. Exclusion criteria included the presence of any condition affecting the ability to take the assessment, such as: 1) severe medical diagnoses, 2) any major disorder of the central nervous system, 3) current florid psychotic symptoms, and 4) refusal of informed consent.
The patients included in this sample were diagnosed as follows: 46.3% (N=106) had a mood disorder, 32.3% (N=74) had an anxiety disorder, 9.6% (N=22) had an eating disorder, 2.2% (N=5) had an adjustment disorder, and 9.6% (N=22) had another specified diagnosis (eg, sexual, sleep, or dissociative disorders). In this sample, nondepressed patients and depressed patients were included because we aimed to evaluate the performance of the items along the whole depressive spectrum. Of the 229 outpatients, 41.5% (N=95) were free from pharmacological and/or psychotherapeutic treatment, whereas 58.5% (N=134) received pharmacological and/or psychotherapeutic treatment in the initial phase (first 2 months). Patients in treatment for more than 2 months were not considered, in order to avoid the effects of the therapeutic intervention on the pathology and its measurement.Citation76 Patients were recruited through private psychotherapeutic centers (N=105; 45.9%) and public psychiatric departments (N=117; 51.1%). They completed the Teate Depression Item Pool questionnaire and the diagnostic semistructured interview as part of the standard intake assessment. Accredited mental health providers conducted the diagnostic interviews.
Nonclinical sample
The nonclinical sample was composed of 300 participants (females N=207, 69%; males N=93, 31%) without mental illness. Their average age was 27.35 years (SD =10.55; range: 18–63 years), and their average education was 13.54 years (SD =2.18; range: 1–27 years).
The nonclinical sample was recruited through attendants of adult education classes and an advertisement posted for established community groups. The participants were mostly Italian undergraduate students enrolled in a psychology course at the University in Chieti, Italy (N=217, 72.3%). All participants were preliminarily screened for psychiatric illness with a short interview. Only those individuals evidencing no current psychopathology and no history of psychiatric hospitalization were included.
Analysis
In order to select items from the Teate Depression Item Pool with best measurement properties for composing a brief, homogeneous, and unidimensional scale of depression, we used the extended logistic model, an extension of the Rasch one-parameter dichotomous model to the case of polythomous items: ie, with more than two ordered response categories.Citation47,Citation49 As a method of parameter estimation, we applied the joint maximum likelihood estimation procedure, the most popular method in the usual many-category cases.Citation49 The maximum likelihood is obtained using an iterative process, usually, Newton-Raphson’s algorithm.
Rasch analysis was conducted using the Rasch Unidimensional Measurement Model (RUMM2020™) software package (RUMM Laboratory Pty Ltd, Perth, Australia).Citation77
Procedure
Item selection
In order to construct a Rasch-based scale, items from the 51-item pool were assessed by applying the following selection criteria: 1) overall model fit, and 2) individual item fit.Citation45,Citation78 The latter was checked through the χ2 statistics and the standardized residuals.
The RUMM item trait test of fit (using the χ2 statistic) examines the sample agreement for all item values across subjects. In other words, it tests the extent to which the set of items conforms to a single trait in the population of subjects. As an indication of good fit, the χ2 probability value of the overall model should be nonsignificant (using Bonferroni α value adjusted for the number of items). When an item fits the Rasch model, the χ2 probability should be greater than or equal to 0.05, and a fit residual should be within a specified range (usually, ±2.0 or ±2.5).Citation45,Citation78 Given the sensitivity of the χ2 statistics to sample sizes, the residual statistics were used primarily to guide decision making about individual item fit.
Item pool evaluation
Analyses used to assess whether the selected items conformed to Rasch model expectations are briefly explained as follows.
Evaluation of separation and reliability
The Person Separation Index (PSI) is the proportion of observed variance that is considered true, and it is consistent with Cronbach’s α.Citation79 In the present context, it provides an indication of the power of the measure to discriminate among respondents with different degrees of depression. A coefficient of 0.85 was considered good for individual or clinical use.Citation80,Citation81
Appropriateness of the response format
Rasch analysis provides category threshold parameter values. The threshold (τik) refers to the point between adjacent response categories where either response is equally probable, so each item has as many thresholds as response categories minus one. The category threshold parameter values should follow the order of their respective answer categories (eg, τi1 < τi2 < τi3 < τi4). If it happens, then across the whole range of the underlying trait being measured, each response option will show the highest probability of occurrence in each category interval delimited by two adjacent thresholds. If disordered thresholds are detected, then item rescoring is considered. Disordered thresholds may arise because of ambiguity in response wording, or in consequence of difficulty of respondents to discriminate between options.
Test of local independence and unidimensionality assumptions
Assumptions of local independence and unidimensionality were further assessed.Citation45 Local independence means that the response to any item is unrelated to any other response, concerning the same construct. To identify it, the residual correlation matrix was examined, and pairs of items with correlations exceeding 0.3 were taken to indicate dependency.Citation80 Unidimensionality implies that only one construct is measured by a set of items. One of the methods to check for it is to undertake a principal components analysis of the standardized residuals. To detect this, we compared the person estimates (the logit of person severity of depression) derived from two subsets of items that loaded (positively and negatively) on the additional component using a series of t-tests. If more than 5% of the t-tests are significant (or the lower bound of the binomial confidence interval is above 5%), the scale is multidimensional.Citation80,Citation82–Citation84
Item bias (DIF)
DIF is a form of item bias that occurs when groups with different sample characteristics (eg, sex, age, education) respond in a different way to a certain item, despite equal levels of depression. Many studies have shown that prevalence of depression depends on sex.Citation85–Citation87 Thus, DIF due to this variable might be suspected. No differences in item functioning would mean that both set of items can be validly used in both sexes. Two types of DIF may be identified.Citation77 Uniform DIF would occur, for example, when males respond consistently higher than females on an item, given the same level of depression. Nonuniform DIF would occur if females selected a higher response option to an item at lower levels of depression compared to males, but a lower option at higher levels of depression. When an item was found to exhibit uniform DIF, the problem can be remedied by splitting the file by group and separately calibrating the item for each group. In the case of the nonuniform DIF, item deletion was considered, particularly if removal improved overall model fit.Citation45,Citation49
To detect DIF, an analysis of variance (Bonferroni adjusted α level) of the standardized response residuals was conducted for each item, comparing scores across each level of the person factor (sex) and across different levels of depression, referred to as class intervals. The presence of uniform DIF is identified by a significant main effect for the sex factor, whereas the nonuniform DIF is detected by a significant interaction effect (sex X class interval) in analysis of variance of residuals.
Person location distribution
Within the Rasch model framework, person location distribution can be used as a strategy for examining differences across all levels of severity depression within a particular person factor (eg, diagnostic group). The logit distribution of all persons grouped in several class intervals and divided according to the “diagnostic group” (clinical versus nonclinical subjects) factor across all levels of depression was evaluated, and analysis of variance of the person location means associated with this person-related factor was reported. In this case, the probability of a subject endorsing an item (or response category) should differ according to this group membership.
Results
Item selection
The Rasch model was elaborated by a values matrix produced by 529 subjects (either clinical or nonclinical subjects) and 51 items. The 51-item pool showed poor fit to model expectations. As seen in , item–trait interaction χ2 probability value of the overall model with a Bonferroni correction did not exceed 0.05/51. PSI results were high (). Item fit residuals (df =514.65) ranged between +6.61 and −3.99. Eighteen items displayed residuals outside the acceptable range (±2.5). In the 51-item pool, item χ2 probability values (df =8) ranged between 0.000 and 0.936. With a Bonferroni correction to the χ2 item probability, approximately half of the items did not fit the model. In respect of difficulty, item locations were distributed along an interval from −0.91 to +0.81 logits, which allows for discriminating sufficiently individual locations of 43.6% of the respondents.
Table 1 Summary of measures of Rasch model fit for 51-item pool and 21-item pool (N=529)
In order to achieve a best fit for the Rasch model and to compose a short and suitable scale for the clinical routine, items were selected by applying the two aforementioned selection criteria. After removing item by item all misfitting items, best model fit (with Bonferroni adjustment) was achieved by a final 21-item set, named the Teate Depression Inventory (TDI) ().Citation88 The name of the test is derived from the Latin name of the city of the authors’ University.
lists the estimated parameters and fit statistics of the selected 21 items, ordered by item difficulty (level of depression severity).
Table 2 Rasch item analysis, item parameter estimates, and fit statistics of the 21 selected items with correspondent Diagnostic and Statistical Manual of Mental Disorders, Fourth Edition, Text Revision diagnostic criterion (N=529)
Item χ2 probability values (df =8), ranging from 0.13 to 0.99, exceeded the Bonferroni adjusted α value of 0.001, indicating no significant deviation from the model. All items showed fit residuals values (df =498.90) within the acceptable bounds, ranging from −2.20 to +1.92. Thus, all the 21 items showed a satisfactory performance. In the new range of item location (−0.94 to +0.82 logits), no relevant loss of information occurred (about 4% of the subjects resulted not classifiable), versus the appreciable improvement of fit in the 21-item model ().
In regards to item difficulty, appraisals of having suicidal thoughts (item 3) and feelings of self-shame (item 5) resulted in being the hardest items, marking the highest measures of depression, whereas self-ratings of feelings of sadness (items 1 and 15) would be affirmed by persons with a very low level of depression. In the diagnostic criteria to which each item belongs are also reported. All the criteria were represented, with the exception of numbers III (appetite disturbance) and IV (sleep disturbance), both concerning physiological distress. Thirteen somatic-related items showed a low conguence with the Rasch model, probably because of its lack of unidimensionality, and thus they were removed from the 51-item pool.
With regard to the scale direction, ten out of 21 items were positively worded, so that the measure would better meet the standards of optimal test construction and minimize response bias (acquiescence).Citation75,Citation89,Citation90
Item pool evaluation
Evaluation of separation and reliability
PSI (equal to 0.96) showed that the TDI could discriminate between patients with distinct levels of depression severity ().Citation91 Cronbach’s alpha was 0.95.
Appropriateness of the response format
The adequacy of the TDI response format (five response categories; category 0 labeled as “never” and category 4 labeled as “always”) was assessed by inspecting the parameter values of the four category thresholds for each item (τi1, τi2, τi3, τi4) (). As seen, the stipulated order of the thresholds along their respective response categories was empirically confirmed. Each response category (0, 1, 2, 3, 4) systematically had a point along the depression continuum where it was the most likely response. This indicated that the response format of the TDI worked out well and that all respondents were using the response categories in a manner that was consistent with the level of the trait of depression. This was probably due to our initial item selection, which warranted the elimination of any ambiguity in response category.
Table 3 Estimates of category thresholds of 21 Teate Depression Inventory items (N=529)
Item bias (DIF)
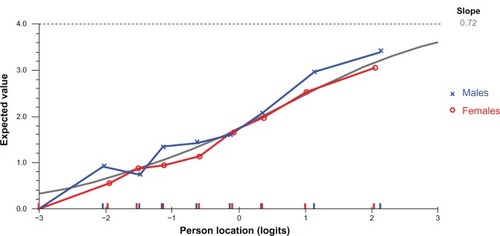
Testing sex for DIF with a Bonferroni-adjusted P-value of 0.002 (0.05/21), we found that no items showed probability values exceeding the adjusted α value, except for item 10, which exhibited some degree of uniform DIF ().
Table 4 Uniform and nonuniform differential item functioning (DIF) statistics for all Teate Depression Inventory items (N=529)
Inspection of the graph in suggests that at equal levels of the overall trait of depression, females are slightly less likely than males to endorse this item tapping loss of enjoyment. This difference is noted only for the five categories, with no sex differences noted to this item in respondents in the categories around the zero level (representing average levels of depression). If the difference had been more pronounced (and statistically significant), this item would have been calibrated separately for males and females, treating it as two separate scale items for the purposes of providing an unbiased linear estimate of a person’s level of depression.
Figure 1 Differential item functioning graph of males and females for Teate Depression Inventory item 10.
Test of local independence and unidimensionality assumptions
The residual correlation matrix holds no additional substantial dimensions because intercorrelations of items ranged from 0.002 to 0.280 and no pairs of items showed correlations exceeding 0.3. Thus, no local dependency was detected.
Analysis of the pattern of residuals showed that the residuals loaded in opposite directions on the original scale. These two subsets of items (defined by positive and negative loadings on the first residual component) were then separately fitted to the Rasch model and the person estimates obtained. A series of independent t-tests performed on the person estimates from two subsets of items, identified from principal components analysis of the residuals, revealed that only 2.46% of cases had statistically significant t-values. There was no evidence of multidimensionality.
Person location distribution
Significant differences of the mean person location were found between the nonclinical (M=−1.44, DS =1.22) and clinical sample (M=0.49, DS =1.24) (F[1, 528]=320.13, P<0.0001).
displays the distribution of the group diagnostic (healthy subjects versus psychiatric patients) person factor across all levels of depression severity continuum (in logits).
Figure 2 The distribution of the group diagnostic person factor across all levels of depression severity.
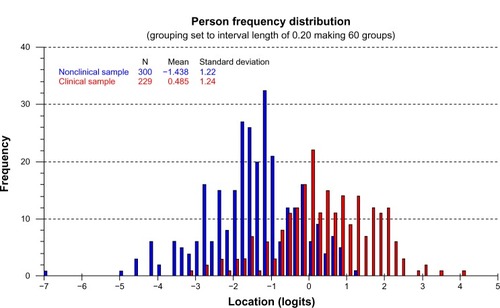
As expected, “less severe” (or easier to endorse) items (ie, with negative values of logit, at the left of the scale metric) had a higher probability of endorsement by subjects whether slightly or mildly depressed (nonclinical sample), whereas “more severe” (or hardest to endorse) items (ie, with positive values of logit, located further on the right) on the spectrum had a high probability of endorsement only by severely depressed patients (clinical sample). Thus, as the item severity increased (ie, it moved to the right along the scale), only more severely depressed patients endorsed the harder items. Rasch respondent depression estimates for those who endorsed a given response category were examined to assess the degree to which higher category utilization was associated with increasing respondent depression.
The average mean person location value of 0.49 in the clinical sample suggests that on the whole the scale was reasonably well targeted for use with this group, with patients, on average, at a slightly higher level of depression than the average of the scale items (which would be zero logits).
Discussion
The aim of the present study was to present an extension of the Rasch model to the case of more than two ordered categories (the extended logistic model), in order to select depression mood items and to apply it for developing a new self-report measure of depression.
Initially, a larger pool of 152 items elicited by clinical experts underwent several steps of a qualitative item selection procedure, and resulted in the retention of 51 items. Another analysis was carried out to guarantee content validity, an important and often lacking feature in self-report depression instruments.Citation15 In order to put together a pool of items measuring the target construct of depression, a set of psychometric requirements associated with the Rasch model must be satisfied. Thus, the 51-item pool underwent further steps, by using the Rasch analysis criteria. A resulting 21-item scale, named TDI, fitted the Rasch model, therefore it represents an “objective” measure of depression. When there is congruency (fit) between data and model, the item parameter estimates should be independent of the subject sample (“sample free”) and the subject parameter estimates (levels of subject depression) should be independent of the item pool (“test free”). In this case, the parameter estimates are said “invariant”, because they are insensitive measures to variations of both the elements, ie subjects and items, respectively. Regarding the DIF, all items showed no differences due to sex, except for item 10. The sex DIF exhibited by this item represents a not serious constraint since it could be solved by sex-dependent TDI norms, so this item was still retained in the final scale. Overall, the performance of the TDI was sufficiently insensitive for sex biases. It represents an advantage over the extant depression questionnaires such as the BDI-II that included several items showing DIF dependent of the respondent’s sex. These items might substantially interfere with the valid interpretation of instrument’s sum score.Citation43,Citation61,Citation64
In the context of assessment of depression, some methodological advances we have been advocating in this article could be gained by applying the Rasch model to the development of a new depression instrument.
Using the Rasch-based measure, it is possible to generate a total summed score, expressed in logit units, as an actual index of a person’s severity of depression, whose meaning is clearer, and easily interpretable by experts and lay judges.Citation42,Citation92 Another advantage is the capability of the Rasch model to evaluate the response format of any item. Rating scales are intended to function such that each point on the continuum is meaningful and distinct from the other options. Although test developers endeavor to achieve this aim, the resulting scales often do not function as intended.Citation32 In fact, it happens that respondents have the same location on the continuum, but express this location in a different way because of their different verbal habits. In other words, a subject may respond in a given category (eg, often), while another subject having different verbal habits may respond in the higher category (eg, always) to the same item. Such discrepancies can be identified and accurately adjusted with the Rasch model, so that to produce true interval scale data. This feature is particularly important when the clinical scale is used for monitoring clinical change as well as in attempting to detect and quantify the impact of therapeutic interventions. Interval scales, being linear and quantitative, allow all elementary mathematical operations and consequently the calculation of statistical indicators, which leads to significant quantitative comparisons within and between subjects. A Rasch-based instrument allows comparing quantitatively either two subjects (or two groups of subjects) or the same subjects at two different points in time. A difference in logit units between two subjects indicates that one subject with a higher score has a greater probability to show a higher level of depression compared with a subject with a lower score. For instance, if we had to test an antidepressant drug, this method could reveal the presence or absence of a treatment effect and, most importantly, quantify it on a linear scale. On the contrary, quantitative comparisons using an ordinal scale in repeated assessments could lead to erroneous conclusions.
There are also theoretical advantages when applying the Rasch model to the construction of a new depression measure. Indeed, insights from Rasch analysis could add some diagnostic information that might have clinical relevance. An analysis of the content of the TDI items selected by using the Rasch model could allow for adding knowledge to the true variability of depression, as opposed to the potentially spurious variability derived from different scale ascertainment. For example, the TDI item assessing suicidal ideation was given the highest weight (raw score) as those that tap sadness. In accordance with clinical research, a depressive syndrome with suicidal ideation is more serious, and this item alone indicates higher intensity of depression.Citation21,Citation22,Citation24,Citation25 Also, items tapping self-shame had higher weight, in accordance with the growing body of literature that has attached great importance to the emotion of self-shame in generating depressive symptoms.Citation93–Citation102 It is expected that a more depressed subject will endorse an item regarding self-shame more frequently than a less depressed subject. Although this particular item does not directly measure depression, it helps in the construction of the depression score, together with other related items that are designed to measure the same latent variable. Items referring to somatic symptoms (sleep and appetite disturbances) did not fit the Rasch model, as they probably provided no additional information to estimate the person’s level of depression. The debate about the relevance of these items for depression is ongoing.Citation103,Citation104 Our results are in accordance with previous studies that cast doubts on somatic items, by using a different approach, such as factor analysis.Citation12 The removal of these items is consistent with the confounding of comorbidity that may be expected when applied to other diagnostic groups and can result in false positives.Citation43,Citation105,Citation106 Depression is an important predictor for morbidity and mortality in many somatic ailments, such as cardiologic diseases.Citation107–Citation109 Sum scores of existing depression scales containing somatic items could be biased if those were completed by persons suffering from a somatic illness. The TDI as a unidimensional screening tool for depression, without items concerning somatic complaints, could be more useful for assessing depression in somatically ill patients. It would be beneficial in settings in which time to focus on mental health diagnostics is strongly limited but prevalence of depression is presumably high (eg, cardiology).Citation109
Accordingly, additional studies are needed to examine how TDI items perform in different patient populations (eg, neurologic, cardiac, cancer). However, it could be argued that by deleting somatic items from the final item pool, the assessment of depressive severity provided by the questionnaire is no longer concurrent with the DSM-IV-TR and DSM-V criteria for MDE. It should be noted that the TDI was developed as an indicator of the presence and the severity of depression mood, not as an instrument for specifying a clinical diagnosis. Furthermore, deleting these items can enhance the unidimensionality of the core symptoms in a manner that allows a uniform assessment of clinical change. Although the identification of a core set of symptoms with proven psychometric properties is limited, in the sense that it does not permit capture of the full depressive syndrome, the objective comparisons among subjects (and within subjects in repeated sessions) could be allowed.Citation13,Citation43–Citation47 Thus, the effects of a therapeutic intervention would be easily detected.
Recently, in two studies the TDI was administered to large clinical and nonclinical samples.Citation31,Citation110 In the first study, internal consistency was found to be high (Cronbach’s α=0.92) in a sample of 857 young adults. In addition, significant correlations with the subfactor of high standards/self-criticism (r=0.26, P<0.01) of the Attitudes Toward Self Revised Scale,Citation111 and with the BDI-II (r=0.65, P<0.01) were found. Moderate association between TDI and BDI-II may be due to the lack of unidimensionality for the BDI-II.Citation23,Citation28,Citation29,Citation43,Citation112,Citation113 In the second study, Cronbach’s α was 0.94 and 0.92 (P<0.01), respectively, for the clinical (1,124 psychiatric outpatients) and nonclinical samples (877 healthy subjects).Citation110 Correlation with the BDI-II was 0.73 (P<0.01) in both the clinical and nonclinical samples. Correlation with the Beck Anxiety InventoryCitation114 was 0.46 (P<0.01) in a clinical subsample of 102 outpatients and 0.54 (P<0.01) in a nonclinical subsample composed of 151 subjects.
Summing up, the TDI could be considered a considerable promise as unidimensional depression mood scale.
Other potential advantages could be gained. The Rasch approach could: 1) help adjust for cross-cultural differences when data are pooled, eg, in international clinical trials;Citation115,Citation116 2) be used to investigate whether the response format is appropriate for certain cultural contexts.Citation43,Citation115–Citation117
Future research could investigate if the TDI can also be clinician rated, and, if so, what the correlation is between self-rated TDI and clinician-rated TD: ie, whether administration via both approaches would be complementary or redundant.
Limitations
This study has several limitations on both the developed instrument and the used method. With regard to TDI, its development is still incomplete. For clinical applications, cut scores should be given so that the providers can quickly identify patients with a high likelihood of a DSM condition depression. Although these scores were derived using traditional scoring methods and appeared to be not always optimal, it would be difficult to convince end users to switch to an instrument that does not appear to be as clinically informative, as the BDI-II. Additionally, it would be useful to identify cutoff scores for different levels of depression severity. Again, invariance of the measurement instrument should also be verified in relation to other variables, such as age, education, race, and comorbid psychiatric illness. It would be important to determine whether the TDI is appropriate for use in pediatric/adolescent subjects, as well as the elderly, and whether comorbid psychiatric illness (eg, severe anxiety) influences the scoring (ie, discriminant validity). Finally, some evidence of incremental validity in the crowded market of depression measures should be provided in order to convince end users to use a new instrument.
Limitations of the Rasch analysis must also be taken into account. The major drawback concerns the intellectual investment in order to fully understand the model as well as to handle the analysis software. Indeed, the Rasch analysis of ratings should be encouraged even though requires more effort than the traditional handling of ordinal scores.
Disclosure
The authors report no conflicts of interest in this work.
References
- GaynesBNBurnsBJTweedDLEricksonPDepression and health-related quality of lifeJ Nerv Ment Dis20021901279980612486367
- LettHSBlumenthalJABabyakMADimensions of social support and depression in patients at increased psychosocial risk recovering from myocardial infarctionInt J Behav Med200916324825819288205
- NicholsGMolerECardiovascular disease, heart failure, chronic kidney disease and depression independently increase the risk of incident diabetesDiabetologia201154352352621107522
- PattenSBWilliamsJVLavoratoDHCampbellNREliasziwMCampbellTSMajor depression as a risk factor for high blood pressure: epidemiologic evidence from a national longitudinal studyPsychosom Med200971327327919196807
- SobockiPJönssonBAngstJRehnbergCCost of depression in EuropeJ Ment Health Policy Econ200692879817007486
- World Health OrganizationThe World Health Report 2001 – Mental Health: New Understanding, New HopeGeneva, SwitzerlandWorld Health Organization2001
- van MarwijkHGercamaAAdèrHde HaanMMean clinical challenge rate and level of recognition of depression remain unchanged after two years of vocational trainingFam Pract200118659059111739342
- Joiner JrTEWalkerRLPettitJWPerezMCukrowiczKCEvidence-based assessment of depression in adultsPsychol Assess200517326716262453
- NezuAMPractitioner’s Guide to Empirically Based Measures of DepressionNew YorkSpringer2000
- ZungKSelf rating anxiety and depression scaleArch Gen Psychiatry196512637014221692
- RadloffLSThe CES-D scale a self-report depression scale for research in the general populationAppl Psychol Meas197713385401
- DozoisDDobsonKDepressionAntonyMBarlowDHandbook of Assessment and Treatment Planning for Psychological DisordersNew YorkGuilford Press2002259299
- BeckASteerRBrownGBeck Depression Inventory – II, ManualSan Antonio, TXThe Psychological Corporation1996
- NunnallyJCBernsteinIHPsychometric TheoryNew YorkMcGraw-Hill1994
- BalsamoMSagginoATest per l’assessment della depressione nel contesto italiano: un’analisi critica [Tests for depression assessment in Italian context: a critical review]Psicoterapia Cognitiva e Comportamentale2007132167199 Italian
- AlexopoulosGSBorsonSCuthbertBNAssessment of late life depressionBiol Psychiatry200252316417412182923
- BoumanTKKokAHomogeneity of Beck’s Depression Inventory (BDI): applying Rasch analysis in conceptual explorationActa Psychiatr Scand19877655685733434329
- De BonisMLebeauxMDe BoeckPSimonMPichotPMeasuring the severity of depression through a self-report inventory: a comparison of logistic, factorial and implicit modelsJ Affect Disord199122155641880309
- LichtRWQvitzauSAllerupPBechPValidation of the Bech– Rafaelsen Melancholia Scale and the Hamilton Depression Scale in patients with major depression; is the total score a valid measure of illness severity?Acta Psychiatr Scand2005111214414915667434
- RosenbergROutcome measures of antidepressive therapyActa Psychiatr Scand2000101s4024144
- Alexandrino-SilvaCPereiraMLGBustamanteCSuicidal ideation among students enrolled in healthcare training programs: a cross-sectional studyRev Bras Psiquiatr200931433834419838592
- ClarkDvonAmmon CavanaughSGibbonsRThe core symptoms of depression in medical and psychiatric patientsJ Nerv Ment Dis1983171127057136644280
- GibbonsRDClarkDCVonAmmon CavanaughSDavisJMApplication of modern psychometric theory in psychiatric researchJ Psychiatr Res198519143553989737
- SelviYAydinABoysanMAtliAAgargunMYBesirogluLAssociations between chronotype, sleep quality, suicidality, and depressive symptoms in patients with major depression and healthy controlsChronobiol Int2010279–101813182820969525
- GastelAVSchotteCMaesMThe prediction of suicidal intent in depressed patientsActa Psychiatr Scand19979642542599350953
- TanakaJSHubaGJConfirmatory hierarchical factor analyses of psychological distress measuresJ Pers Soc Psychol1984463621
- SvenssonEGuidelines to statistical evaluation of data from rating scales and questionnairesJ Rehabil Med2001331474811480471
- StorchEARobertiJWRothDAFactor structure, concurrent validity, and internal consistency of the Beck Depression Inventory – second edition in a sample of college studentsDepress Anxiety200419318718915129421
- OsmanAKopperBABarriosFGutierrezPMBaggeCLReliability and validity of the Beck depression inventory–II with adolescent psychiatric inpatientsPsychol Assess200416212015222808
- CrockettLJRandallBAShenY-LRussellSTDriscollAKMeasurement equivalence of the Center for Epidemiological Studies Depression Scale for Latino and Anglo adolescents: a national studyJ Consult Clin Psychol2005731475815709831
- BalsamoMImperatoriCSergiMRCognitive vulnerabilities and depression in young adults: an ROC curves analysisDepress Res Treat201320138
- LopezWCommunication validity and rating scalesRasch Measurement Transactions1996101482483
- MerbitzCMorrisJGripJOrdinal scales and foundations of misinferenceArch Phys Med Rehabil19897043082535599
- SmithEJrEvidence for the reliability of measures and validity of measure interpretation: a Rasch measurement perspectiveJ Appl Meas20012328131112011511
- WrightBDLinacreJObservations are always ordinal; measurements, however, must be intervalArch Phys Med Rehabil198970128572818162
- SchmittMMaesJSimplification of the Beck-Depression-Inventory (BDI)Diagnostica20004613846
- ValensteinMVijanSZeberJEBoehmKButtarAThe cost– utility of screening for depression in primary careAnn Intern Med2001134534536011242495
- ZimmermanMChelminskiIMcGlincheyJBPosternakMAA clinically useful depression outcome scaleCompr Psychiatry200849213114018243884
- SauerSZieglerMSchmittMRasch analysis of a simplified Beck Depression InventoryPers Individ Dif2013544530535
- ZimmermanMCoryellWThe Inventory to Diagnose Depression (IDD): a self-report scale to diagnose major depressive disorderJ Consult Clin Psychol198755155593571659
- RaschGProbabilistic Models for Some Intelligence and Attainment TestsCopenhagen, DenmarkDanish Institute for Educational Research1960
- BondTGFoxCMApplying the Rasch Model: Fundamental Measurement in the Human SciencesMahwah, NJLawrence Erlbaum2007
- da RochaNSChachamovichEde Almeida FleckMPTennantAAn introduction to Rasch analysis for psychiatric practice and researchJ Psychiatr Res201247214114823069651
- EdelenMOReeveBBApplying item response theory (IRT) modeling to questionnaire development, evaluation, and refinementQual Life Res200716151817375372
- PallantJFTennantAAn introduction to the Rasch measurement model: an example using the Hospital Anxiety and Depression Scale (HADS)Br J Clin Psychol200746111817472198
- ThomasMLThe value of item response theory in clinical assessment: a reviewAssessment201118329130720644081
- AndrichDA general form of Rasch’s extended logistic model for partial credit scoringApplied Measurement in Education198814363378
- WrightBDMastersGNRating Scale AnalysisChicago, ILMesa Press1982
- AndrichDRasch Models for MeasurementThousands Oaks, CASage Publications1988
- AndrichDA rating formulation for ordered response categoriesPsychometrika1978434561573
- HagquistCAndrichDIs the sense of coherence-instrument applicable on adolescents? A latent trait analysis using Rasch-modellingPers Individ Dif2004364955968
- KarabatsosGThe Rasch model, additive conjoint measurement, and new models of probabilistic measurement theoryJ Appl Meas20012438942312011506
- LinacreJOptimizing rating scale category effectivenessJ Appl Meas2002318511997586
- MichellJMeasurement: a beginner’s guideJ Appl Meas20034429814523251
- O’ConnorRJTennantAMeasuring pain: issues of interpretationLancet20083711519152518456101
- WaughRFCreating a scale to measure motivation to achieve academically: linking attitudes and behaviours using Rasch measurementBr J Educ Psychol2002721658611916465
- WrightBDLogits?Rasch Measurement Transactions199372288
- WrightBDStoneMBest Test DesignChicago, ILMesa Press1979
- BagbyRMRyderAGSchullerDRMarshallMBThe Hamilton Depression Rating Scale: has the gold standard become a lead weight?Am J Psychiatry2004161122163217715569884
- BechPAllerupPGramLThe Hamilton Depression ScaleActa Psychiatr Scand19816332902997015793
- SantorDARamsayJZuroffDCNonparametric item analyses of the Beck Depression Inventory: evaluating gender item bias and response option weightsPsychol Assess199463255270
- SantorDACoyneJCExamining symptom expression as a function of symptom severity: item performance on the Hamilton Rating Scale for DepressionPsychol Assess200113112711281034
- HollandPWWainerHDifferential Item FunctioningHilldale, NJLawrence Erlbaum Associates1993
- ForkmannTBoeckerMWirtzMDevelopment and validation of the Rasch-based depression screening (DESC) using Rasch analysis and structural equation modellingJ Behav Ther Exp Psychiatry200940346847819589499
- ForkmannTBoeckerMWirtzMValidation of the Rasch-based depression screening in a large scale German general population sampleHealth Qual Life Outcomes20108110520858272
- ParkitnyLMcAuleyJHWaltonDRasch analysis supports the use of the depression, anxiety, and stress scales to measure mood in groups but not in individuals with chronic low back painJ Clin Epidemiol201265218919821889306
- FliegeHBeckerJWalterOBBjornerJBKlappBFRoseMDevelopment of a computer-adaptive test for depression (D-CAT)Qual Life Res200514102277229116328907
- IrwinDEStuckyBLangerMMAn item response analysis of the pediatric PROMIS anxiety and depressive symptoms scalesQual Life Res201019459560720213516
- LaiJ-sCellaDChangC-HBodeRKHeinemannAWItem banking to improve, shorten and computerize self-reported fatigue: an illustration of steps to create a core item bank from the FACIT-Fatigue ScaleQual Life Res200312548550113677494
- PilkonisPAChoiSWReiseSPStoverAMRileyWTCellaDItem banks for measuring emotional distress from the Patient-Reported Outcomes Measurement Information System (PROMIS®): depression, anxiety, and angerAssessment201118326328321697139
- American Psychiatric AssociationDiagnostic and Statistical Manual of Mental Disorders: DSM-IV-TR®Arlington, VAAmerican Psychiatric Publishing2000
- AngleitnerAJohnOLöhrFIt’s what you ask and how you ask it: an itemetric analysis of personality questionnairesAngleitnerAWigginsJPersonality Assessment via QuestionnairesBerlin, GermanySpringer1986
- ClakDABeckATAlfordBAScientific Foundations of Cognitive Theory and Therapy of DepressionNew YorkWiley1999
- American Psychiatric AssociationDSM-V. APATFo. Diagnostic and Statistical Manual of Mental Disorders: DSM-VArlington, VAAmerican Psychiatric Publishing2013
- KlinePA Handbook of Test Construction: Introduction to Psychometric DesignLondon, UKMethuen1986
- MaybergHSBrannanSKTekellJLRegional metabolic effects of fluoxetine in major depression: serial changes and relationship to clinical responseBiol Psychiatry200048883084311063978
- AndrichDLyneASheridanBLuoGRUMM 2020Perth, AustraliaRUMM Laboratory2003
- GiampagliaGIl Modello di Rasch nella Ricerca Sociale [Rasch Model in Social Research]Naples, ItalyLiguori Editore2008
- AndrichDAn extension of the Rasch model for ratings providing both location and dispersion parametersPsychometrika1982471105113
- TennantAConaghanPGThe Rasch measurement model in rheumatology: what is it and why use it? When should it be applied, and what should one look for in a Rasch paper?Arthritis Care Res200757813581362
- BriggsSRCheekJMThe role of factor analysis in the development and evaluation of personality scalesJ Pers1986541106148
- SmithEJrDetecting and evaluating the impact of multidimensionality using item fit statistics and principal component analysis of residualsJ Appl Meas20023220523112011501
- LinacreJMDetecting multidimensionality: which residual data-type works best?J Outcome Meas199822662839711024
- TennantAPallantJUnidimensionality mattersRasch Measurement Transactions200620110481051
- BroekmanBNyuntSNitiMDifferential item functioning of the Geriatric Depression Scale in an Asian populationJ Affect Disord2008108328529017997490
- GottliebSSKhattaMFriedmannEThe influence of age, gender, and race on the prevalence of depression in heart failure patientsJ Am Coll Cardiol20044391542154915120809
- WittchenH-UJacobiFSize and burden of mental disorders in Europe – a critical review and appraisal of 27 studiesEur Neuropsychopharmacol200515435737615961293
- BalsamoMSagginoATDI - Teate Depression InventoryFirenze, ItalyHogrefe Editore Srl2013 Italian
- CronbachLJResponse sets and test validityEduc Psychol Meas194664475494
- MillhamJKelloggRWNeed for social approval: Impression management or self-deception?J Res Pers1980144445457
- AndrichDLyneASheridanBLuoHRUMM2010: a Windows program for analyzing item response data according to Rasch Unidimensional Measurement Models (Version 33) [Computer program]Perth, AustraliaRUMM Laboratory2001
- EmbretsonSReiseSReiseSItem Response Theory for PsychologistsHillsdale, NJLawrence Earlbaum Associates2000
- AllanSGilbertPGossKAn exploration of shame measures–II: psychopathologyPers Individ Dif1994175719722
- AndrewsBQianMValentineJDPredicting depressive symptoms with a new measure of shame: the experience of shame scaleBr J Clin Psychol2002411294211931676
- CheungM-PGilbertPIronsCAn exploration of shame, social rank and rumination in relation to depressionPers Individ Dif200436511431153
- CookDEmpirical studies of shame and guilt: the internalised shame scaleNathansonDKnowing Feeling: Affect, Script and PsychotherapyNew YorkNorton1996132165
- KimSThibodeauRJorgensenRSShame, guilt, and depressive symptoms: a meta-analytic reviewPsychol Bull20111371689621219057
- FontaineJRLuytenPDe BoeckPCorveleynJThe test of self‐ conscious affect: internal structure, differential scales and relationships with long-term affectsEur J Pers2001156449463
- GeeATroopNShame, depressive symptoms and eating, weight and shape concerns in a non-clinical sampleEat Weight Disord2003817212762628
- GilbertPCheungMIronsCMcEwanKAn exploration into depression-focused and anger-focused rumination in relation to depression in a student populationBehav Cogn Psychother2005333273
- TangneyJPRecent advances in the empirical study of shame and guiltAm Behav Sci199538811321145
- ThompsonRJBerenbaumHShame reactions to everyday dilemmas are associated with depressive disorderCognit Ther Res2006304415425
- Abdel-KhalekAMCan somatic symptoms predict depressionSoc Behav Pers2004327657666
- SimonGEVonKorffMPiccinelliMFullertonCOrmelJAn international study of the relation between somatic symptoms and depressionN Engl J Med1999341181329133510536124
- GibbonsCJMillsRJThorntonEWRasch analysis of the Hospital Anxiety and Depression Scale (HADS) for use in motor neurone diseaseHealth Qual Life Outcomes201198221955749
- ThombsBDMagyar-RussellGBassEBPerformance characteristics of depression screening instruments in survivors of acute myocardial infarction: review of the evidencePsychosomatics200748318519417478586
- BushDEZiegelsteinRCTaybackMEven minimal symptoms of depression increase mortality risk after acute myocardial infarctionAm J Cardiol200188433734111545750
- Di BenedettoMLindnerHHareDLKentSDepression following acute coronary syndromes: a comparison between the Cardiac Depression Scale and the Beck Depression Inventory IIJ Psychosom Res2006601132016380305
- MacMahonKMLipGYPsychological factors in heart failure: a review of the literatureArch Intern Med2002162550951611871918
- BalsamoMRomanelliRInnamoratiMCiccareseGCarlucciLSagginoAThe State-Trait Anxiety Inventory: shadows and lights on its construct validityJ Psychopathol Behav Assess2013112
- CarverCSVoieLLKuhlJGanellenRJCognitive concomitants of depression: a further examination of the roles of generalization, high standards, and self-criticismJ Soc Clin Psychol198874350365
- WuP-CChangLPsychometric properties of the Chinese version of the Beck Depression Inventory-II using the Rasch modelMeas Eval Couns Dev200841113
- WhismanMAPerezJERamelWFactor structure of the Beck Depression Inventory – second edition (BDI-ii) in a student sampleJ Clin Psychol200056454555110775046
- BeckASteerRBeck Anxiety Inventory ManualSan Antonio, TXThe Psychological Corporation1993
- TennantAMcKennaSPHagellPApplication of Rasch analysis in the development and application of quality of life instrumentsValue Health200471222614720128
- TennantAPentaMTesioLAssessing and adjusting for cross-cultural validity of impairment and activity limitation scales through differential item functioning within the framework of the Rasch model: the PRO-ESOR projectMed Care200442Suppl 13748
- Ravens-SiebererUAuquierPErhartMThe KIDSCREEN-27 quality of life measure for children and adolescents: psychometric results from a cross-cultural survey in 13 European countriesQual Life Res20071681347135617668292