
Abstract
Background
The role of brain metabolites as biological correlates of the intensity, symptoms, and course of major depression has not been determined. It has also been inconclusive whether the change in brain metabolites, measured with proton magnetic spectroscopy, could be correlated with the treatment outcome.
Methods
Proton magnetic spectroscopy was performed in 29 participants with a first episode of moderate depression occurring in the left dorsolateral prefrontal cortex and left amygdala at baseline and after 8 weeks of antidepressant treatment with escitalopram. The Montgomery-Asberg Depression Rating Scale, the Hamilton Rating Scale for Depression, and the Beck Depression Inventory were used to assess the intensity of depression at baseline and at the endpoint of the study. At endpoint, the participants were identified as responders (n=17) or nonresponders (n=12) to the antidepressant therapy.
Results
There was no significant change in the N-acetyl aspartate/creatine ratio (NAA/Cr) after treatment with antidepressant medication. The baseline and endpoint NAA/Cr ratios were not significantly different between the responder and nonresponder groups. The correlation between NAA/Cr and changes in the scores of clinical scales were not significant in either group.
Conclusion
This study could not confirm any significant changes in NAA after antidepressant treatment in the first episode of moderate depression, or in regard to therapy response in the left dorsolateral prefrontal cortex or left amygdala. Further research is necessary to conclude whether NAA alterations in the first episode of depression could possibly be different from chronic or late-onset depression, and whether NAA alterations in stress-induced (reactive) depression are different from endogenous depression. The potential role of NAA as a biomarker of a treatment effect has yet to be established.
Introduction
The neurobiological findings regarding major depressive disorder (MDD) indicate structural, functional, and neurochemical changes in the brain. The most prominent results of MDD, in comparison with healthy persons, are changes in brain volume in the prefrontal and limbic structures, damage to neurons and glia, and alterations in brain metabolism.Citation1 Depression could take various courses, graduating from single to numerous episodes, and the symptoms could vary from mild to very severe, with different responses to therapy and recovery. Therefore, the significance of determining the correlation of neurobiological findings in MDD with the clinical symptoms, intensity, treatment response, and course of illness is increasing in many contemporary studies of MDD.
The prefrontal cortex and limbic structures have been suggested to play a key role in the emotional and cognitive processing of patients with MDD.Citation2,Citation3 The amygdala is implicated in regulation of emotion, and is strongly connected with the prefrontal cortex.Citation4 Studies have found alterations in the structure and function of the amygdala in patients with MDD, including changes in its volume and an increase in cerebral blood flow and glucose metabolism.Citation5,Citation6 The left amygdala is considered to be more responsive to emotional stimuli, particularly negative stimuli.Citation7 Differences related to depression have been reported in the left hemispheric white matter connections between the frontal and limbic regions.Citation8,Citation9
The dorsolateral prefrontal cortex (DLPFC) is involved with integrating sensory and mnemonic information, and regulating intellectual function and action.Citation10 Compared with healthy persons, there have been alterations in the volume and metabolic activity of the DLPFC in patients with MDD.Citation11,Citation12
Of particular interest in the frontal cortex and amygdala are their interconnections and involvement in mood regulation, supporting the theory of frontolimbic dysregulation in depression.Citation13 In post mortem studies, depressive patients showed neuronal and glial alterations in these regions, which underlie brain metabolite chemistry.Citation14 Neuronal and glial alterations are considered to be related to brain metabolite changes, such as in N-acetyl aspartate (NAA), choline, myo-inositol, and creatine (Cr), and may affect glutamate regulation.Citation15 Neurobiological alterations, particularly on the left side of the amygdala and DLPFC, are considered to be related to the pathophysiology of depression.Citation16
The development of magnetic resonance spectroscopy (MRS) has allowed the quantification of brain metabolites in real time, as well as follow-up of the changes in brain metabolites in different disorders and clinical states. It is expected that MRS would provide valid biological markers of brain disorders, including mental disorders and biological correlates of symptoms and treatment response. Proton magnetic resonance spectroscopy (1H-MRS) studies regarding MDD have reported different alterations in brain metabolites, such as in NAA, glutamate, gamma-aminobutyric acid, choline, and myo-inositol, in different brain regions.Citation17 Studies using MRS have shown abnormalities in brain metabolism in the prefrontal cortex and limbic structures in patients with depression.Citation18 So far, MRS studies of the amygdala have shown alterations in choline, myo-inositol, and glutamate in patients with MDD.Citation19 MRS studies of the prefrontal cortex have shown glutamate changes in patients with depression.Citation19
NAA is the second most abundant amino acid in the human brain. It is localized mostly in neurons, oligodendrocyte precursors, and mature oligodendrocytes. NAA is considered a neuron-specific metabolite and a marker of neuronal viability. Its biological function is not fully understood, but it is considered a marker of neuronal loss.Citation20 Previous MRS studies have found no differences in NAA in depressive patients and healthy subjects in the basal ganglia and frontal lobes.Citation19,Citation21,Citation22 In contrast, some studies have reported a reduction of NAA in different brain regions during late-onset depression.Citation23–Citation26
Cr is distributed in gray and white matter, and serves as a measure of the amount of brain tissue contained within an analyzed voxel.Citation27 In the absence of major brain pathology, Cr levels are stable over time.Citation16 Many studies have confirmed unaltered Cr levels in patients with MDD, and Cr levels have been widely used as an internal standard for comparison.Citation3,Citation19,Citation28
Antidepressant medication is widely used for the treatment of MDD, as its efficacy has been linked to clinical improvement. Still, fewer than 50% of patients with MDD show full treatment responses.Citation29 Finding biological markers that would predict the response to therapy and outcome of treatment would be valuable in clinical practice; much effort has been put into achieving this goal.
Many studies report that antidepressants have specific effects on brain regions.Citation29 Selective serotonin reuptake inhibitors have been found to affect the volumes, activation, and biochemistry of brain regions, including the prefrontal cortex and amygdala.Citation30–Citation34 It is thought that treatment with antidepressant medication could normalize abnormalities in corticolimbic function.Citation35,Citation36
Potentially, the findings of neuroimaging may be used for monitoring the response to treatment and predicting the clinical outcome for MDD patients after treatment.Citation29 Recent MRS studies have evaluated the effects of antidepressants on brain metabolites in healthy individuals and MDD patients. Some studies have reported a significant increase in NAA after antidepressant medication or electroconvulsive therapy in depressive patients.Citation37–Citation41 However, other studies have found no significant changes in brain metabolites after antidepressant treatment in different groups of depressive patients.Citation42–Citation44 Increases in NAA after antidepressant treatment would mean that the treatment had a neurotropic effect, which could account for the rise in neuroprotection and in the viability of neurons. Based on current knowledge, the correlation between brain metabolite changes and changes in clinical symptoms and intensity of MDD during treatment is still not clear.
The aim of this study was to investigate whether there would be any changes in NAA/Cr, measured with 1H-MRS in two brain regions, ie, the left DLPFC and left amygdala, corresponding to clinical changes in the intensity of MDD in depressive patients with regard to therapy response.
Materials and methods
Participants
Twenty-nine patients who had never been treated for mental illness were recruited from an outpatient polyclinic. A diagnosis of MDD was made according to the diagnostic criteria in the Diagnostic and Statistical Manual of Mental Disorders, Fourth Edition (DSM-IV).Citation45 A comorbid diagnosis, mental or somatic, was the exclusion criterion. Participants were assigned to take 10 mg/day of escitalopram, an antidepressant medication. 1H-MRS was performed before starting medication (baseline) and after 8 weeks of therapy (endpoint). The Montgomery-Asberg Depression Rating Scale (MADRS),Citation46 the Hamilton Rating Scale for Depression (HAMD, 21-item),Citation47 and the Beck Depression Inventory (BDI)Citation48 were used to assess patients at baseline and at week 8 of antidepressant therapy. At endpoint, participants were identified as responders (n=17) or nonresponders (n=12) to the antidepressant treatment, based on the change in total results according to the scales. Treatment response was defined as having a minimum of 50% improvement in the total score on the HAMD, MADRS, and BDI from baseline to endpoint.Citation49 For the purpose of this study, only patients who fulfilled this criterion in all three instruments were defined as treatment “responders”. All participants signed informed consent forms before participating in the study. The study was approved by the institutional ethics committee.
1H-MRS analyses
A 1H-MRS examination was performed using a clinical 2.0 T system (Gyrex 2T-Prestige, GEMS/Elscint, Haifa, Israel) with a quadrate head coil. The subject lay in the supine position, with the intersection of the frontal bone and two nasal bones (nasion) serving as a landmark. Foam pads were used to minimize head motion. Voxels were placed for spectroscopy, and all data analyses were performed by a trained radiologist who was blind to each subject’s diagnosis. The voxels were repositioned in predefined brain areas, which were localized in both the left DLPFC and left amygdala. The routine imaging studies included a multilane T1-weighted spin-echo (650/12/2 [TR/TE/NEX]), a T2-weighted fast spin-echo (6000/90/2) with an echo train length of 10, and fast fluid attenuated inversion recovery (9100/126/1; inversion time, 2,200 msec) sequences. Axial T2 fast spin-echo images (8500/2200/126) were obtained, followed by placement of a single 8 cm3 voxel (15×15×15 mm) over the left DLPFC and left amygdala ( and ). 1H-MRS was performed using a point-resolved spectroscopy sequence (1500/54 [TR/TE]), with 100 averages. Each spectrum was evaluated for peak Cr (at 3.03 ppm) and NAA (at 2.02 ppm). The values of NAA/Cr ratios were used for the analyses. Analyses of the spectral dataset were performed using the software package program supplied by the manufacturer of the magnetic resonance system (Gyrex 2T-Prestige, GEMS/Elscint).
Figure 1 Left dorsolateral prefrontal cortex.
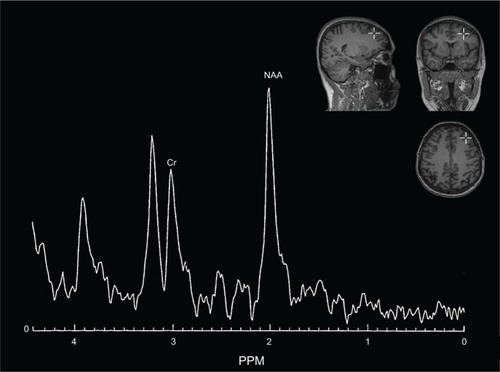
Figure 2 Left amygdala.

Statistical analysis
The statistical analysis was done using Statistica version 10 software (StatSoft Inc, Tulsa, OK, USA). Data for continuous variables are shown as the mean ± standard deviation, while data for categorical variables are laid out as frequencies and/or percentages. Due to the group size, normality testing was performed using a Shapiro–Wilk test rather than a Kolmogorov–Smirnov test. A between-group analysis was done using appropriate parametric or nonparametric tests (continuous variables), or chi-square test (categorical variables). Correlations between variables measured on an interval scale were explored by means of a Pearson or Spearman correlation. The statistical significance (type I error level) cut-off point was 0.05.
Results
Participants
Of the 29 patients who completed the study, 17 were identified as responders and 12 as nonresponders at endpoint. There were no differences in age, gender, or MADRS baseline scores between the responder and nonresponder groups. Differences between the groups were significant for baseline HAMD and BDI scores, as well as in endpoint scores for all three scales ().
Table 1 Group characteristics
MRS results
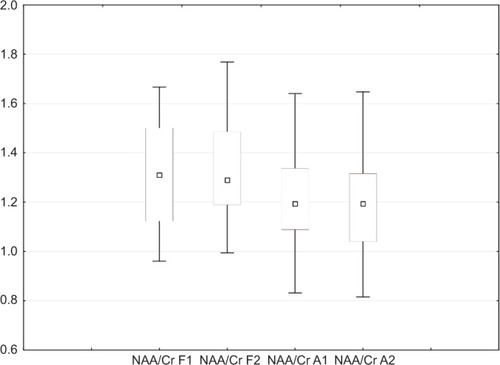
For all participants, there were no significant differences in NAA/Cr ratios between baseline and endpoint MRS in the DLPFC (P=0.950) and amygdala (P=0.649; ).
Figure 3 Box plots of NAA/Cr, showing baseline and endpoint in DLPFC and amygdala for all subjects. Shown are medians (squares), interquartile ranges (boxes), and nonoutlier range (whiskers).
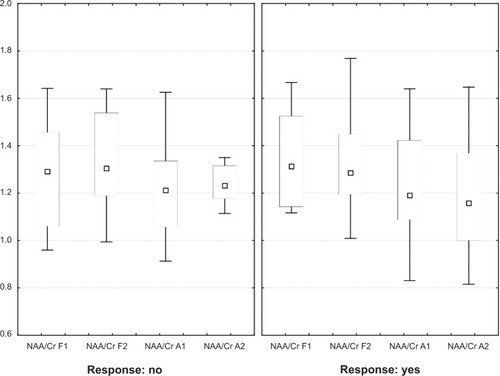
After separately analyzing the responder and nonresponder groups, no significant differences were found in either region for either group (). There were no significant differences between the responder and nonresponder groups in the baseline NAA/Cr ratio, with P=0.795 for the DLPFC and P=0.718 for the amygdala. Neither the responder group nor the nonresponder group showed significant differences in endpoint NAA/Cr ratios. For the responder group, NAA/Cr in the DLPFC was P=0.805 and P=0.552 in the amygdala. For the nonresponder group, NAA/Cr in the DLPFC was P=0.862 and P=0.977 in the amygdala.
Figure 4 Box plots of NAA/Cr in responders and nonresponders to antidepressant treatment showing baseline and endpoint in DLPFC and amygdala. Shown are medians (squares), interquartile ranges (boxes), and nonoutlier range (whiskers).
Correlation of change in metabolite measures and depression scale scores between baseline and endpoint
There was a significant difference in the mean decrease in scores on the depression scales between the responder and nonresponder groups (). However, the decrease in NAA/Cr ratios in the DLPFC and amygdala was not significantly different between the groups. For all three scales, there was no significant correlation between the difference in the endpoint and baseline scores of the scales, or the difference in the endpoint and baseline NAA/Cr ratios, in both regions () and groups ().
Table 2 Changes in scales and NAA/Cr ratios from baseline to endpoint
Table 3 Correlations of changes in scale scores with changes in NAA/Cr ratios from baseline to endpoint
Table 4 Correlations of changes in scale scores with changes in NAA/Cr ratios from baseline to endpoint in responders and nonresponders
Discussion
In this study, no significant change in NAA/Cr, measured with 1H-MRS, was found after antidepressant treatment in participants experiencing their first episode of moderate depression. There was also no difference in the change in NAA/Cr between the responder and nonresponder groups. These findings suggest there were no effects of antidepressant treatment on NAA/Cr that could be observed by 1H-MRS in either the frontal or limbic region.
These results support those of the MRS study reported by Kaymak et al in drug-naïve female patients experiencing their first episode of MDD, as no significant metabolic alterations to NAA/Cr were found in the left DLPFC after 8 weeks of antidepressant treatment.Citation43 In our previous report, even in a higher magnetic field, we did not observe significant changes in NAA/Cr in the left DLPFC after 6 weeks of antidepressant treatment; the patients were diagnosed with comorbid MDD and posttraumatic stress disorder, and there was a significant posttreatment increase in choline.Citation44
In contrast with these findings, several MRS studies on the medial frontal cortex and the hippocampus found an increase in NAA/Cr in depressive patients after antidepressant treatment.Citation37,Citation38,Citation50 Taylor et al found an increase of NAA/Cr in the medial frontal cortex after only 7 days of antidepressant treatment in depressive patients treated with escitalopram, compared with a healthy group given a placebo.Citation9 An increase in NAA after treatment would indicate the neurotrophic effect of antidepressant medication on the medial frontal cortex and the hippocampus. Two studies found a significant increase in NAA/Cr in the amygdala and the anterior cingulum after electroconvulsive therapy in depressive patients, and reached similar conclusions about the neurotrophic effect of antidepressant medicine,Citation40,Citation41 while one study did not.Citation42
NAA is considered to be a marker of neuronal density. Unaltered NAA in MDD could be explained by the absence of cellular loss in some groups of depressive patients.Citation19 According to previous reports, the neuronal cell number in patients with MDD is normal.Citation40 Some studies of unmedicated MDD patients found no differences in NAA in the left frontal cortex, compared with healthy controls and medicated patients.Citation19 Portella et al reported significantly lower NAA levels, which were associated with the onset of illness at earlier ages, in the ventromedial prefrontal cortex in remitted recurrent and chronic patients with MDD.Citation51 Wang et al found significantly lower NAA levels in the bilateral DLPFC white matter during first-episode treatment of naïve patients with MDD, compared with healthy controls.Citation39 In contrast with these studies, Milne et al found no significant decrease in NAA in either the first-episode or multiple-episode groups.Citation22 Low NAA levels imply neurodegenerative changes, and could be related to age, duration of illness, and number of depressive episodes.Citation18,Citation52 In the study by de Diego-Adelino et al it was found that metabolic alterations were more pronounced in patients with recurrent or chronic depression.Citation53 Further research is necessary to conclude whether NAA alterations in the first episode of depression could be different from chronic or late-onset depression, or whether stress-induced (reactive) depression could be different from endogenous depression.
There have been high expectations of a correlation between biological changes in the brain and the clinical changes in the course of MDD, especially with the treatment response. In this study, we found no significant differences between the responder and nonresponder groups with regard to measures of NAA/Cr at baseline and endpoint. Block et al found that low baseline NAA and choline levels in the hippocampus were associated with a positive treatment response, which was considered to be evidence of neuronal restoration in the hippocampus.Citation38 Kado et al reported that high baseline NAA/Cr levels in the frontal lobes were associated with clinical responses in depression in the elderly.Citation52 In addition, a group of patients with depressive psychosis, who had decreased NAA/Cr in their frontal lobes, showed resistance to antidepressant medication. Therefore, metabolic reactivity to antidepressant treatment could be more pronounced in patients with low baseline NAA levels as an effect of age, duration of MDD, and number of episodes. After electroconvulsive therapy in refractory depressive patients, increased NAA levels were observed only in the responder group.Citation41
In this study, an association could not be established between changes in depression intensity and changes in metabolites as effects of antidepressant therapy. Neither baseline nor after-treatment NAA/Cr levels showed a correlation with the changes in depression intensity observed from baseline to the endpoint of the study. As expected, the responder group showed significantly more improvement in scores on the clinical scales than the nonresponder group. Nevertheless, changes measured by the scales were not correlated with changes in metabolites, meaning that changes in the clinical course and intensity of depression were not followed by changes in the level of NAA/Cr, which could be measured by MRS.
Kaymak et al also did not find a correlation between NAA and HAMD scores before or after treatment.Citation43 The same studies that reported a significant increase in NAA after antidepressant treatment did not find a significant correlation between NAA and scores on clinical scales.Citation37,Citation39,Citation50 Block et al found a negative correlation between changes measured by BDI and changes in NAA after antidepressant treatment in their responder group, suggesting the importance of following changes in NAA with regard to treatment response.Citation38 Sozeri-Varma et al did not find a correlation between metabolite levels and HAMD scores in patients experiencing their first episode of mild-to-moderate depression.Citation54
In our group of participants, the severity of depression, assessed by scores on the three clinical scales, was moderate, thus excluding the possibility of an overall conclusion for patients with more severe depression. Since the severity of illness has been associated with the degree of volumetric loss in the prefrontal lobes,Citation55 a more pronounced change in neuronal viability markers could be better observed in more severely depressed patients. So far, changes in the clinical severity of MDD and treatment response have not been conclusively correlated with changes in the NAA levels of depressed patients. At this point in the research, changes in NAA levels, if any, could not be definitely translated to clinical changes during antidepressant treatment. The potential role of NAA as a biomarker of treatment effect or improvement of MDD has yet to be established.
Differences in sample characteristics, acquisition, and post-processing parameters could be responsible for the differences between this study and other MRS studies. Quantifying and interpreting metabolic information from brain MRS is complicated by a number of variables, which can affect determination of the apparent concentration.Citation56 There were also differences in the selection of participants with regard to multiple depressive episodes, therapy resistance, duration of illness, and comorbidity, as compared with similar studies. The sample of depressive participants in this study was characterized as first-episode patients who had never been treated. However, it is possible that minor depressive episodes had occurred previously, and had gone undiagnosed and untreated. This sample was comprised of middle-aged participants, with no data on previous episodes of depression, traumatic events, or insidious organic brain processes, which could not be detected at the point of inclusion in the study. It would be interesting to study brain metabolites in relation to the subsequent course of illness and aging of participants.
Better selection of MDD patients, which could be done with knowledge of the duration of untreated MDD, number of episodes, impacts of early stress, and specific depressive features, could provide a valid insight into the metabolic changes in the brain after antidepressant treatment. In this study, after differentiating responders from nonresponders, it was observed that the responder group showed significantly lower baseline HAMD and BDI scores, but not MADRS scores, compared with the nonresponder group. It is possible that, in our sample of depressive participants, psychosomatic symptoms were more prominent in the nonresponder group, which would have resulted in score differences between the HAMD and BDI, although there were no differences in the MADRS scores, which are related to the mood and cognition/energy of patients with depression. The cut-off criteria for the scales could explain differences in the severity of MDD. In this sample, the baseline scores of HAMD were indicative of more severe depression. In comparison, the baseline scores of MADRS and BDI indicated moderate depression. Putting all three assessments together, we felt the intensity was better described as moderate, rather than severe, in this sample.
Because of the known differences in clinician-rated scales and self-reported measures,Citation57 for the purpose of this study, the results of the three clinical scales were set in the correlation with changes in NAA/Cr levels.
A limitation of this study is that the participants had never been treated for depression or other mental illnesses, and were not diagnosed with comorbidity; which would hardly resemble everyday clinical practice. The number of participants in both the responder and nonresponder groups was too small for far-reaching conclusions, so there is a need for larger samples. Further limitations include the lack of a healthy control group and the inclusion of a placebo for further comparative and interpretative purposes.
In conclusion, this study did not find a significant change in the level of NAA/Cr after treatment with antidepressant medication, suggesting a prompt beneficial effect of antidepressant medication on neuronal integrity or restoration in patients experiencing their first episode of MDD. The baseline and endpoint NAA/Cr ratios were not significantly different between the responder and nonresponder groups, and could not serve as biological markers for predicting the response to treatment. Additionally, the correlation between NAA/Cr and changes in severity of MDD was not significant, meaning that the possible role of NAA as a biological correlate of the intensity of MDD and the clinical course could not be confirmed.
Considering the fact that antidepressants have an impact on both the clinical state and the neurochemistry of the brain, it would be expected that some biological changes in brain metabolites would follow clinical changes during treatment. Further studies are needed to determine conclusively whether patients with MDD have a deficit of brain metabolites, and how changes in brain metabolites correlate with symptoms, onset, outcome, and treatment response. It would also be important to determine whether the brain metabolite deficit could be reversible after antidepressant treatment, and how it could be significant for predicting the individual outcomes of treatment and the course of illness.
Acknowledgments
This study was supported by a scientific grant from the Ministry of Science, Education and Sports of the Republic of Croatia, as the part of the “1H-MRS changes in prediction of therapy response, relapse and recurrence of major depression” project (grant 108-1081870-1880).
Disclosure
The authors report no conflicts of interest in this work.
References
- DrevetsWCPriceJLFureyMLBrain structural and functional abnormalities in mood disorders: implications for neurocircuitry models of depressionBrain Struct Funct20082131–29311818704495
- SalaMPerezJSoloffPStress and hippocampal abnormalities in psychiatric disordersEur Neuropsychopharmacol200414539340515336301
- BrambillaPStanleyJANicolettiMA1H Magnetic resonance spectroscopy study of dorsolateral prefrontal cortex in unipolar mood disorder patientsPsychiatry Res2005138213113915766636
- PhillipsMLDrevetsWCRauchSLLaneRNeurobiology of emotion perception I: the neural basis of normal emotion perceptionBiol Psychiatry200354550451412946879
- DrevetsWCFunctional anatomical abnormalities in limbic and prefrontal cortical structures in major depressionProg Brain Res200012641343111105660
- KetterTAKimbrellTAGeorgeMSEffects of mood and subtype on cerebral glucose metabolism in treatment-resistant bipolar disorderBiol Psychiatry20014929710911164756
- ChenCHSucklingJOoiCFunctional coupling of the amygdala in depressed patients treated with antidepressant medicationNeuropsychopharmacology20083381909191817987064
- TaylorWDMacFallJRPayneMEOrbitofrontal cortex volume in late life depression: influence of hyperintense lesions and genetic polymorphismsPsychol Med200737121763177317335636
- TaylorMJGodlewskaBRNorburyRSelvarajSNearJCowenPJEarly increase in marker of neuronal integrity with antidepressant treatment of major depression: 1H-magnetic resonance spectroscopy of N-acetyl-aspartateInt J Neuropsychopharmacol201215101541154622449253
- ZhangJXLeungHCJohnsonMKFrontal activations associated with accessing and evaluating information in working memory: an fMRI studyNeuroimage20032031531153914642465
- DrevetsWCNeuroimaging studies of mood disordersBiol Psychiatry200048881382911063977
- HercherCTureckiGMechawarNThrough the looking glass: examining neuroanatomical evidence for cellular alterations in major depressionJ Psychiatr Res2009431194796119233384
- NestlerEJBarrotMDiLeoneRJEischAJGoldSJMonteggiaLMNeurobiology of depressionNeuron2002341132511931738
- RajkowskaGMiguel-HidalgoJJWeiJMorphometric evidence for neuronal and glial prefrontal cell pathology in major depressionBiol Psychiatry19994591085109810331101
- RajkowskaGMiguel-HidalgoJJGliogenesis and glial pathology in depressionCNS Neurol Disord Drug Targets20076321923317511618
- DavidsonRJPizzagalliDNitschkeJBPutnamKDepression: perspectives from affective neuroscienceAnnu Rev Psychol20025354557411752496
- MaddockRJBuonocoreMHMR spectroscopic studies of the brain in psychiatric disordersCurr Top Behav Neurosci212012 [Epub ahead of print]
- HusarovaVBittsanskyMOndrejkaIKernaVDobrotaDHippocampal neurometabolite changes in depression treatment: a (1)H magnetic resonance spectroscopy studyPsychiatry Res2012201320621322507761
- Yildiz-YesilogluAAnkerstDPReview of 1H magnetic resonance spectroscopy findings in major depressive disorder: a meta-analysisPsychiatry Res2006147112516806850
- UrenjakJWilliamsSRGadianDGNobleMProton nuclear magnetic resonance spectroscopy unambiguously identifies different neural cell typesJ Neurosci19931339819898441018
- NeryFGStanleyJAChenHHNormal metabolite levels in the left dorsolateral prefrontal cortex of unmedicated major depressive disorder patients: a single voxel (1)H spectroscopy studyPsychiatry Res2009174317718319910168
- MilneAMacQueenGMYucelKSoreniNHallGBHippocampal metabolic abnormalities at first onset and with recurrent episodes of a major depressive disorder: a proton magnetic resonance spectroscopy studyNeuroimage2009471364119324095
- VenkatramanTNKrishnanRRSteffensDCSongAWTaylorWDBiochemical abnormalities of the medial temporal lobe and medial prefrontal cortex in late-life depressionPsychiatry Res20091721495419179054
- VythilingamMCharlesHCTuplerLABlitchingtonTKellyLKrishnanKRFocal and lateralized subcortical abnormalities in unipolar major depressive disorder: an automated multivoxel proton magnetic resonance spectroscopy studyBiol Psychiatry200354774475014512215
- GruberSFreyRMlynarikVQuantification of metabolic differences in the frontal brain of depressive patients and controls obtained by 1H-MRS at 3 TeslaInvest Radiol200338740340812821853
- ChenCSChiangICLiCWProton magnetic resonance spectroscopy of late-life major depressive disorderPsychiatry Res2009172321021419303260
- RossBMichaelisTClinical applications of magnetic resonance spectroscopyMagn Reson Q19941041912477873353
- KumarAThomasALavretskyHFrontal white matter biochemical abnormalities in late-life major depression detected with proton magnetic resonance spectroscopyAm J Psychiatry2002159463063611925302
- BellaniMDusiNYehPHSoaresJCBrambillaPThe effects of antidepressants on human brain as detected by imaging studies. Focus on major depressionProg Neuropsychopharmacol Biol Psychiatry20113571544155221138750
- BuchsbaumMSWuJSiegelBVEffect of sertraline on regional metabolic rate in patients with affective disorderBiol Psychiatry199741115228988791
- ShelineYIBarchDMDonnellyJMOllingerJMSnyderAZMintunMAIncreased amygdala response to masked emotional faces in depressed subjects resolves with antidepressant treatment: an fMRI studyBiol Psychiatry200150965165811704071
- BrodyALSaxenaSSilvermanDHBrain metabolic changes in major depressive disorder from pre- to post-treatment with paroxetinePsychiatry Res199991312713910641577
- DavidsonRJIrwinWAnderleMJKalinNHThe neural substrates of affective processing in depressed patients treated with venlafaxineAm J Psychiatry20031601647512505803
- FuCHWilliamsSCBrammerMJNeural responses to happy facial expressions in major depression following antidepressant treatmentAm J Psychiatry2007164459960717403973
- ChenCHRidlerKSucklingJBrain imaging correlates of depressive symptom severity and predictors of symptom improvement after antidepressant treatmentBiol Psychiatry200762540741417217921
- MaybergHSBrannanSKTekellJLRegional metabolic effects of fluoxetine in major depression: serial changes and relationship to clinical responseBiol Psychiatry200048883084311063978
- GonulASKitisOOzanEThe effect of antidepressant treatment on N-acetyl aspartate levels of medial frontal cortex in drug-free depressed patientsProg Neuropsychopharmacol Biol Psychiatry200630112012516236417
- BlockWTraberFvon WiddernOProton MR spectroscopy of the hippocampus at 3 T in patients with unipolar major depressive disorder: correlates and predictors of treatment responseInt J Neuropsychopharmacol200912341542218845018
- WangYJiaYChenXHippocampal N-acetylaspartate and morning cortisol levels in drug-naive, first-episode patients with major depressive disorder: effects of treatmentJ Psychopharmacol201226111463147022706518
- PfleidererBMichaelNErfurthAEffective electroconvulsive therapy reverses glutamate/glutamine deficit in the left anterior cingulum of unipolar depressed patientsPsychiatry Res2003122318519212694892
- MerklASchubertFQuanteAAbnormal cingulate and prefrontal cortical neurochemistry in major depression after electroconvulsive therapyBiol Psychiatry201169877277920951980
- EndeGDemirakcaTTostHThe biochemistry of dysfunctional emotions: proton MR spectroscopic findings in major depressive disorderProg Brain Res200615648150117015098
- KaymakSUDemirBOguzKKSenturkSUlugBAntidepressant effect detected on proton magnetic resonance spectroscopy in drug-naive female patients with first-episode major depressionPsychiatry Clin Neurosci200963335035619566767
- HenigsbergNBajsMHrabacPChanges in brain metabolites measured with magnetic resonance spectroscopy in antidepressant responders with comorbid major depression and posttraumatic stress disorderColl Antropol201135Suppl 114514821648325
- American Psychiatric AssociationDiagnostic and Statistical Manual of Mental Disorders, Fourth EditionWashington, DC, USAAmerican Psychiatric Association1994
- MontgomerySAAsbergMA new depression scale designed to be sensitive to changeBr J Psychiatry1979134382389444788
- HamiltonMA rating scale for depressionJ Neurol Neurosurg Psychiatry196023566214399272
- BeckATWardCHMendelsonMMockJErbaughJAn inventory for measuring depressionArch Gen Psychiatry1961456157113688369
- RiedlMCampionMHornPTPullmanWEResponse time for ecallantide treatment of acute hereditary angioedema attacksAnn Allergy Asthma Immunol20101056430436.e43221130380
- HuangYChenWLiYWuXShiXGengDEffects of antidepressant treatment on N-acetyl aspartate and choline levels in the hippocampus and thalami of post-stroke depression patients: a study using (1)H magnetic resonance spectroscopyPsychiatry Res20101821485220227856
- PortellaMJde Diego-AdelinoJGomez-AnsonBVentromedial prefrontal spectroscopic abnormalities over the course of depression: a comparison among first episode, remitted recurrent and chronic patientsJ Psychiatr Res201145442743420875647
- KadoHKimuraHMurataTNagataKKannoIDepressive psychosis: clinical usefulness of MR spectroscopy data in predicting prognosisRadiology2006238124825516373773
- de Diego-AdelinoJPortellaMJGomez-AnsonBHippocampal abnormalities of glutamate/glutamine, N-acetylaspartate and choline in patients with depression are related to past illness burdenJ Psychiatry Neurosci201338210711623425950
- Sozeri-VarmaGKalkan-OguzhanogluNEfeMKirogluYDumanTNeurochemical metabolites in prefrontal cortex in patients with mild/moderate levels in first-episode depressionNeuropsychiatr Dis Treat201391053105923976854
- OngurDDrevetsWCPriceJLGlial reduction in the subgenual prefrontal cortex in mood disordersProc Natl Acad Sci U S A1998952213290132959789081
- CaverzasiEPichiecchioAPoloniGUMagnetic resonance spectroscopy in the evaluation of treatment efficacy in unipolar major depressive disorder: a review of the literatureFunct Neurol2012271132222687162
- UherRFarmerAMaierWMeasuring depression: comparison and integration of three scales in the GENDEP studyPsychol Med200838228930017922940