
 ?Mathematical formulae have been encoded as MathML and are displayed in this HTML version using MathJax in order to improve their display. Uncheck the box to turn MathJax off. This feature requires Javascript. Click on a formula to zoom.
Abstract
Background
Previous studies have demonstrated that obstructive sleep apnea (OSA) is associated with abnormal brain structural deficits. However, little is known about the changes in local synchronization of spontaneous activity in patients with OSA. The primary aim of the present study was to investigate spontaneous brain activity in patients with OSA compared with good sleepers (GSs) using regional homogeneity (ReHo) analysis based on resting-state functional magnetic resonance imaging (MRI).
Methods
Twenty-five untreated male patients with severe OSA and 25 male GSs matched for age and years of education were included in this study. The ReHo method was calculated to assess the strength of local signal synchrony and was compared between the two groups. The observed mean ReHo values were entered into Statistical Package for the Social Sciences software to assess their correlation with behavioral performance.
Results
Compared with GSs, patients with OSA showed significantly lower ReHo in the right medial frontal gyrus (BA11), right superior frontal gyrus (BA10), right cluster of the precuneus and angular gyrus (BA39), and left superior parietal lobule (BA7), and higher ReHo in the right posterior lobe of the cerebellum, right cingulate gyrus (BA23), and bilateral cluster covering the lentiform nucleus, putamen, and insula (BA13). The lower mean ReHo value in the right cluster of the precuneus and angular gyrus had a significant negative correlation with sleep time (r=−0.430, P=0.032), and higher ReHo in the right posterior lobe of the cerebellum showed a significant positive correlation with stage 3 sleep (r=0.458, P=0.021) and in the right cingulate gyrus showed a significant positive correlation with percent rapid eye movement sleep (r=0.405, P=0.045).
Conclusion
Patients with OSA showed significant regional spontaneous activity deficits in default mode network areas. The ReHo method is a useful noninvasive imaging tool for detection of early changes in cerebral ReHo in patients with OSA.
Video abstract
Point your SmartPhone at the code above. If you have a QR code reader the video abstract will appear. Or use:
Introduction
Obstructive sleep apnea (OSA) is a common sleep disorder and is characterized by repeated episodes of partial (hypopnea) or complete (apnea) obstruction of the upper airway during sleep due to pharyngeal collapse, resulting in recurrent chronic intermittent hypoxia and fragmentation of sleep.Citation1 Population-based epidemiological studies indicate that OSA affects at least 3%–7% of middle-aged adult men, 2%–5% of women, and up to 4% of children.Citation2–Citation6 OSA may cause excessive daytime sleepiness, frequently altered cardiopulmonary function, independently increased risk for hypertension, insulin resistance, cardiovascular disease, and motor vehicle accidents.Citation7–Citation10 For patients, OSA can result in deficits in executive function, memory, coordination of movement,Citation11 and attention.Citation12 Although the main contributory factors are presumed to be sleep fragmentation and intermittent nocturnal hypoxemia during sleep apneas,Citation13 the pathological mechanism of the brain deficits is still unclear.
To date, limited work has been done to investigate OSA within a neuroscientific framework, and only a handful of studies have directly addressed the neural basis for the OSA trait in patients. Previous neuroimaging studies have documented altered gray matter volume deficits in the hippocampus,Citation14–Citation16 temporal lobe, frontal lobe, anterior cingulate cortex, and cerebellar regionsCitation17,Citation18 in patients with OSA using the voxel-based morphometry method. Moreover, diffusion tensor imaging studies show a wide range of white matter integrity changes within the corpus callosum, frontal cortex, temporal cortex, parietal cortices, cingulum bundle, and cerebellum.Citation19–Citation21 Magnetic resonance spectroscopy is also a useful neuroimaging tool because it provides a measure of changes in cerebral metabolism that may reflect pathological insults to brain integrity. Several studies using magnetic resonance spectroscopy have demonstrated significant metabolic changes in OSA.Citation22–Citation24 Although these studies have focused on structural and metabolic changes in the brains of patients with OSA, little research has been undertaken to examine how the human brain is affected by OSA, leaving the mechanisms unclear.
Functional magnetic resonance imaging (MRI), a noninvasive, high spatial, and temporal resolution technique, can reflect the intrinsic functional organization of the human brain.Citation25 Previous functional MRI studies of OSA have mainly focused on task studies and more employ either respiratory or cognitive challenges, significant changes are found in brain activation levels compared with good sleepers (GSs).Citation26–Citation28 In recent years, resting-state functional MRI has become a hot topic in neuroimaging studies. Regional homogeneity (ReHo), a newly developed resting-state functional MRI approach, can analyze the similarities and coherence of intraregional spontaneous low-frequency (<0.08 Hz) signal fluctuations using voxel-wise analysis across the whole brain. ReHo is based on a data-driven approach, so does not require the onset time of the stimulus or prior knowledge, and has good test–retest reliability. The simple calculations involved and reliable characterization make it a potentially useful tool for analysis of resting-state functional MRI data, and ReHo could be regarded as a measure for investigating whether local synchronization of spontaneous brain activity is associated with OSA trait. ReHo has been used successfully to detect local abnormalities in subjects with various neurological diseases, including sleep deprivation,Citation29 transient ischemic attacks,Citation30 schizophrenia,Citation31 Parkinson’s disease,Citation32 and epilepsy.Citation33 Using ReHo, a significant pattern of abnormal local cortical and subcortical connectivity has been shown in patients with OSA.Citation34 However, resting-state functional MRI data are still scarce in patients with the condition, so more research to reveal the neuropathophysiology consequences of OSA would be of great significance.
In this prospective study, we hypothesized that, compared with GSs, patients with OSA would exhibit abnormal ReHo activity in at least parts of the areas, based on the previous studies reviewed, including the prefrontal lobe, temporal lobe, hippocampus, and cerebellum. To test this hypothesis, we used the ReHo method to investigate whether the synchrony of regional spontaneous brain activity on resting-state functional MRI was altered in male patients with severe OSA when compared with GSs. This comparison is important in OSA studies because sleepiness and oxygen deficit increases in the supine position and is expected to be accentuated following OSA.
Materials and methods
Subjects
Twenty-five untreated male patients with severe OSA and 25 male GSs matched for age and years of education were recruited for this study from the Sleep Monitoring Room in the Respiratory Department of The First Affiliated Hospital of Nanchang University. Each candidate had a detailed clinical interview and physical examination, completed a sleep questionnaire, and underwent overnight polysomnography. Inclusion criteria for the patients with OSA were as follows: male gender; age older than 22 years but younger than 60 years; and an apnea-hypopnea index (AHI) >30. Exclusion criteria for both patients and GSs were as follows: other sleep disorders, such as insomnia and a sleep-related eating disorder; history of cardiovascular disease, hypothyroidism, or diabetes mellitus; left-handedness; alcohol or illicit drug abuse, or current intake of psychoactive medications; a central nervous system disorder (neurodegenerative disease, epilepsy, head injury, psychosis, current depression); and contraindications to MRI, such as claustrophobia, metallic implants, or devices in the body. All subjects underwent a cognitive assessment using the Montreal Cognitive Assessment administered by two independent neuropsychologists. This study was approved by the human research ethics committee at The First Affiliated Hospital of Nanchang University, and all participants provided their written informed consent.
Polysomnography
We used standard overnight polysomnography with the LE-Series physiological monitoring system (Alice 5 LE, Respironics, Orlando, FL, USA) in the sleep center of our hospital, along with standard electroencephalogram, electrooculogram, chin electromyogram, and electrocardiogram checks simultaneously. Ventilatory flow at the nose and mouth was measured with thermistors. Ventilatory movements of the chest and abdomen were monitored by inductive plethysmography bands. Arterial oxygen saturation was measured transcutaneously by fingertip pulse oximetry. Apnea was defined as continuous cessation of airflow for more than 10 seconds and hypopnea was defined as a decrease in airflow by more than 30% with arousal or oxygen desaturation more than 4%.Citation35,Citation36 The AHI was determined by dividing the average of the total number of apnea/hypopnea events by the estimated hours of sleep. Subjects were recorded on videotape and were continuously observed by a polysomnography technician. Polysomnography was performed from 10 pm to 6 am next morning.
MRI parameters
MRI scanning was performed on a 3-Tesla MR scanner (Siemens, Munich, Germany). The scans consisted of a location image, T1-weighted sagittal images, T2WI axial/coronal images, and functional images. For the T1 sagittal images, 176 images were obtained (repetition time 1,900 msec, echo time 2.26 msec, thickness 1.0 mm, gap 0.5 mm, acquisition matrix 256×256, field of view 250 mm ×250 mm, flip angle 9 degrees). Finally, at the same position, 240 functional images were obtained (repetition time 2,000 msec, echo time 30 msec, thickness 4.0 mm, gap 1.2 mm, acquisition matrix 64×64, flip angle 90 degrees, field of view 230 mm ×230 mm, 30 axial slices with gradient-recalled echo-planar imaging pulse sequence covering the whole brain).
Functional MRI data analysis
Functional data were checked using MRIcro software (www.MRIcro.com) to exclude defective data. The first ten time points for the functional images were discarded due to the possible instability of the initial MRI signal and the participants’ adaptation to the scanning environment. On the basis of MATLAB2010a software (Mathworks, Natick, MA, USA), the rest of the data preprocessing was performed using DPARSFA software (http://rfmri.org/DPARSF), including DICOM form transformation, slice timing, head motion correction, and spatial normalization. Motion time courses were obtained by estimating the values for translation (mm) and rotation (degrees) for each subject. Participants who had more than 1.5 mm maximum displacement in x, y, or z and 1.5 degrees of angular motion during whole functional MRI scans were rejected. The six Friston head motion parameters was used to correct for the effects of head motion based on recent work showing that higher-order models are more effective in removing head motion effects.Citation37,Citation38 After correction for head motion, the functional MRI images were spatially normalized to the Montreal Neurological Institute space using the standard echo-planar imaging template in Statistical Parametric Mapping 8 (http://www.fil.ion.ucl.ac.uk/spm) software and resampling the images at a resolution of 3 mm ×3 mm ×3 mm. After preprocessing, the time series for each voxel were detrended and filtered (bandpass 0.01–0.08 Hz) to reduce low-frequency drift and high frequency physiological respiratory and cardiac noise and time series linear detrending. ReHo computation based on protocols from previous studies was performed with REST software (http://www.resting-fmri.Sourceforge.net).Citation29
Individual ReHo maps were generated by calculating Kendall’s coefficient of concordance (KCC) for the time series of a given voxel with those of its nearest neighbors (26 voxels) in a voxel-wise analysis. The computational formula wasCitation39
where ReHo is the KCC among the given voxels, ranging from 0 to 1; when a given cluster and its adjacent cluster in a time series is more consistent, the KCC value is more close to 1. K is the voxel number of time series within a measured cluster (the smallest unit of measured ReHo, comprised of more adjacent clusters); here, K =27 (one given voxel which was located in the cubic center plus its adjacent 26 voxels); n is the number of ranks; Ri is the sum rank of the ith time point, where
= (n + 1)K/2 is the mean of the Ri values; the standard ReHo value is the ReHo value of each cluster/mean of the whole brain ReHo value; thus, the individual ReHo map was generated for each dataset. To reduce the influence of individual variations in KCC value, normalization of the ReHo maps was done by dividing the KCC for each voxel by the average KCC of the whole brain. The resulting functional MRI data were then spatially smoothed with a Gaussian kernel of 6×6×6 mm3 full-width at half-maximum.
Statistical analysis
One-sample t-tests were first performed within each group to detect where the standardized KCC values were larger than the global mean KCC. The between-conditions statistical threshold was set at a cluster size of P<0.001, voxels at P<0.001, and a cluster volume ≥1,080 mm3 (a minimum continuous cluster volume of 1,080 mm3), corrected by the false discovery rate. Group differences based on the ReHo method were investigated using a two-samples t-test in the REST tool kit. The ages were included as nuisance covariates (variables of no interest) to remove the residual effect in the statistical models applied. A corrected significance level of individual voxel P<0.001 and cluster volume ≥1,080 mm3, using a false discovery rate-corrected threshold of P<0.05, was used to determine the between-conditions statistical significance. The results were presented by Xjview and REST.
Brain-behavior correlation analysis
Based on our ReHo findings, we identified brain regions that demonstrated significant between-group differences. These regions were classified as regions of interest and saved as masks with REST software. For each region of interest, the mean ReHo value was extracted by averaging ReHo values over all voxels for each patient with OSA. Finally, the mean ReHo values were entered into Statistical Package for the Social Sciences version 17.0 software (SPSS Inc, Chicago, IL, USA) to calculate their correlation with behavioral performance.
Results
Demographic and clinical data
The demographic and clinical characteristics of each group are summarized in . The patients with OSA had significant higher scores for body mass index (t=6.25, P<0.001), AHI (t=15.51, P<0.001), SpO2 <90% (t=6.66, P<0.001), and Epworth Sleepiness Scale (t=7.64, P<0.001) when compared with GSs.
Table 1 Demographic and clinical characteristics of patients with OSA and GSs
Changes in ReHo in OSA compared with GSs
Compared with GSs, patients with OSA showed a significantly lower ReHo in the right medial frontal gyrus (BA11), the right superior frontal gyrus (BA10), the right cluster of the precuneus and angular gyrus (BA39), and the left superior parietal lobule (BA7), and a significantly higher ReHo in the right posterior lobe of the cerebellum, the right cingulate gyrus (BA23), and the bilateral cluster covering the lentiform nucleus, putamen, and insula (BA13). The details are presented in and . The mean ReHo value of these altered areas were extracted ().
Figure 1 Regional homogeneity modeled in the magnetic resonance images of the subjects in the transverse orientation, shown at four different levels through the brain (A). The modeled surface of the brain shown in different orientations. The red color signifies an increase in ReHo areas, and the blue signifies a decrease in ReHo areas (B).
Abbreviations: GSs, good sleepers; L, left; R, right; ReHo, regional homogeneity.
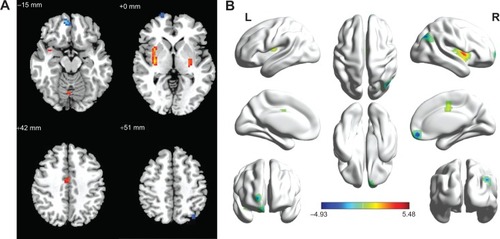
Figure 2 Mean ReHo signal values for altered regional brain areas. Patients with OSA showed altered ReHo in the right posterior lobe of the cerebellum (0.57±0.47 versus 0.17±0.38), left lentiform nucleus (0.93±0.49 versus -0.47±0.25), right lentiform nucleus (0.07±0.35 versus −0.44±0.25), right cingulate gyrus (0.78±0.52 versus 0.20±0.32), right medial frontal gyrus (−0.36±0.43 versus 0.31±0.45), right superior frontal gyrus (−0.08±0.45 versus 0.58±0.51), right precuneus (0.73±0.44 versus 1.33±0.40), and left superior parietal lobule (0.60±0.60 versus 1.25±0.35) compared with GSs.
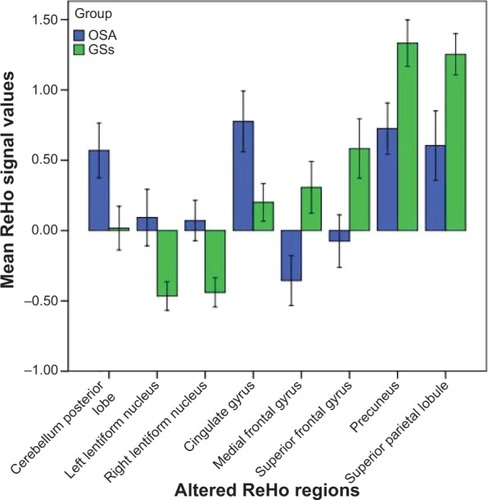
Table 2 Two-samples t-test differences in ReHo method between OSA and GSs
Correlation analysis
In patients with OSA, the AHI score showed a significant positive correlation with arousal index (r=0.642, P=0.001) and a negative correlation with percent time in rapid eye movement sleep (r=−0.429, P=0.032) and Montreal Cognitive Assessment score (r=−0.405, P=0.045). Percent time in stage 2 sleep showed a negative correlation with percent time in rapid eye movement sleep (r=−0.584, P=0.002) and Epworth Sleepiness Scale score (r=−0.531, P=0.006). Body mass index showed a significant positive correlation with arousal index (r=0.582, P=0.002).
The observed higher mean ReHo signal values in the right posterior lobe of the cerebellum showed a significant positive correlation with percent time in stage 3 sleep (r=0.458, P=0.021), the right cingulate gyrus showed a significant positive correlation with percent time in rapid eye movement sleep (r=0.405, P=0.045), and a lower mean ReHo in the right cluster of the precuneus and angular gyrus showed a significant negative correlation with sleep time (r=−0.430, P=0.032).
Discussion
Our previous study using the ReHo method demonstrated that many brain areas show obvious sex differences, both during the rested wakeful condition and the sleep deprivation condition.Citation29 To avoid the influence of sex differences, we chose only male patients with OSA to participate in this research. To our knowledge, few resting-state functional MRI studies have been conducted in patients with OSA.Citation34 The present study used ReHo to investigate the synchrony of regional spontaneous activity in resting-state functional MRI among patients with OSA. Consistent with our hypothesis, patients with OSA showed significantly lower ReHo in the right medial frontal gyrus, right superior frontal gyrus, right cluster of the precuneus and right angular gyrus, and left superior parietal lobule, and higher ReHo in the right posterior lobe of the cerebellum, right cingulate gyrus, and bilateral cluster covering the lentiform nucleus, putamen, and insula compared with GSs. Benedetti et al found that males had more right–left brain hemisphere differentiation than females.Citation40 Our previous sleep deprivation study found that both male and female subjects majorly represented strong unilateral between the good sleep condition and sleep deprivation condition, characterized by that altered ReHo areas are mainly represented in the left hemisphere, and few lower ReHo areas in the right hemisphere.Citation29 From normal sleep status to sleep deprivation status, both male and female groups demonstrated a regular pattern of changes, ie, the unilateral tendency of ReHo regions in the brain started to disappear and these regions spread to the opposite side or bilaterally.Citation29 In our study, the altered local coherence was mainly located in the right hemisphere, suggesting that male patients with OSA had strong right–left brain hemisphere differentiation.
The most interesting finding of our study was the lower ReHo signals in the precuneus, angular gyrus, and medial frontal gyrus in patients with OSA compared with GSs. To our knowledge, these areas have been identified as being part of a default mode network that is highly active during the resting state.Citation41 These brain regions are thought to be involved in a group of high-level cognitive functions, variously described as visuospatial imagery, consciousness, episodic memory, executive cognitive control, and behavioral inhibition.Citation42,Citation43 Previous studies showed decreased resting-state functional connectivity and gray matter volume in the medial prefrontal cortex of the anterior default mode network in patients with OSA, indicating both structural and functional deficits in the medial prefrontal cortex which may be related to impaired cognitive function in these patients.Citation44 Moreover, intermittent hypoxia is found to have a negative correlation with cerebral activation in the bilateral frontal and left parietal regions, and may be a major factor in default mode network dysfunction in patients with OSA.Citation45 The precuneus is located in the posteromedial cortex of the parietal lobe and is a widespread network of higher association cortical and subcortical structures, and plays an important role in an array of advanced cognition functions, including visuospatial imagery, episodic memory retrieval, self-processing, and consciousness.Citation42 A previous sleep study has shown abnormal brain function in this region.Citation46 Positron emission tomography measurements of glucose utilization indicated that metabolism was decreased in the precuneus and prefrontal cortex.Citation47 The functional impairment of the precuneus may have been caused partly by remote effects originating from morphologically impaired areas with decreased connectivity.Citation48 In support of these findings, we found that patients with OSA had decreased ReHo in the precuneus compared with GSs, and the altered ReHo in the precuneus showed a significant negative correlation with sleep time (r=−0.430, P=0.032), suggesting decreased sleep time may be an important factor for dysfunction in the precuneus. Therefore, analysis of ReHo may be useful for indexing the extent of sleep time and may be an early biomarker of brain injury in patients with OSA.
Joo et al found that patients with OSA frequently showed dysregulation of respiratory control, which might be related to morphological differences in the gray matter areas of the brain, such as the superior frontal gyrus, cingulate gyrus, and left precentral gyrus.Citation49 Previous morphological MRI studies showed significant gray matter loss or volume decrease in the frontal lobe,Citation17,Citation49 which may result in memory impairment, and executive dysfunctions. A previous MRS study demonstrated significant lower N-acetylaspartate to creatine ratios in the frontal cortex and frontal white matter of patients with OSA when compared with GSs,Citation22 suggesting the presence of cerebral damage, probably caused by chronic repeated intermittent hypoxia.Citation23 Previous task functional MRI studies in individuals with OSA showed decreased activation in the frontal cortex which was associated with both the duration of oxygen desaturation and the arousal index.Citation50,Citation51 In support of these findings, in our study we found that patients with OSA showed a significantly altered pattern of local cortical and subcortical activity in the right frontal gyrus (BA10, BA11) when compared with GSs.
We also found higher ReHo values in the right posterior lobe of the cerebellum, right cingulate gyrus, and bilateral cluster covering the lentiform nucleus, putamen, and insula in patients with OSA compared with GSs. OSA is characterized by repeated episodes of partial or complete obstruction of the upper airway during sleep.Citation52 Evidence has shown that during respiration some cingulate neurons discharged at pace, suggesting that the anterior cingulate cortex has a complex and indirect relationship to respiratory control mechanisms.Citation53 Moreover, it is important in the insular cortex for the perception of dyspnea.Citation54 The insular and cingulate areas are activated by dyspnea.Citation55,Citation56 Cerebellar structures have been associated with regulation of respiratory patterns.Citation57
The lentiform nucleus is involved in advanced cognitive function, and is sensitive to intermittent hypoxia with abundant blood supply, because of which patients with OSA, characterized by chronic intermittent hypoxia, showed higher ReHo in bilateral lentiform nucleus compared with GSs, which may be a compensatory to adapt to exposed to long-term hypoxia condition. Interestingly, these areas displayed symmetrical distribution, which may contribute to the about equal degree of hypoxia between two hemispheres.
Conclusion
In conclusion, our results showed altered synchrony of regional spontaneous activity in the default mode circuit during the resting-state condition. The ReHo on resting-state functional MRI is a simple and noninvasive method for investigating OSA, and is a promising tool for better understanding the neurobiological consequences of this condition. Although our results provide novel information with regard to our understanding of OSA, several limitations need to be considered. Firstly, larger sample sizes and female groups are needed in future studies to explore the mechanisms of OSA in the brain. Secondly, polysomnographic data were obtained after a single-night recording, so a first-night effect on sleep parameters could not been excluded. Thirdly, we only focused on the effect of severe OSA; other types of patients with OSA were not examined in this study.
Acknowledgments
The authors are grateful to the subjects who participated in this research. This work was supported by grants from the Jiangxi Provincial Department of Science and Technology Support Program (20132BBG70061 and 20141BBG70026), the Jiangxi Provincial Department of Natural Science Foundation Project (20132BAB205100), the Jiangxi Provincial Department of Graduate Innovation Foundation (YC2013-S007), the Chinese Department of National Innovation Experiment Program for University Students (201210403052 and 2012181).
Disclosure
The authors report no conflicts of interest in this work. None of the authors have any personal or financial involvement with organizations that have a financial interest in its content.
References
- ParkJGRamarKOlsonEJUpdates on definition, consequences, and management of obstructive sleep apneaMayo Clinic Proc201186549555
- PunjabiNMThe epidemiology of adult obstructive sleep apneaProc Am Thorac Soc2008513614318250205
- YoungTPeppardPEGottliebDJEpidemiology of obstructive sleep apnea: a population health perspectiveAm J Respir Crit Care Med20021651217123911991871
- National Heart, Lung, and Blood Institute Working Group on Sleep ApneaSleep apnea: is your patient at risk?Am Fam Physician1996532472538546051
- LumengJCChervinRDEpidemiology of pediatric obstructive sleep apneaProc Am Thorac Soc2008524225218250218
- EspositoMAntinolfiLGallaiBExecutive dysfunction in children affected by obstructive sleep apnea syndrome: an observational studyNeuropsychiatr Dis Treat201391087109423976855
- SeneviratneUPuvanendranKExcessive daytime sleepiness in obstructive sleep apnea: prevalence, severity, and predictorsSleep Med2004533934315222989
- IpMSLamBNgMMLamWKTsangKWLamKSObstructive sleep apnea is independently associated with insulin resistanceAm J Respir Crit Care Med200216567067611874812
- BagaiKObstructive sleep apnea, stroke, and cardiovascular diseasesNeurologist20101632933921150380
- TregearSRestonJSchoellesKPhillipsBObstructive sleep apnea and risk of motor vehicle crash: systematic review and meta-analysisJ Clin Sleep Med2009557358120465027
- VerstraetenENeurocognitive effects of obstructive sleep apnea syndromeCurr Neurol Neurosci Rep2007716116617324368
- EnnettLSBarbourCLangfordBStradlingJRDaviesRJHealth status in obstructive sleep apnea: relationship with sleep fragmentation and daytime sleepiness, and effects of continuous positive airway pressure treatmentAm J Respir Crit Care Med19991591884189010351935
- DecaryARouleauIMontplaisirJCognitive deficits associated with sleep apnea syndrome: a proposed neuropsychological test batterySleep20002336938110811381
- DusakAUrsavasAHakyemezBGokalpGTaskapiliogluOParlakMCorrelation between hippocampal volume and excessive daytime sleepiness in obstructive sleep apnea syndromeEur Rev Med Pharmacol Sci2013171198120423690189
- MorrellMJMcRobbieDWQuestRACumminARGhiassiRCorfieldDRChanges in brain morphology associated with obstructive sleep apneaSleep Med2003445145414592287
- TorelliFMoscufoNGarreffaGCognitive profile and brain morphological changes in obstructive sleep apneaNeuroimage20115478779320888921
- CanessaNCastronovoVCappaSFObstructive sleep apnea: brain structural changes and neurocognitive function before and after treatmentAm J Respir Crit Care Med20111831419142621037021
- MorrellMJacksonMTwiggGChanges in brain morphology in patients with obstructive sleep apnoeaThorax20106590891420861295
- KumarRChavezASMaceyPMWooMAYan-GoFLHarperRMAltered global and regional brain mean diffusivity in patients with obstructive sleep apneaJ Neurosci Res2012902043205222715089
- MaceyPMHendersonLAMaceyKEBrain morphology associated with obstructive sleep apneaAm J Respir Crit Care Med20021661382138712421746
- MaceyPMKumarRWooMABrain structural changes in obstructive sleep apneaSleep20083196797718652092
- AlchanatisMDeligiorgisNZiasNFrontal brain lobe impairment in obstructive sleep apnoea: a proton MR spectroscopy studyEur Respir J20042498098615572542
- AlginOGokalpGOcakogluGUrsavasATaskapiliogluOHakyemezBNeurochemical-structural changes evaluation of brain in patients with obstructive sleep apnea syndromeEur J Radiol20128149149521300501
- O’DonoghueFJWellardRMRochfordPDMagnetic resonance spectroscopy and neurocognitive dysfunction in obstructive sleep apnea before and after CPAP treatmentSleep201235414822215917
- RaichleMETwo views of brain functionTrends Cogn Sci20101418019020206576
- AyalonLAncoli-IsraelSAkaAAMcKennaBSDrummondSPARelationship between obstructive sleep apnea severity and brain activation during a sustained attention taskSleep20093237338119294957
- CastronovoVCanessaNStrambiLFBrain activation changes before and after PAP treatment in obstructive sleep apneaSleep2009321161117219750921
- MaceyKEMaceyPMWooMAInspiratory loading elicits aberrant fMRI signal changes in obstructive sleep apneaRespir Physiol Neurobiol2006151446015993658
- DaiXJGongHHWangYXGender differences in brain regional homogeneity of healthy subjects after normal sleep and after sleep deprivation: a resting-state fMRI studySleep Med20121372072722503940
- GuoJChenNLiRRegional homogeneity abnormalities in patients with transient ischaemic attack: a resting-state fMRI studyClin Neurophysiol201412552052524064249
- LiuHLiuZLiangMDecreased regional homogeneity in schizophrenia: a resting state functional magnetic resonance imaging studyNeuroreport200617192216361943
- WuTLongXZangYRegional homogeneity changes in patients with Parkinson’s diseaseHum Brain Mapp2009301502151018649351
- ZhongYLuGZhangZAltered regional synchronization in epileptic patients with generalized tonic-clonic seizuresEpilepsy Res201197839121856123
- SantarnecchiESiciliaIRichiardiJAltered cortical and subcortical local coherence in obstructive sleep apnea: a functional magnetic resonance imaging studyJ Sleep Res20132233734723171248
- RedlineSBudhirajaRKapurVThe scoring of respiratory events in sleep: reliability and validityJ Clin Sleep Med2007316920017557426
- [No authors listed]EEG arousals: scoring rules and examples: a preliminary report from the Sleep Disorders Atlas Task Force of the American Sleep Disorders AssociationSleep19921517318411032543
- SatterthwaiteTDElliottMAGerratyRTAn improved framework for confound regression and filtering for control of motion artifact in the preprocessing of resting-state functional connectivity dataNeuroimage20136424025622926292
- YanCGCheungBKellyCA comprehensive assessment of regional variation in the impact of head micromovements on functional connectomicsNeuroimage20137618320123499792
- ZangYJiangTLuYHeYTianLRegional homogeneity approach to fMRI data analysisNeuroimage20042239440015110032
- BenedettiFSmeraldiENeuroimaging and genetics of antidepressant response to sleep deprivation: implications for drug developmentCurr Pharm Des2009152637264919689334
- RaichleMEMacLeodAMSnyderAZA default mode of brain functionProc Natl Acad Sci U S A20019867668211209064
- CavannaAETrimbleMRThe precuneus: a review of its functional anatomy and behavioural correlatesBrain200612956458316399806
- WilsonCRGaffanDBrowningPGBaxterMGFunctional localization within the prefrontal cortex: missing the forest for the trees?Trends Neurosci20103353354020864190
- ZhangQWangDQinWAltered resting-state brain activity in obstructive sleep apneaSleep20133665165923633747
- PrilipkoOHuynhNSchwartzSTask positive and default mode networks during a parametric working memory task in obstructive sleep apnea patients and healthy controlsSleep201134293A301A21358846
- DaiXJMinYJGongHHEvaluation of the post-effect of acupuncture at Sanyinjiao (SP 6) under sleep deprivation by resting-state amplitude of low-frequency fluctuation: a fMRI studyZhongguo Zhen Jiu2012324752 Chinese22295826
- YaouhiKBertranFClochonPA combined neuropsychological and brain imaging study of obstructive sleep apneaJ Sleep Res200918364819250174
- ChételatGDesgrangesBde la SayetteDissociating atrophy and hypometabolism impact on episodic memory in mild cognitive impairmentBrain20031261955196712821520
- JooEYTaeWSLeeMJReduced brain gray matter concentration in patients with obstructive sleep apnea syndromeSleep20103323524120175407
- ThomasRJRosenBRSternCEWeissJWKwongKKFunctional imaging of working memory in obstructive sleep-disordered breathingJ Appl Physiol2005982226223415677733
- ZhangXMaLLiSWangLA functional MRI evaluation of frontal dysfunction in patients with severe obstructive sleep apneaSleep Med20111233534021398177
- SannaAObstructive sleep apnoea, motor vehicle accidents, and work performanceChron Respir Dis201310293323355403
- FrysingerRHarperRCardiac and respiratory relationships with neural discharge in the anterior cingulate cortex during sleep-waking statesExp Neurol1986942472633770117
- SchönDRosenkranzMRegelsbergerJDahmeBBüchelCvon LeupoldtAReduced perception of dyspnea and pain after right insular cortex lesionsAm J Respir Crit Care Med20081781173117918776150
- BanzettRBMulnierHEMurphyKRosenSDWiseRJAdamsLBreathlessness in humans activates insular cortexNeuroreport2000112117212010923655
- PeifferCPolineJBThivardLAubierMSamsonYNeural substrates for the perception of acutely induced dyspneaAm J Respir Crit Care Med200116395195711282772
- XuFFrazierDTRespiratory-related neurons of the fastigial nucleus in response to chemical and mechanical challengesJ Appl Physiol199782117711849104854