
Abstract
Study objective
To prospectively explore the underlying regional homogeneity (ReHo) brain-activity deficit in patients with chronic primary insomnia (PCPIs) and its relationship with clinical features.
Design
The ReHo method and Statistical Parametric Mapping 8 software were used to evaluate whether resting-state localized brain activity was modulated between PCPIs and good sleepers (GSs), and correlation analysis between altered regional brain areas and clinical features was calculated.
Patients and participants
Twenty-four PCPIs (17 females, seven males) and 24 (12 females, 12 males) age-, sex-, and education-matched GSs.
Measurements and results
PCPIs disturbed subjective sleep quality, split positive mood, and exacerbated negative moods. Compared with GSs, PCPIs showed higher ReHo in left fusiform gyrus, and lower ReHo in bilateral cingulate gyrus and right cerebellum anterior lobe. Compared with female GSs, female PCPIs showed higher ReHo in the left fusiform gyrus and right posterior cingulate, and lower ReHo in the left cerebellum anterior lobe and left superior frontal gyrus. Compared with male GSs, male PCPIs showed higher ReHo in the right temporal lobe and lower ReHo in the bilateral frontal lobe. The fusiform gyrus showed strong positive correlations and the frontal lobe showed negative correlations with the clinical measurements.
Conclusion
The ReHo analysis is a useful noninvasive imaging tool for the detection of cerebral changes and the indexing of clinical features. The abnormal spontaneous activity areas provided important information on the neural mechanisms underlying emotion and sleep-quality impairment in PCPIs.
Introduction
Sleep may allow the removal of free radicals accumulated in the brain during wakefulnessCitation1 and protect the structural stability of neuronal synapses. After sleep, the tired nerve cells and the biological characteristics of long-distance signal transmission recover normal physiological function. In general, a good sleep may be considered as a strong predictor of a good health.Citation2,Citation3 Conversely, a disturbed and/or interrupted sleep would adversely affect cognitive function, academic performance, and attentive ability,Citation4–Citation6 and is associated with poor emotional and physical health,Citation7 conduct problems, and substance use,Citation8,Citation9 in both sexes and at all ages.Citation7,Citation10 Chronic primary insomnia (CPI), one of the most prevalent health complaints worldwide, is expected to further increase with the aging of society.Citation11 Patients with CPI (PCPIs) who underwent chronically disturbed sleep and sleep loss, non-refreshing sleep, and heightened arousal in bedCitation12 frequently experience intrusive thoughts, which have been described as worrisome and negatively toned.
To date, limited work has been done to investigate CPI within a neuroscientific framework, and only a handful of studies have directly addressed the structural bases of CPI traits. A previous positron emission tomography study found that, compared with good sleepers (GSs), PCPIs displayed a relative increase in global cerebral metabolic rate for glucose utilization, both during sleep and when awake.Citation13 A single-photon emission computed tomography study found that PCPIs displayed a significant decrease in regional cerebral blood flow in frontal, parietal, and occipital cortices and basal ganglia during sleep.Citation14 A number of voxel-based morphometry studies have demonstrated several significantly changed gray matter concentrations (GMCs) in the frontal lobe, temporal lobe, hippocampus, and cerebellum.Citation15,Citation16 Riemann et alCitation17 found reduced hippocampal volumes, but none of other regions of interest analyzed revealed volume differences between PCPIs and GSs. Conversely, other studies found no significant between-group differences (eg, hippocampus) in any of the investigated brain morphometry variables.Citation18,Citation19 Although these studies focus on the brain structural changes in PCPIs, few resting-state functional magnetic resonance imaging (rs-fMRI) studies have been conducted to examine neural bases of PCPI brain traits, few studies take mood deficits (eg, depression, anxiety) into consideration, and still too many areas of dispute have been left unresolved. Therefore, it is important to explore the potential health effects of CPI on patients, especially the microscopic functional and emotional change aspects.
Previous studies have demonstrated that the synchronous activity of neurons is conducive to the integration and coordination of information processing in the brain,Citation20 but altering neuronal synchrony may lead to the deterioration of information processing speed and efficiency, resulting in dysfunction.Citation21 The regional homogeneity (ReHo) method, a widely used rs-fMRI measure, assesses the functional consistency and similarity for each individual by calculating Kendall’s coefficient concordance (KCC) of the time series of a given voxel with its nearest neighbors. The ReHo method is based on a data-driven approach and thus does not require onset time of stimulus and prior knowledge, and it has good test–retest reliability. It can be used to evaluate resting-state brain activities based on the hypothesis that the hemodynamic characteristics of each voxel are similar within a functional cluster and that there is dynamic synchronization of voxels within a given cluster.Citation22–Citation24 Therefore, the simple calculation and reliable characterization of the ReHo method makes it a potentially useful tool for rs-fMRI data analysis, as a measure for investigating intrinsic brain activities during the resting-state condition and whether the local synchronization of spontaneous brain activities is associated with PCPI traits.
Recently, ReHo has been successfully used to explore functional modulations and to characterize pathophysiological changes in patients with sleep problems, such as obstructive sleep apneaCitation25 and sleep deprivation,Citation24 and various neuropsychiatric disorders related to mood/emotional changes, such as unhappy individuals,Citation26 social anxiety disorders,Citation27 panic disorder,Citation28 early life stressCitation29 and depression.Citation30 However, it has not yet been used to explore pathophysiological changes in PCPIs.
On the basis of the studies reviewed above, we hypothesized that, compared with GSs, PCPIs would exhibit abnormal ReHo activities in at least parts of certain brain areas, including the prefrontal lobe, temporal lobe, hippocampus, and cerebellum, together with emotional changes. To test the hypothesis, the present prospective study is the first to characterize and compare ReHo differences between PCPIs and GSs using rs-fMRI to understand the underlying effect of CPI patients on brain function.
Materials and methods
Subjects
Twenty-four PCPIs (17 females and seven males) who had sleep onset and/or maintenance insomnia were recruited from the Psychiatry Department of The First Affiliated Hospital of Nanchang University. All subjects were evaluated with an unstructured clinical interview for history of medical and sleep disorders and with a structured interview (the Structured Clinical Interview for Diagnostic and Statistical Manual of Mental Disorders, version 4 (DSM-IV) administered by an experienced psychiatrist) to document life history of psychiatric disorders.
All PCPIs met the following criteria: 1) conformity to the definition of CPI by the International Classification of Sleep Disorders-2 (ICSD-2); 2) insomnia lasting ≥5 months; 3) a Pittsburgh Sleep Quality Index (PSQI) score ≥7; 4) had a sleep diary for at least 2 weeks’ duration; 5) right-handedness; 6) no history of inborn or other acquired diseases such as psychiatric disorder, hypertension, diabetes mellitus, coronary artery disease, no addictions such as heroin addiction, smoking addiction, or alcohol addiction, and no other sleep disorders, including hypersomnia, parasomnia, sleep-related breathing disorder, sleep-related movement disorder, or circadian rhythm sleep disorder; 7) no foreign implants in the body; and 8) moderate body shape and weight.
Twenty-four GSs (12 females and 12 males) who were age-, sex-, and education status-matched to PCPIs were recruited for this study. All GSs met the following criteria: 1) good sleeping habits and good sleep onset and/or maintenance; 2) regular dietary habits; 3) no history of swing shift, shift work, or sleep complaints; 4) no consumption of stimulants, medications, tea, or coffee for at least 3 months prior to the study; 5) PSQI score <5, Hamilton Depression Rating Scale (HAMD) and Hamilton Anxiety Rating Scale (HAMA) scores <7. All GSs also met criteria 5–8 above for PCPIs.
Research design and procedures
All volunteers were asked to wear a Fitbit Flex tracker (http://help.fitbit.com); PCPIs wore the tracker for 2 consecutive nights to evaluate their sleep status, and GSs wore it for 1 week to exclude poor sleepers. Meanwhile, the total sleep time, sleep onset latency, and sleep efficiency were recorded. Before the tests, PCPIs who had consumed psychoactive medications (eg, benzodiazepine) were asked to stop taking any medications for 48–96 hours prior to and during the study. Another eight patients were first-time visitors and had never taken any psychoactive medications before. All volunteers were asked to empty their feces and urine, and to rest quietly for 30 minutes before the rs-fMRI scans. The volunteers were instructed to wear black blinders and sponge earplugs, and fix the head, to avoid audiovisual stimulus during the rs-fMRI scans. They were told to relax and not to think of anything, and not to fall asleep in particular. A simple questionnaire was administered immediately after the scan to ask whether the subjects were awake during the scan. The data of the subjects who were asleep during the scan were excluded. This study was approved by The Human Research Ethics Committee of the First Affiliated Hospital of Nanchang University. All volunteers participated voluntarily and were informed of the purposes, methods, and the potential risks, and all signed an informed consent form.
Questionnaires
All volunteers were asked to complete a number of questionnaires, including the PSQI,Citation31 Insomnia Severity Index (ISI),Citation32 HAMDCitation33 HAMA,Citation34 Self-Rating Scale of Sleep (SRSS) and Profile of Mood States (POMS).Citation35,Citation36 The POMS questionnaire contains seven indexes in which five (nervousness, wrath, fatigue, depression, and confusion) reflect negative emotion and two (energy and self-esteem) reflect positive emotion.
fMRI parameters
fMRI scanning was performed on a 3-Tesla magnetic resonance scanner (Siemens, Germany). High-resolution T1-weighted images were acquired with a three-dimensional spoiled gradient-recalled sequence in an sagittal orientation: 176 images (repetition time =1,900 ms, echo time =2.26 ms, thickness =1.0 mm, gap =0.5 mm, acquisition matrix =256×256, field of view =250 mm × 250 mm, flip angle =9°) were obtained. Finally, 240 functional images (repetition time =2,000 ms, echo time =30 ms, thickness =4.0 mm, gap =1.2 mm, acquisition matrix =64×64, flip angle =90°, field of view =220 mm ×220 mm, 29 axial slices with Gradient-Recalled Echo-Planar Imaging pulse sequence) covering the whole brain were obtained.
fMRI data analysis
Functional data were checked by MRIcro software (www.MRIcro.com) to exclude defective data. The first ten time points of the functional images were discarded due to the possible instability of the initial fMRI signal and the participants’ adaptation to the scanning environment. On the basis of MATLAB2010a (Mathworks, Natick, MA, USA), the rest of the data preprocessing was performed by DPARSFA (http://rfmri.org/DPARSF) software, including Digital Imaging and Communications in Medicine (DICOM) standards for form transformation, slice timing, head motion correction, and spatial normalization. Motion time courses were obtained by estimating the values for translation (millmeters) and rotation (degrees) for each subject. The participants who had more than 1.5 mm maximum displacement in x, y, or z and 1.5° of angular motion during the whole fMRI scans would be rejected. After head-motion correction, the fMRI images were spatially normalized to the Montreal Neurological Institute (MNI) space using the standard Echo-Planar Imaging template in Statistical Parametric Mapping 8 (SPM8, http://www.fil.ion.ucl.ac.uk/spm) software and resampling the images at a resolution of 3 mm ×3 mm ×3 mm. After preprocessing, the time series for each voxel were temporally bandpass filtered (0.01–0.08 Hz) and linearly detrended to reduce low-frequency drift and physiological high-frequency respiratory and cardiac noise and time series linear detrending. The Friston six head motion parameters obtained by rigid body correction were used to regress out head motion effects based on recent work showing that higher-order models were more effective in removing head-motion effects.Citation37,Citation38 Linear regression was also applied to remove other sources of spurious covariates along with their temporal derivatives, including the signal from a ventricular region of interest, and the signal from a region centered in the white matter.Citation39 Of note, the global signal was not regressed out in the present data, as in Guo et alCitation40 for the reason that it is still controversial to remove the global signal in the preprocessing of resting-state data.Citation39,Citation41
Individual ReHo maps were generated for each dataset by calculating the KCC of the time series of a given voxel with those of its nearest neighbors (26 voxels) in a voxel-wise analysis, as in our previous study.Citation24 To reduce the influence of individual variations in the KCC value, normalization of ReHo maps was done by dividing the KCC among each voxel by the averaged KCC of the whole brain. The resulting fMRI data were then spatially smoothed with a Gaussian kernel of 6×6×6 mm3 full-width at half-maximum (FWHM).
Statistical analysis
For behavior performance, two-sample Student’s t-test was used for continuous data, and chi-square test was used for categorical data. All the results are quoted as two-tailed P-values. P<0.05 was considered statistically significant. All the statistical analyses were performed using IBM SPSS version 21.0 statistical software.
For fMRI data, two-sample Student’s t-tests were used to assess the differences between two groups, with age, years of education, and/or sex as nuisance covariates of no interest. A corrected significance level of individual voxel P<0.01 and V≥1,080 mm3, using an AlphaSim corrected cluster threshold of P<0.05, was used to determine the statistical significance.
Brain–behavior correlation analysis
Based on ReHo findings, the brain regions that demonstrated significant differences between groups were identified. These regions were classified as regions of interest and saved as masks with REST software. For each region of interest, the mean ReHo value was extracted by averaging ReHo values over all voxels for each PCPI. Finally, the mean ReHo values were entered into IBM SPSS 21.0 software to calculate their correlations with the behavioral performances.
Results
Behavioral results
Compared with GSs, PCPIs demonstrated worse subjective sleep estimates, respectively, as measured by PSQI (PSQI score: 15.6±2.1 versus 2.3±0.8, P=0.001; time in bed: 8.4±1.2 hours versus 8.6±0.5 hours, P=0.591; total sleep time: 3.7±1.1 hours versus 7.6±0.6 hours, P<0.001; sleep efficiency: 44.7%±15.7% versus 89.1%±59.0%, P<0.001) and Self-Rating Scale of Sleep (SRSS) (35.3±4.7 versus 15.3±2.0, P<0.001), and disturbed mood state as measured by HAMD (10.5±5.3 versus 1.9±1.2, P<0.001), HAMA (8.8±3.1 versus 1.5±1.2, P<0.001), and POMS (POMS total score: 115.2±26.3 versus 84.7±4.5, P<0.001; nervousness: 8.0±5.5 versus 1.9±0.9, P<0.001; wrath: 6.1±5.1 versus 1.9±0.9, P<0.001; fatigue: 6.2±4.7 versus 1.9±0.9, P<0.001; depression: 5.0±4.6 versus 0.6±0.7, P<0.001; confusion: 6.6±3.3 versus 3.1±1.5, P<0.001; energy: 9.4±4.9 versus 15.0±1.2, P<0.001; self-esteem: 7.3±3.6 versus 9.8±2.4, P=0.012). The details are presented in and .
Table 1 Characteristics of all volunteers
Table 2 Seven indexes of POMS questionnaires
Female PCPIs (PCPI-Fs) compared with female GSs (GS-Fs), as well as male PCPIs (PCPI-Ms) compared with male GSs (GS-Ms), showed significantly disturbed subjective sleep estimates as measured by PSQI (P<0.05) and SRSS (P<0.05), and disturbed mood state as measured by HAMD (P<0.05), HAMA (P<0.05), and POMS (P<0.05). Compared with PCPI-Ms, PCPI-Fs only showed significantly longer total sleep time (3.3±1.1 hours versus 4.4±0.9 hours, P=0.032) and higher sleep efficiency (39.0%±13.1% versus 58.6%±13.1%, P=0.003). The ISI score was 19.3±2.7 for PCPIs, 19.1±2.9 for PCPI-Fs, and 19.9±2.1 for PCPI-Ms. The details are presented in and .
Behavioral correlations
Duration of insomnia showed positive correlations with total PSQI score (r=0.539, P=0.007), POMS nervousness (r=0.440, P=0.032), wrath (r=0.414, P=0.045), depression (r=0.458, P=0.024), confusion (r=0.575, P=0.003), total score of five negative indexes (r=0.512, P=0.011), and POMS total score (r=0.454, P=0.026). PSQI displayed positive correlations with HAMD (r=0.620, P=0.001), HAMA (r=0.412, P=0.045), POMS confusion (r=0.0.410, P=0.047), and POMS total score (r=0.407, P=0.048), and negative correlations with POMS energy (r=−0.466, P=0.022), self-esteem (r=−0.427, P=0.037) and total score of two positive indexes (r=−0.470, P=0.021). HAMD and HAMA each showed positive correlation with POMS nervousness, wrath, depression, confusion, total score of five negative indexes, and POMS total score, and negative correlation with POMS energy, self-esteem, and total score of two positive indexes. ISI score showed positive correlation with SRSS score (r=0.511, P=0.011). Total POMS score of five negative indexes showed positive correlation with each of the five negative indexes, and negative correlation with energy, self-esteem, total score of two positive indexes and POMS score. Total POMS score of two positive indexes showed positive correlations with energy and self-esteem, and negative correlations with the five POMS negative indexes and their total score.
ReHo and brain–behavior correlation
All PCPIs compared with all GSs
Compared with GSs, PCPIs showed significantly higher ReHo in the left fusiform gyrus of the temporal lobe (Brodmann area [BA]37), and lower ReHo in the bilateral cingulate gyrus (BA23, BA24) and right cerebellum anterior lobe (lingual, culmen). In PCPIs, the observed bilateral cingulate gyrus showed significant negative correlation with HAMA (r=−0.436, P=0.033), but the right cerebellum anterior lobe did not show any correlations with behavioral performance. The left fusiform gyrus showed significant positive correlations with duration of insomnia (r=0.443, P=0.03), PSQI score (r=0.410, P=0.047), SRSS score (r=0.477, P=0.018), POMS nervousness (r=0.405, P=0.05), fatigue (r=0.486, P=0.016), depression (r=0.711, P<0.001), confusion (r=0.666, P<0.001), total score of five negative indexes (r=0.603, P=0.002) and POMS total score (r=0.576, P=0.003), and negative correlation with POMS energy (r=−0.416, P=0.043). The details are presented in and .
Figure 1 Various correlations for patients with chronic primary insomnia.
Abbreviations: HAMA, Hamilton Anxiety Rating Scale; GS, good sleep; PCPI, patient with chronic primary insomnia; POMS, Profile of Mood States; PSQI, Pittsburgh Sleep Quality Index; ReHo, regional homogeneity; SRSS, Self-Rating Scale of Sleep.
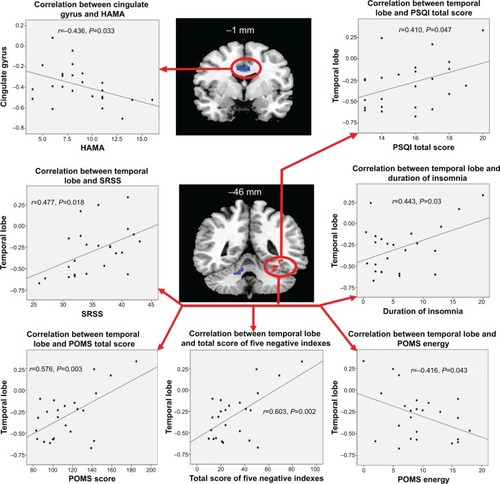
Table 3 Two-sample t-test differences with ReHo method between PCPI groups and GSs
PCPI-Fs compared with GS-Fs
Compared with GS-Fs, PCPI-Fs showed higher ReHo in the left fusiform gyrus of the temporal lobe (BA37) and right cluster of the posterior cingulate gyrus, occipital lobe, and parahippocampal gyrus (BA17, BA18, BA27, BA30), and lower ReHo in the left cerebellum anterior lobe (culmen, declive, nodule) and left superior frontal gyrus (BA10, BA11). The details are presented in and .
Figure 2 Altered ReHo areas between PCPI-Fs and GSs and its correlations with behavioral performances.
Abbreviations: HAMA, Hamilton Anxiety Rating Scale; GS-F, female good sleeper; PCPI-F, female patient with chronic primary insomnia; ReHo, regional homogeneity.
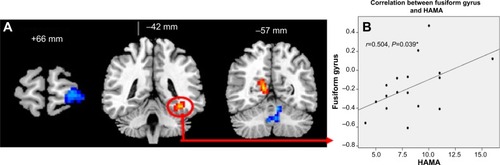
In PCPI-Fs, only the higher ReHo in the left fusiform gyrus showed significant positive correlation with HAMA score (r=0.504, P=0.039). The details are presented in .
PCPI-Ms compared with GS-Ms
Compared with GS-Ms, PCPI-Ms showed significantly higher ReHo in the right temporal lobe (middle temporal gyrus, inferior temporal gyrus; BA20, BA21), and lower ReHo in the left frontal lobe (superior frontal gyrus, middle frontal gyrus; BA6) and bilateral medial frontal gyrus (BA6). The details are presented in and .
Figure 3 Patients with chronic primary insomnia compared with normal controls.
Abbreviations: GS-M, male good sleeper; PCPI-F, female patient with chronic primary insomnia; PCPI-M, male patient with chronic primary insomnia; PSQI, Pittsburgh Sleep Quality Index; ReHo, regional homogeneity; L, left; R, right.
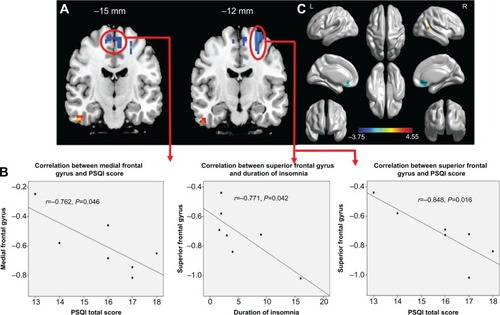
In PCPI-Ms, the left frontal lobe showed significant negative correlations with duration of insomnia (r=−0.771, P=0.042) and PSQI score (r=−0.848, P=0.016); the bilateral middle frontal gyrus showed significant negative correlation with PSQI score (r=−0.762, P=0.046). However, the temporal lobe did not display significant correlations with any behavioral performance. The details are presented in .
PCPI-Fs compared with PCPI-Ms
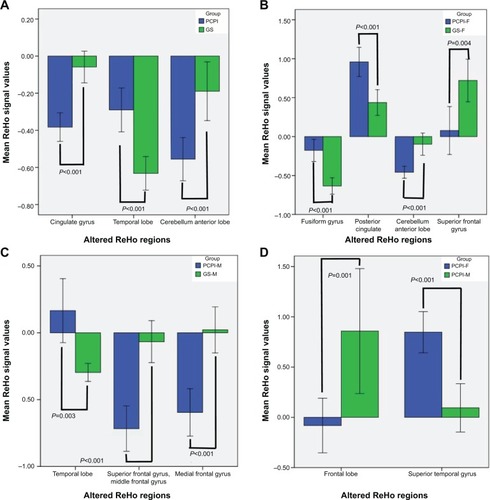
Compared with PCPI-Ms, PCPI-Fs showed significantly higher ReHo in right superior temporal gyrus (BA21, BA22), and lower ReHo in the cluster of bilateral medial frontal gyrus, subcallosal gyrus and anterior cingulate (BA11, BA25, BA32). The details are presented in and . The mean blood oxygenation level dependent (BOLD) signal value of the altered ReHo areas, as well as the different areas between other groups, as presented above, was extracted. The details of the BOLD signal value are presented in . But the altered ReHo areas didn’t display any significant correlations with PSQI total sleep time and sleep efficiency in PCPI-Fs and PCPI-Ms.
Figure 4 Mean ReHo signal values of altered regional brain areas.
Abbreviations: GS, good sleeper; GS-F, good female sleeper; GS-M, good male sleeper; PCPI, patient with chronic primary insomnia; PCPI-F, female patient with chronic primary insomnia; PCPI-M, male patient with chronic primary insomnia; PSQI, Pittsburgh Sleep Quality Index; ReHo, regional homogeneity.
Discussion
To our knowledge, this study is the first to evaluate whether resting-state local functional homogeneity was modulated by CPI utilizing an ReHo analysis and rs-fMRI approach. In our study, PSQI showed significant positive correlations with negative indexes and duration of insomnia and negative correlation with positive moods, suggesting that PSQI could be useful for indexing the duration of insomnia and mood state. Significant group differences in ReHo were observed within distributed brain regions over the temporal lobe, frontal lobe, cerebellum, and cingulate gyrus, along with disturbed subjective sleep estimates as measured by PSQI and SRSS, and disturbed mood state estimates as measured by HAMD, HAMA, and POMS, suggesting multiple clinical symptoms and brain dysfunctions were involved in PCPIs. In addition, we focused on the correlations between the ReHo differences and a number of questionnaires in CPI groups.
Temporal cortex deficits
PCPIs are hypervigilant and ruminative according to neurocognitive models, and have shown an excessive hyperarousal of the central nervous system (CNS) throughout the night in electrophysiological studies.Citation42–Citation44 In support of these findings, we found that the higher ReHo in temporal lobes showed excessive hyperarousal and development of synchronization with negative moods, duration of insomnia, and subjective sleep quality deficits, and negative correlation with positive moods in all PCPIs, PCPI-Ms, and PCPI-Fs compared with GSs. The fusiform gyrus is responsible for multimodal combined and face identification, because of which the fusiform gyrus may play a regulative role and be involved in mood. Our findings suggest that the temporal lobe (mainly in the fusiform gyrus) could be useful for indexing the extent of insomnia traits and mood state, and the hyperarousal reactivity of CPI may contribute to changes in increased activity in the temporal cortex.
Prefrontal cortex deficits
Altena et alCitation45 found that PCPIs had a smaller volume of gray matter (GMV) in the left orbitofrontal cortex, strongly correlating with the subjective severity of insomnia. Joo et alCitation15 found that PCPIs showed significant reduction of GMC in left or right dorsolateral prefrontal cortices (right superior frontal gyrus, left middle frontal gyrus, and bilateral inferior frontal gyrus), and decreased GMV in medial frontal gyrus compared with GSs. Noh et alCitation46 found that PCPIs had significantly lower scores on tests of attention and frontal-lobe function relative to GSs. In support of these findings, in the present study we found that the lower ReHo in the frontal gyrus was found both in PCPI-Ms compared with GS-Ms and in PCPI-Fs compared with GS-Fs. Furthermore, the PCPI-Fs showed more significant damage than PCPI-Ms.
Converging evidence from lesion, neuroimaging, and electrophysiological data supports the view that the frontal cortex is a key component of the circuitry that implements both positive and negative affect.Citation47 The middle frontal gyrus has been recognized as one key region associated with mood regulationCitation48 and may be an important factor for the development of depressive symptoms in Parkinson’s disease.Citation49,Citation50 In PCPI-Ms, the lower ReHo area in left superior frontal gyrus showed negative correlations with duration of insomnia and PSQI score, and the bilateral middle frontal gyrus showed negative correlation with PSQI score. In addition, duration of insomnia and PSQI score showed positive correlations with negative mood indexes and negative correlations with positive mood indexes. That is to say, the dysfunction of the frontal gyrus in PCPI-Ms, together with mood disorder, had a trend to accentuate gradually with the growth of the decline in subjective sleep quality and the duration of insomnia. Thus, we presume that the effects of CPI, together with the structural damage reviewed above, result in abnormally synchronized neural activities in the frontal gyrus. This abnormal activity causes abnormal ReHo values and, consequently, results in cognitive and emotional dysfunction. In conclusion, ReHo analysis may be an early biomarker for detecting the altered brain activity in PCPIs and could be useful for indexing the clinical features.
Cingulate cortex deficits
Terroni et alCitation51 have shown that cingulate cortex dysfunction may be a key reason for poststroke depression and working-memory damage in stroke patients. The cingulate cortex, with greater metabolism relative to the whole brain activity, plays an important role in emotion processingCitation52 and self-control,Citation53 and is regarded as the structural backbone of the brain network and involved in sleep.Citation54,Citation55 Sleep deprivation increased the reaction times and lapses rate, which has been attributed to less-efficient communication between brain areasCitation56,Citation57 and to changes in activity in the cingulate cortex,Citation58,Citation59 and which impaired the directed information flow of cingulate connectivity, proportional to its deleterious effect on vigilance.Citation60 In support of these findings, in our study we found that compared with GSs, PCPIs showed lower ReHo in the bilateral cingulate cortex with significant negative correlation with HAMA. Our findings suggest that disturbed nocturnal sleep may have a harmful effect on the cingulate cortex, which is involved in sleep and negative depression mood, and may be a key reason for post-insomnia negative mood.
Lack of hippocampal cortex deficits
Previous studies did not find any significant GMC, GMV, and white matter volume differences between PCPIs and GSs.Citation15,Citation18,Citation19 Noh et alCitation46 found that PCPIs displayed less absolute hippocampal volume (HV) and intracranial volume than GSs, but the differences between groups were not significant. They found that, in PCPIs, right and left HVs were negatively correlated with the duration of insomnia and the arousal index, and positively correlated with the recognition of visual memory. In addition, free recall in verbal memory was positively correlated with left HV in PCPIs. They thought that a long duration of insomnia and poor sleep quality contributed to a bilateral reduction in HV. However, Riemann et alCitation17 found that PCPIs demonstrated significantly reduced HV bilaterally compared with GSs. Notably, still left unclear is whether HV changed in PCPIs. In support of these findings, in the present study we further confirmed whether there are underlying ReHo brain-activity deficits in the parahippocampal gyrus. In our study, we did not find reduced ReHo areas in the hippocampus in all PCPIs compared with all GSs, and in PCPI-Ms compared with GS-Ms. However, few HVs were found in the higher ReHo in the right cluster of the posterior cingulate, occipital lobe, and parahippocampal gyrus in PCPI-Fs compared with GS-Fs.
Previous physiological, neuroimaging, and neurocognitive models demonstrated ruminative, hypervigilant, and/or excessive hyperarousal in CPI, which may relate to an imbalance of excitatory and inhibitory CNS influences.Citation13,Citation42,Citation44 These studies provide supported evidence that the hyperarousal model was regarded as a core predisposing or perpetuating factor of CPI.Citation61 This excess arousal is proposed to be manifested as exaggerated cortical, somatic, and cognitive activation, which leads to increased sensory and information processing, ultimately hampering the ability to initiate or maintain sleep.Citation62,Citation63 In support of these findings, the higher ReHo in small volumes of the posterior cingulate, occipital lobe, and parahippocampal gyrus was consistent with the excessive hyperarousal reactivity of CPI.
Cerebellum deficits
This is a crucial implication in light of mounting evidence for cerebellar involvement in various neurologic and psychiatric conditions, including autism,Citation64 depression,Citation65 and mood disorders.Citation66 The cerebellum, to form a feedforward loop through the thalamus and to form a feedback loop through the pons, interconnects a network with extensive cortical and subcortical areas. These anatomic connections of extensive cortical and subcortical areas support the role of the cerebellum in cognitive and emotional processing. A large body of empirical research in patients with cerebellar damage has demonstrated that the region is related to emotional regulation.Citation67,Citation68 The cerebellum anterior lobe, which receives the nociceptive afferent fibers of spinal cord, is unconspicuous in cognitive and behavioral impairment once it is damaged.Citation69 In our study, lower ReHo in the cerebellum anterior lobe was found both in PCPIs compared with GSs and in PCPI-Fs compared with GS-Fs. This finding suggests that disturbed nocturnal sleep may have a harmful effect on the cerebellar area and may imply the potential relationship between cerebellum and disturbed negative mood state in PCPIs.
Conclusion
In summary, our study demonstrated that the ReHo analysis, a useful noninvasive imaging tool for the detection of cerebral ReHo changes in PCPIs, could be useful for indexing the extent of insomnia, duration of insomnia, and mood state, and may be an early biomarker for detecting the altered brain activity in PCPIs. Multiple brain-region dysfunctions were involved in PCPIs, and significantly disturbed subjective sleep estimates as measured by PSQI and SRSS, and disturbed negative mood state as measured by the HAMD, HAMA, and POMS were found. The abnormal spontaneous neuronal activity in those areas provides information on the neural mechanisms underlying emotional and sleep-quality impairment in PCPIs.
Acknowledgments
The authors are grateful to the subjects who participated in this research. This work was supported by Jiangxi Provincial Department of Science and Technology Support Program (grant No 20132BBG70061 and No 20141BBG70026), Jiangxi Provincial Department of Natural Science Foundation Project (grant No 20132BAB205100), Jiangxi Provincial Department of Graduate Innovation Foundation (grant No YC2013-S007), Chinese Department of National Innovation Experiment Program for University Students (grant No 201210403052 and No 2012181).
Disclosure
This was not an industry-supported study. The authors have indicated no financial conflicts of interest in this work. None of the authors have any personal relationships, financial support, or involvement with organizations that hold financial interest in the subject matter. The authors declare no other conflicts of interest in this work.
References
- ReimundEThe free radical flux theory of sleepMed Hypotheses19944342312337838006
- LuysterFSStrolloPJZeePCWalshJKBoards of Directors of the American Academy of Sleep Medicine and the Sleep Research SocietySleep: a health imperativeSleep201235672773422654183
- WhittonSNighty night sleep tight – health benefits of a good night’s sleepInsight20123742223256436
- EdingerJDMeansMKCarneyCEKrystalADPsychomotor performance deficits and their relation to prior nights’ sleep among individuals with primary insomniaSleep200831559960718517030
- AltenaEVan Der WerfYDStrijersRLVan SomerenEJSleep loss affects vigilance: effects of chronic insomnia and sleep therapyJ Sleep Res200817333534318844819
- VarkevisserMKerkhofGAChronic insomnia and performance in a 24-h constant routine studyJ Sleep Res2005141495915743334
- CarotenutoMEspositoMParisiLDepressive symptoms and childhood sleep apnea syndromeNeuropsychiatr Dis Treat2012836937322977304
- JohnsonEOBreslauNSleep problems and substance use in adolescenceDrug Alcohol Depend20016411711470335
- LiuXZhouHSleep duration, insomnia and behavioral problems among Chinese adolescentsPsychiatry Res20021111758512140122
- EspositoMAntinolfiLGallaiBExecutive dysfunction in children affected by obstructive sleep apnea syndrome: an observational studyNeuropsychiatr Dis Treat201391087109423976855
- MorinCMBencaRChronic insomniaLancet201237998211129114122265700
- RothTRoehrsTPiesRInsomnia: pathophysiology and implications for treatmentSleep Med Rev2007111717917175184
- NofzingerEABuysseDJGermainAPriceJCMiewaldJMKupferDJFunctional neuroimaging evidence for hyperarousal in insomniaAm J Psychiatry2004161112126212815514418
- SmithMTPerlisMLChengaziVUNeuroimaging of NREM sleep in primary insomnia: a Tc-99-HMPAO single photon emission computed tomography studySleep200225332533512003163
- JooEYNohHJKimJSBrain gray matter deficits in patients with chronic primary insomniaSleep2013367999100723814336
- NeylanTCMuellerSGWangZInsomnia severity is associated with a decreased volume of the CA3/dentate gyrus hippocampal subfieldBiol Psychiatry201068549449620598672
- RiemannDVoderholzerUSpiegelhalderKChronic insomnia and MRI-measured hippocampal volumes: a pilot studySleep200730895595817702263
- SpiegelhalderKRegenWBaglioniCInsomnia does not appear to be associated with substantial structural brain changesSleep201336573173723633756
- WinkelmanJWBensonKLBuxtonOMLack of hippocampal volume differences in primary insomnia and good sleeper controls: an MRI volumetric study at 3 TeslaSleep Med201011657658220466585
- BuzsákiGDraguhnANeuronal oscillations in cortical networksScience200430456791926192915218136
- ZhangZLiuYJiangTAltered spontaneous activity in Alzheimer’s disease and mild cognitive impairment revealed by Regional HomogeneityNeuroimage20125921429144021907292
- TononiGMcIntoshARRussellDPEdelmanGMFunctional clustering: identifying strongly interactive brain regions in neuroimaging dataNeuroimage1998721331499558645
- ZangYJiangTLuYHeYTianLRegional homogeneity approach to fMRI data analysisNeuroimage200422139440015110032
- DaiXJGongHHWangYXGender differences in brain regional homogeneity of healthy subjects after normal sleep and after sleep deprivation: a resting-state fMRI studySleep Med201213672072722503940
- PengDCDaiXJGongHHAltered intrinsic regional brain activity in male patients with severe obstructive sleep apnoea: a resting-state fMRI studyNeuropsychiatr Dis Treat2014101819182625278755
- LuoYHuangXYangZLiBLiuJWeiDRegional homogeneity of intrinsic brain activity in happy and unhappy individualsPLoS One201491e8518124454814
- QiuCLiaoWDingJRegional homogeneity changes in social anxiety disorder: a resting-state fMRI studyPsychiatry Res20111941475321831605
- LaiCHWuYTChanges in regional homogeneity of parieto-temporal regions in panic disorder patients who achieved remission with antidepressant treatmentJ Affect Disord2013151270971423993443
- PhilipNSKurasYIValentineTRRegional homogeneity and resting state functional connectivity: associations with exposure to early life stressPsychiatry Res2013214324725324090510
- LiangMJZhouQYangKRIdentify changes of brain regional homogeneity in bipolar disorder and unipolar depression using resting-state FMRIPLoS One2013812e7999924324588
- BuysseDJReynoldsCF3rdMonkTHBermanSRKupferDJThe Pittsburgh Sleep Quality Index: a new instrument for psychiatric practice and researchPsychiatry Res19892821932132748771
- BastienCHVallièresAMorinCMValidation of the Insomnia Severity Index as an outcome measure for insomnia researchSleep Med20012429730711438246
- HamiltonMA rating scale for depressionJ Neurol Neurosurg Psychiatry1960231566214399272
- HamiltonMThe assessment of anxiety states by ratingBr J Med Psychol1959321505513638508
- McNairDMLorrMDropplemanLMManual for the Profile of Mood StatesSan Diego, CAEducational and Industrial Testing Services1971
- McNairDMLorrMDropplemanLFEdITS manual for the Profile of Mood StatesSan Diego, CAEdITS Educational and Industrial Testing Service1992
- SatterthwaiteTDElliottMAGerratyRTAn improved framework for confound regression and filtering for control of motion artifact in the preprocessing of resting-state functional connectivity dataNeuroimage20136424025622926292
- YanCGCheungBKellyCA comprehensive assessment of regional variation in the impact of head micromovements on functional connectomicsNeuroimage20137618320123499792
- FoxMDSnyderAZVincentJLCorbettaMVan EssenDCRaichleMEThe human brain is intrinsically organized into dynamic, anticorrelated functional networksProc Natl Acad Sci2005102279673967815976020
- GuoWJiangJXiaoCDecreased resting-state interhemispheric functional connectivity in unaffected siblings of schizophrenia patientsSchizophr Res2014152117017524325975
- SaadZSGottsSJMurphyKTrouble at rest: how correlation patterns and group differences become distorted after global signal regressionBrain Connect201221253222432927
- HarveyAGA cognitive model of insomniaBehav Res Ther200240886989312186352
- MorinCMInsomnia: Psychological Assessment and ManagementNew York, NYThe Guilford Press1993
- MericaHBloisRGaillardJMSpectral characteristics of sleep EEG in chronic insomniaEur J Neurosci1998105182618349751153
- AltenaEVrenkenHVan Der WerfYDvan den HeuvelOAVan SomerenEJReduced orbitofrontal and parietal gray matter in chronic insomnia: a voxel-based morphometric studyBiol Psychiatry201067218218519782344
- NohHJJooEYKimSTThe relationship between hippocampal volume and cognition in patients with chronic primary insomniaJ Clin Neurol20128213013822787497
- DavidsonRJAbercrombieHNitschkeJBPutnamKRegional brain function, emotion and disorders of emotionCurr Opin Neurobiol19999222823410322186
- PhillipsMLDrevetsWCRauchSLLaneRNeurobiology of emotion perception I: The neural basis of normal emotion perceptionBiol Psychiatry200354550451412946879
- CardosoEFMaiaFMFregniFDepression in Parkinson’s disease: convergence from voxel-based morphometry and functional magnetic resonance imaging in the limbic thalamusNeuroimage200947246747219398020
- RingHABenchCJTrimbleMRBrooksDJFrackowiakRSDolanRJDepression in Parkinson’s disease. A positron emission studyBr J Psychiatry199416533333397994502
- TerroniLAmaroEIosifescuDVStroke lesion in cortical neural circuits and post-stroke incidence of major depressive episode: a 4-month prospective studyWorld J Biol Psychiatry201112753954821486107
- SzilyEKériSEmotion-related brain regionsIdeggyogy Sz2008613–4778618459448
- AllmanJMHakeemAErwinJMNimchinskyEHofPThe anterior cingulate cortex. The evolution of an interface between emotion and cognitionAnn N Y Acad Sci200193510711711411161
- PiantoniGPoilSSLinkenkaer-HansenKIndividual differences in white matter diffusion affect sleep oscillationsJ Neurosci201333122723323283336
- MurphyMRiednerBAHuberRMassiminiMFerrarelliFTononiGSource modeling sleep slow wavesProc Natl Acad Sci U S A200910651608161319164756
- CheeMWTanJCZhengHLapsing during sleep deprivation is associated with distributed changes in brain activationJ Neurosci200828215519552818495886
- SadaghianiSScheeringaRLehongreKMorillonBGiraudALKleinschmidtAIntrinsic connectivity networks, alpha oscillations, and tonic alertness: a simultaneous electroencephalography/functional magnetic resonance imaging studyJ Neurosci20103030102431025020668207
- GujarNYooSSHuPWalkerMPThe unrested resting brain: sleep deprivation alters activity within the default-mode networkJ Cogn Neurosci20102281637164819702469
- TomasiDWangRLTelangFImpairment of attentional networks after 1 night of sleep deprivationCereb Cortex200919123324018483003
- PiantoniGCheungBLVan VeenBDDisrupted directed connectivity along the cingulate cortex determines vigilance after sleep deprivationNeuroimage20137921322223643925
- PerlisMLSmithMTPigeonWREtiology and pathophysiology of insomniaKrygerMHRothTDementWCPrinciples and Practice of Sleep Medicine4th edPhiladelphia, PAElsevier Inc2005714725
- RiemannDSpiegelhalderKFeigeBThe hyperarousal model of insomnia: a review of the concept and its evidenceSleep Med Rev2010141193119481481
- PerlisMLMericaHSmithMTGilesDEBeta EEG activity and insomniaSleep Med Rev20015536337412531000
- AllenGCourchesneEDifferential effects of developmental cerebellar abnormality on cognitive and motor functions in the cerebellum: an fMRI study of autismAm J Psychiatry2003160226227312562572
- LiuZXuCXuYDecreased regional homogeneity in insula and cerebellum: a resting-state fMRI study in patients with major depression and subjects at high risk for major depressionPsychiatry Res2010182321121520493670
- SoaresJCMannJJThe anatomy of mood disorders – review of structural neuroimaging studiesBiol Psychiatry1997411861068988799
- ParviziJAndersonSWMartinCODamasioHDamasioARPathological laughter and crying: a link to the cerebellumBrain2001124Pt 91708171911522574
- SchmahmannJDShermanJCThe cerebellar cognitive affective syndromeBrain1998121Pt 45615799577385
- PaulusKSMagnanoIContiMPure post-stroke cerebellar cognitive affective syndrome: a case reportNeurol Sci200425422022415549508