
Abstract
Background
Despite the devastating impact of anxiety disorders (ADs) worldwide, long-lasting debates on causes and remedies have not solved the clinician’s puzzle: who should be treated and how? Psychiatric classifications conceptualize ADs as distinct entities, with strong support from neuroscience fields. Yet, comorbidity and pharmacological response suggest a single “serotonin dysfunction” dimension. Whether AD is one or several disorders goes beyond academic quarrels, and the distinction has therapeutic relevance. Addressing the underlying dysfunctions should improve treatment response. By its own nature, neurophysiology can be the best tool to address dysfunctional processes.
Purpose
To search for neurophysiological dysfunctions and differences among panic disorder (PD), agoraphobia-social-specific phobia, obsessive–compulsive disorder (OCD) and generalized anxiety disorder.
Methods
A sample population of 192 unmedicated patients and 30 aged-matched controls partook in this study. Hypothesis-related neurophysiological variables were combined into ten independent factors: 1) dysrhythmic patterns, 2) delta, 3) theta, 4) alpha, 5) beta (whole-head absolute power z-scores), 6) event-related potential (ERP) combined latency, 7) ERP combined amplitude (z-scores), 8) magnitude, 9) site, and 10) site of hyperactive networks. Combining single variables into representative factors was necessary because, as in all real-life phenomena, the complexity of interactive processes cannot be addressed through single variables and the multiplicity of potentially implicated variables would demand an extremely large sample size for statistical analysis.
Results
The nonparametric analysis correctly classified 81% of the sample. Dysrhythmic patterns, decreased delta, and increased beta differentiated AD from controls. Shorter ERP latencies were found in several individual patients, mostly from the OCD group. Hyperactivities were found at the right frontorbital-striatal network in OCD and at the panic circuit in PD.
Conclusions
Our findings support diffuse cortical instability in AD in general, with individual differences in information processing deficits and regional hyperactivities in OCD and PD. Study limitations and the rationale behind the variable selection and combination strategy will be discussed before addressing the therapeutic implications of our findings.
Introduction
Anxiety disorders (ADs) are the most prevalent and nearly the most pervasive mental health problems nowadays.Citation1 Unresolved debatesCitation2 on whether the causes are biological, psychological, or social have moved into what happens first and how it ends up affecting the three realms.Citation2 The academic quarrels have not answered the clinician’s puzzle: who should be treated and how?
Treatment guidelines are based on nosological categories that classify each of the ADs as distinct entities.Citation3,Citation4 The distinctiveness has been supported by animalCitation5 and humanCitation6 evidence of separate circuits mediating different forms of anxiety but is challenged by the high prevalence of comorbidity and longitudinal shifts.Citation7 A single dimension, the “serotonin dysfunction disorders”,Citation8 was postulated based on the role of serotonin in animal fear models and the response to selective serotonin reuptake inhibitors (SSRIs). Neuroimaging supports the extended fear circuitryCitation9 as the skeleton for all ADs, but also suggests additional networks that differ among subtypes.Citation10 Subclassification has been suggested based on whether the symptoms are reactive or anticipatory.Citation11–Citation13 Accordingly, panic disorder (PD), agoraphobia-social-specific phobia (SP) and obsessive–compulsive disorder (OCD) can be grouped as fear disorders, while generalized AD (GAD) and post-traumatic stress disorder (PTSD) belong to the distress disorder group. The distinction is supported by functional MRI (fMRI) studies showing different patterns of hyperactivation-inhibition in the structures of the extended fear circuit.Citation13–Citation15
Further separation has been suggested by a translational model in response to danger.Citation16 Disorders with anticipatory anxiety (ie, GAD) are seen as the pathological correlate of exploring a dangerous environment, while the reactive disorders (PD, SP) as the result of a real or imagined confrontation with fearful stimuli. Because OCD and PTSD fall outside the evolutionary responses, they are grouped as a disorganized type. Separation of OCD from the other ADs is also suggested by a large body of neuroimaging and neuropsychological evidence on the involvement of regions other than the fear circuit, specifically, the extended orbito-fronto-striatal network.Citation17 Interaction between this network and the salience, the reward and the ventral attention networks is thought to participate in learning goal-directed behaviors.Citation18 The structures in these networks are rich in dopamine, serotonin and glutamate receptors. Together, they coordinate a striatal facilitation of automatized sequences with a top-down prefrontal inhibition releasing the resources when a more adaptive response is available. Either orbito-fronto-striatal hyperactivity or poor prefrontal inhibition would result in various combinations of obsessive–compulsive, attentional, motivational, and ideo-motor symptoms.
The possibility that the dorsal-attention network may also be dysfunctional in ADs is suggested by clinical and psychophysiological evidence of a bidirectional relationship between attentional control and anxiety,Citation19,Citation20 as well as by comorbidity of AD with attention deficit across the lifespan.Citation21 Altered connectivity among fear, affective and attentional networks in both ADCitation22 and adult attention deficit disorderCitation23 has been shown by fMRI studies.
Questioning whether anxiety is one or a combination of several disorders and whether it is caused by one or different types of dysfunction goes beyond conceptual frameworks. First-line treatments, SSRIsCitation24 and cognitive-behavioral therapy,Citation25 have shown adequate response rates. However, partial responses and recurrences are significant, and the rates differ across disorder subtypes.Citation26 The progressive increase in the use of other drugs, particularly, antiepileptics,Citation27 is only partially supported by controlled studies. To an unknown extent, it has been fostered by empirical exploration after repeated failures with treatments suggested by categorical guidelines. Finding the best strategy may take several trials and critical time.
The fastest way to a successful treatment is to address the physiopathogenic mechanisms. Attempts to unravel underlying mechanisms in ADs have been hampered by the dynamic complexity of the brain itself and by its job in coordinating links with internal and external environments.Citation28 Complex systems are characterized by the emergence of new phenomena from higher-level interactions. These phenomena are necessarily atypical and do not follow pre-existing rules but a self-organizing principle that keeps the system balanced.Citation29 Symptoms appear if the principle fails; the more complex the system, the harder it is to track the broken links. Metabolic conditions, personal history, and social context reflect on brain function to different extents,Citation30 ultimately creating symptomatic individual differences.Citation31 While strengthening compensatory mechanisms may suffice for some patients, others may require detangling the interacting processes to identify and target the dysfunctional ones.
Neurophysiology is a promising tool in such endeavor because its temporal resolution matches that of brain processesCitation32,Citation33 and the spatial resolution has improved noticeably with source localization techniques.Citation33–Citation35 Several processes with distinct pathophysiological significance and, inherently, different therapeutic implications, can be studied during the same session or monitored sequentially. Also, it is non-invasive and widely accessible in clinical settings.
The neurophysiology literature on AD is extensive. Several surface electroencephalogram (sEEG) studies have reported a high prevalence of cerebral dysrhythmias in AD; for a review, see Shelley et al.Citation36 Intracranial EEG has shown that at least some panic attacksCitation37,Citation38 and other anxiety episodes of longer durationCitation39 can actually be focal epileptic seizures, even if only minor changes are seen in the sEEG.Citation40 Paroxysmal activity has also been reported in intracranial recordings of OCD patients.Citation41 Together with the well-known high association of obsessive–compulsive traits with focal epilepsyCitation42 and the consistent finding of hyperactive fronto-stratial networks in OCD,Citation43 these findings suggest shared mechanisms with epileptic neuronal populations.
Much of the recent neurophysiological work in AD has focused on background changes at rest or the response to specific stimuli. For an evidence-based medicine review, see Clark et al.Citation44 Increased fast activity was reported by several studies in all AD groups and decreased slow activity was reported in OCD and phobias. Cortical instability is suggested by the majority of EEG studies across AD groups.
Several event-related potential (ERP) studies found decreased latencies in OCD and PD. Deficits in sensory gating were reported in OCD, PTSD, and phobias; enhanced responses to irrelevant stimuli; and impaired response inhibition in OCD and phobias. These findings may also relate to the functional unbalance at the orbito-fronto-striatal network discussed above. Despite the diversity of measurements and small sample sizes, Clark et alCitation44 concluded that there was enough evidence to suggest task-related alterations in allocation of attentional resources with possible differences among disorder subtypes.
Three types of dysfunction emerge from the neurophysiological data: 1) hyperactive (epileptic-like) neuronal populations, 2) cortical instability, and 3) misallocation of attentional resources. Since brain function is a complex, self-regulating phenomenon, all three types may coexist as a combination of primary and compensatory mechanisms.
The general purpose of this work was to use neurophysiological measurements in search for dysfunctional patterns in AD. In particular, we wanted to know if the patterns were shared or distinctively related to PD, OCD, SP (including Social Phobia), and GAD.
Methods
Clinical groups
The sample included 192 adult patients fulfilling the Diagnostic and Statistical Manual of Mental Disorders, 4th Edition, Text Revision (DSM-IV-TR)Citation45 criteria for AD diagnosis and 30 age-matched controls. Exclusion criteria were: history of seizures, major perinatal event or head injury, left-handedness, current neurological disorder, another DSM-IV-TR Axis I diagnosis, and alcohol abuse or illegal drug use.
All were attended as outpatients, no one was suffering from a serious medical condition. To exclude comorbidity, patients fulfilling criteria for only one DSM-IV-TR AD diagnosis during or in the 6 months before the EEG recording were accepted. However, 73% had some symptoms of another AD diagnosis, not enough to fulfill diagnostic criteria, and 45% had comorbidities with, or had switched from, another AD at an earlier time. First-time patients (n=97) were recorded before starting pharmacological treatment. Patients who were already medicated, but willing to participate, were further advised on the potential harm of the required 2-week withdrawal. Full awareness was mandatory. They were required to visit their attending psychiatrist at least twice a week for surveillance and support, and to remain at a close distance from facilities with 24-hour access to psychiatric services. No structured psychotherapy was added. Treatment reinstallation was necessary in 15 cases, excluded from the study. A total of 95 patients completed the 2-week off-medication period and were included in the study.
Patients were recruited prospectively over 10 years at the outpatient facilities of a major teaching hospital (Hospital Español de Mexico). Controls were recruited from family and friends of the hospital staff and by announcement through the radio, no monetary reward was offered. Additional exclusion criteria were: personal history of psychiatric disorder, and family history of epilepsy or hereditable psychiatric disorder. From 128 volunteers interviewed, only 30 fulfilled the inclusion criteria. ().
Table 1 Demographic characteristics and visual EEG findings of the sample based on the DSM-IV-TR criteria
All subjects signed an informed consent form after detailed explanation of the purpose and conditions of the study. The project was approved and supervised by the Ethical Committee, Hospital Español de Mexico.
Prior to recording, all subjects underwent unstructured psychiatric interview and semi-structured Anxiety Disorders Interview Schedule.Citation46
Neurophysiological recordings
EEGs were recorded from 21 monopolar electrodes, international 10/20 system,Citation47 linked-ears reference, impedance <10 kOhms, electro-oculography, and electromyography control electrodes, using either Cadwell Spectrum 32 or NeuroScan Synamps, with sampling rate of 200 Hz. Special care was taken to assure an eyes-closed, awake, and relaxed behavioral state.
Auditory ERPs, oddball paradigm,Citation48 were obtained with 20% rare/frequent (1,500/1,000 Hz) binaural stimuli, 1.5 mean inter-stimulus interval, eyes-open, center fixation, silent count.
Neurophysiological measurements
EEG, visual inspection
Records were visually inspected by two certified electroencephalographers independently in order to identify dysrhythmic patterns.Citation49 Records were identified by number to assure blindness about diagnosis, clinical conditions, and referral. Attended patterns were either epileptiform (spikes, spike-wave, polyspikes, and polyspike-wave) or marginal (midtemporal theta, wicket spikes, and 14-6/s discharges). These patterns have been traditionally considered normal variants because they are not related to epileptic syndromes. However, when observed, other non-epileptic dysfunctional conditions are present (ie, migraine, syncope, psychiatric disorders), and their relation to abnormal neuronal firing has been proposed by several authors.Citation35,Citation50
Inter-rater reliability was 85% for the classical epileptiform discharges vs marginal patterns. When in conflict, the final decision was taken after a joint discussion with a third electroencephalographer, usually with epilepsy training. Reliability was much lower for differences between “marginal” and normal patterns. Since these patterns are poorly defined and controverted in the literature, any disagreement was voted in favor of normal pattern. By this criterion, 31 dubitable records were declared normal.
Quantitative EEG analysis
Forty-eight 2.5 second EEG epochs were collected, carefully discarding artifacts or paroxysms, maintaining the sample reliability above 95% (ratio of variance between the even and odd seconds of the time series), resampled to 100 Hz and averaged before further analysis with NeuroGuide Software to obtain the z-transformed absolute power for each conventional band at each electrode site.Citation51
Event-related potential
Latency and amplitude of the N100, N200, and P300 responsesCitation48 were measuredCitation34 at maximal negative peaks at Fz, the positive peak at Pz, time window 260–400 ms. After log transformation, z-scores were calculated against the laboratory database.
Low-resolution electromagnetic topography
Current source densities in 3D space were calculated with low-resolution electromagnetic topography (LORETA) method using the Key Institute softwareCitation52 according to Talairach Atlas coordinates of the Montreal Neurological Institute’s MRI. Cross-spectral values at each 1 Hz frequency band were multiplied by the T matrix (x, y, and z current source moments in each of the 2,394 gray matter voxels, containing the corresponding weights for tissue connectivity in a 3-sphere model and Laplacian smoothing). The current sources of all voxels in a given region of interest (ROI) were averaged to create 66 current source densities, for each 1 Hz band, for each 2.5 second epoch. For details on theoretical grounds and mathematical transformations, see Gomez and Thatcher.Citation53
The raw LORETA scores of the 48 epochs were averaged before further transformation. The 66 ROIs were reduced to 46 by combining adjacent ROIs with small number or voxels into ROIs with sufficient number approximate normal distribution for z transformation with the NeuroGuide database.Citation54,Citation55
Hypothesis-driven variable selection and hypothesis-guided combination
From the widely varied symptoms and longitudinal courses in AD, we expected several interacting processes weighted differently in each subject, but similar enough to create consistent patterns for similar symptoms. Therefore, we moved beyond single measures to look for combinations that could reflect the triad of frameworks.
Variable selection was based on 1) reliability and stability under the standardized conditions routinely used in our laboratory, and 2) known functional significance and possible relation to one of the three neurophysiological frameworks for AD.
Too many variables fulfilled these criteria; further reduction was achieved by either using previously reported combinations or combining under hypothesis guidance.
Variables related to cortical stability
Whole-head absolute power z-scores of delta (WHDP), theta (WHTP), alpha and beta (WHBP) were obtained by averaging the z-scores of the 19 electrode sites. These measurements have been extensively used to study cortical stability and neurotransmitter balanceCitation56,Citation57 and were included as quantitative factors.
Variables related to attentional resource allocation
From several ERP paradigms available, the auditory P300 was selected because of practical and theoretical reasons. Under standardized conditions, the measurements were highly reliable and the procedure was well known to the laboratory staff. It was designed to study the availabilityCitation48 and allocationCitation58 of attentional resources, and has been related to dopamine function in the orbito-fronto-striatal network.Citation59 Various components of the P300 response reflect different stages of stimulus-driven (bottom-up) attentional processes.Citation58 A more comprehensive ERP interpretation suggests top-down cortical control over the stimulus-response so that the registered waves are the final output of feedforward anticipation and feedback performance loops.Citation60 Abnormal latencies and amplitudes of one or more components have been reported in AD,Citation44 but the results differ regarding the affected ERP component.Citation44 Besides the methodological differences, it is possible that AD patients have actually more inter- and intra-subject variability on the stages affected during attentional processes. Top-down modulation of the ERP predicts wider inter-individual variability because the response can be influenced by current context as well as by personal history.Citation60 A more variable response would be predicted from altered dopaminergic (DA) function at the orbito-fronto-striatal network.Citation59 Intending to address attentional processes regardless of specific stage, we studied central conduction velocity combining the latency z-scores of the N100, N200, and P300 components and the amount of allocated attentional resources by combining amplitude z-scores of the same three components.
Variables related to hyperactive neuronal populations
Epileptic neuronal behavior is the oldestCitation61 and the most elusiveCitation62 neurophysiological hypothesis in AD. Its hallmark, epileptiform activity,Citation63 was included as a qualitative factor (EPI) with three levels (epileptiform, marginal, and none). The hypothesis of an epileptic neuronal behavior underlying AD has two main heuristic obstacles. One is the deep location of potentially relevant structures,Citation39,Citation41 limiting the validity of negative findings on the sEEG.Citation37 The other is the complexity of the phenomena under study.Citation2,Citation64 The clinical manifestations of focal discharges are usually short and stereotyped.Citation65 The complex features of AD symptoms could more likely be caused by the impact of focal discharges on the emergent properties of the system’s dynamic interactions. Short- and long-lasting dynamic changes would reflect in episodic or chronic manifestations of the network dysfunction.
To search for possible complex network dysfunction at deep locations, we chose the LORETA method because it can measure and compare the distribution strength of multiple sourcesCitation66,Citation67 and has been used to study neuronal networks.Citation68
Current densities are continuously changing in an apparently random or semi-chaotic fashion because of myriad ongoing processes unknown to the observer.Citation69 Similar to some fMRI studies,Citation70,Citation71 we averaged 48 epochs overtime to identify regions of persistent hyperactivity against a continuously changing background.
Hyperactive networks can be caused not only by epileptic firing, but also by overload of network-related tasks.Citation72 To further support epileptic-like behavior underlying the hyperactivities, the 30 narrow-band z-LORETA scores were combined into one broadband score (bzLORETA) for each ROI (bzROI). Broadband power has been used in quantitative EEG to identify epileptic foci in the absence of visually detectable epileptiform dischargesCitation73 because the broadband reflects the mixture of wavelengths contained in the spike–wave complex even if it occurs at a small scale.
We wanted to study the three networks that have been implicated in AD by clinical, neuropsychological, and fMRI studies (see “Introduction” section). To reduce the factor load, and given that networks are defined by co-activation of regions,Citation74 we selected and combined the highly correlated ROIs within each network. Pearson’s correlationsCitation75 were calculated for all the ROIs belonging to each one of the following networks: extended orbito-fronto-striatal (fnROI),Citation43 extended panic (pnROI),Citation9 and dorsal attention ROI.Citation76 ROIs within each network with correlations above 0.85 were averaged to create one right and one left network-representative nROI for the three networks. Included ROIs and the represented network are shown in .
Table 2 Regions of interest combined by model-network correspondence
The highest bzLORETA from the six nROIs was divided by the mean bzLORETA of all ROIs as a measure of network hyperactivity (nbzLORETA). This measure was included in the analysis as a quantitative factor. The nROI from which it was obtained and the side – left/right – were included as categorical factors.
Statistical analysis
Contingency tables and correspondence analysisCitation75 with chi-square tests were used to describe the sample distribution and relation to clinical groups of the three categorical factors: EPI, cROI and side (; ), Fisher linear discrimination for the quantitative ones.Citation75
Figure 1 Multiple correspondence analysis.
Abbreviations: CNTRL, control; dn, dorsal attention; EPI, epileptiform patterns at visual inspection; fn, extended orbito-fronto-striatal; GAD, generalized anxiety; OCD, obsessive–compulsive disorder; PD, panic disorder; pn, extended panic; nROI, network representative combination of ROIs; ROI, region of interest; SP, agoraphobia-social-specific phobia.
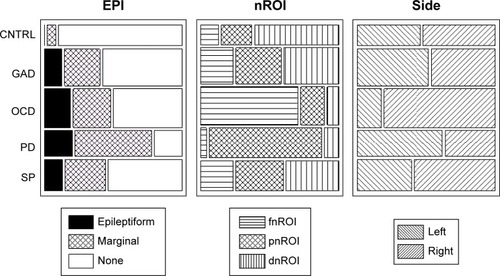
Table 3 Results from the ten single-factor linear discrimination with clinical group
The relationships of all factors among them and with clinical groups were tested under a General Linear Model (GLM),Citation75 dummy-coding the categorical variables.Citation77 Even if the individual factors were normally distributed, our combination of variables created a complex data set. The probabilistic neural network classifier (PNNC)Citation78,Citation79 adjusts to the available data and does not require any a priori information about the population. By using the PNNC, we expected robust and reliable results despite the complexity of the data.
PNNC assigned the observations to one of five clinical groups by creating a non-parametric estimate of each group’s density function at a desired location based on neighboring observations from that group. Training was performed by back-propagating weights of the node connections and iteratively adapting the errors generated at the output, until the performance reached a plateau.Citation80 Performance is defined by the error between target outputs, and actual network outputs (mean square error). Once the PNNC is trained, it can be applied to new, unknown data (validation sample).
We first trained the model with half of the sample randomly selected, and validated with the remaining half. The reliability was tested by repeating the classification 100 times with bootstrap,Citation81 from which we obtained mean classification accuracy, deviations, and confidence intervals.
To check for possible differences introduced by having had medication in the past, we repeated the procedure using the never-medicated patients as training and the 2-week off-medication as validation sample. The PNNC is more sensitive (“unstable”) than linear discriminant analysis or any other machine learning algorithm. Small changes in the training sample could cause large variations in the test results.Citation80 Unknown information, whether random or patterned, would have affected classification accuracy.
Mean classification accuracy and standard deviations from the 100 bootstrap repetitions were used for the independent t-test between the two modes of defining the training sample.
Results
General findings
At the individual level, nearly all patients (190/192) showed atypical brain activity, whether by dysrhythmic patterns at visual inspection (98/192), significant deviations in quantitative measures (92/192), or both (178/192). Epileptiform activity was seen in 32 patients, marginal patterns in 66 patients, and two controls. Few small deviations in quantitative changes were seen for the control (CNTRL) group, not on the same subject, and not significantly affecting group averages.
Decreased WHDP (z<−1.96, P<0.05) and increased WHBP (z>1.96, P<0.05) were seen at the individual level in all patient groups but not in controls. Significantly shorter latency z-scores of the N100, N200, and P300 components and/or smaller amplitude of the event-related-potential were also found in 30% of the patients, not in controls. Longer latencies were one in the CNTRL and one in the PD groups.
Each of these findings, when used as single factor, could not predict group membership. The largest correlation with all groups was 0.41 for the WHDP. However, some single groups were fairly well classified by one of the factors: 74% of the controls were correctly identified by lacking dysrhythmic patterns, 76% by low deviations in WHDP, and 75% of OCD patients by more activity at the fnROI. The ten independently calculated Fisher’s linear discriminationsCitation75 are shown in .
The GLMCitation75 using all factors explained 77.4% of the variance (R-squared corrected, F=69.94, P=0.000). Summary statistics of the multivariate analysis of the ten factors, function coefficients with confidence intervals and inflation factors below 10 for all factors are shown in . Inflation factors below 10 reflect no significant collinearities. A scat-terplot of discriminant scores in 3D is shown in , axes represented by the highest overall coefficients: bzLORETA, P300a, and WHBP. Interestingly, each of these measures came from a different neurophysiological hypothesis.
Figure 2 Probabilistic neural network classifier.
Abbreviations: CNTRL, control; ERPa, amplitude of the event-related-potentials; GAD, generalized anxiety disorder; nbzLORETA, highest network-broadband z values of current source density; nROI, network representative combination of ROIs; OCD, obsessive–compulsive disorder; PD, panic disorder; SP, agoraphobia-social-specific phobia; WHBP, whole-head beta power.
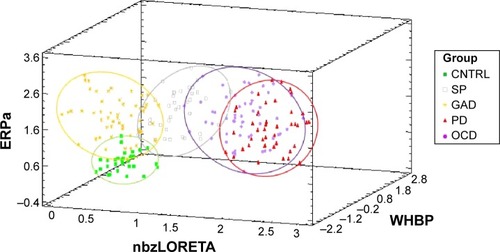
Table 4 Summary statistics for each of the seven quantitative and three categorical factors
Chi-square decomposition of the correspondence analysis on the categorical factors () showed significant contributions for CNTRL group from EPI = None (8.04/29.88), for the OCD group from the fnROI (38.17/116.24), for the right-side (6.30/17.21), and for the PD from the pnROI (22.08/116.18).
Table 5 Correspondence analysis of the three categorical factors (EPI, nROI, and side)
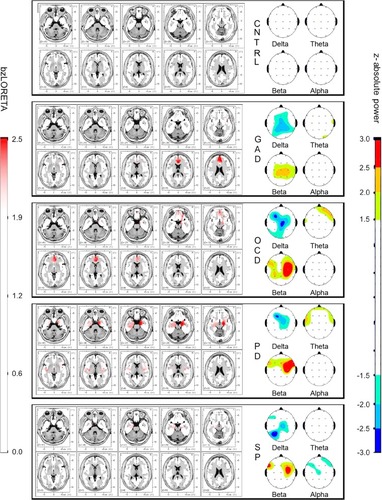
Mapping the group-means () showed decreased WHDP and increased WHBP in all clinical groups, but not in the controls. Increased zLORETA over the right orbito-fronto-striatal and cingulate regions was seen in the OCD group, and over amygdala and insula in the PD group. These findings were bilateral as group-mean but lateralized in each subject. Group-mean maps were in close correspondence with predicted group profiles from the GLM coefficients: decreased WHDP, increased WHBP, and WHTP in GAD; regional bzLORETA increase over the right fnROI, decreased WHDP, increased WHBP, and shorter P300 latency in OCD; increased bzLORETA at pnROI, no lateral predominance in PD; decreased WHDP, increased WHTP, and WHBP in SP.
Figure 3 Group-mean maps of absolute power z-scores in the four conventional bands, and bzLORETA of the generalized anxiety disorder (GAD), obsessive–compulsive disorder (OCD), panic disorder (PD), and agoraphobia-social-specific phobia (SP) groups.
Abbreviations: bzLORETA, broadband z-transformed low-resolution electromagnetic topography; CNTRL, control.
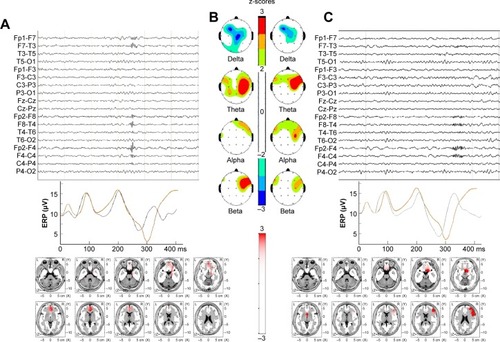
Each subject showed different combination of findings but to some extent similar to the group profiles. As an example of individual differences within a group, shows findings of two OCD patients. At visual inspection, epileptiform activity was seen in one patient but not in other. Despite such a marked difference in the visual EEG, bzLORETA increases at right anterior regions and shorter P300l were found in both patients.
Figure 4 Individual examples of EEG trace (C), ERP, P300 response (B), absolute power (A), and bzLORETA maps (lower panels) of two patients with obsessive–compulsive disorder.
Abbreviations: bzLORETA, broadband z-transformed low-resolution electromagnetic topography; EEG, electroencephalogram; ERP, event-related potential.
The 100 bootstrap repetitionsCitation52 of the non-parametric discriminationCitation51 resulted in a mean discrimination accuracy of 80.95% for the randomly assigned training sample, 79.41% for the validation, 79.92% and 78.91% when the never-medicated patients entered as the training sample (for summary statistics refer to ). The percentage of correctly classified subjects for each group is shown in . Groups showed different degrees of homogeneity in their neurophysiological patterns, the first discriminant function separates OD and PD from the other groups, the second discriminates all ().
Figure 5 Scatterplot of vectors for the discriminant functions.
Abbreviations: CNTRL, control; GAD, generalized anxiety disorder; OCD, obsessive–compulsive disorder; PD, panic disorder; SP, agoraphobia-social-specific phobia.
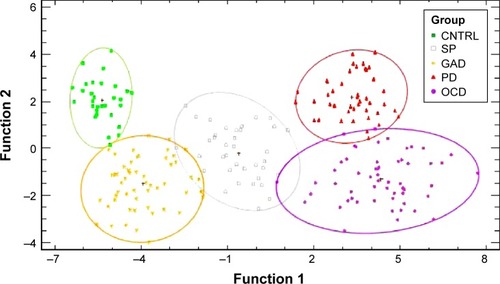
Table 6 Classification results from the non-parametric discriminant function, Probabilistic Neural Network Classification (PNNC) for the training and validation samples, random-split
Table 7 Results from the 100 repetition bootstrap analysis on the classification rates obtained from the non-parametric discriminant function, Probabilistic Neural Network Classification on the whole sample divided by random-split into training and validation samples
Classification accuracy did not differ between the two modes of running the PNNC: training sample constituted by never-medicated subjects, or, randomly selected (t=1.29002, P=0.0198548, 95% confidence interval: −0.532141, 2.54526).
Discussion
Pitfalls and limitations
The present work aimed to identify physiopathogenic mechanisms underlying ADs in general and possible differences related to symptomatic profiles. Some pitfalls were linked to the aim and will be addressed first.
Sample composition
We wanted to study a large sample of unmedicated patients in order to: 1) extract consistent neurophysiological patterns despite the wide variety of individual presentations in AD – the literature on neurophysiological findings in AD is extensive but inconclusive, mainly because of methodological differences and small sample sizes,Citation44 2) avoid interference of anti-anxiety medications, known to modify neurophysiological measurementsCitation82 presumably by acting upon the same mechanisms we intend to investigate.
Recruiting over a long time
It took 10 years to recruit such a sample; meanwhile, there were changes in DSM, clinical scales and psychophysiological paradigms. Consistency was achieved by including only the type of data that were available from all subjects. Reclassification to DSM-IV-TRCitation45 was possible because the Anxiety Disorders Interview ScheduleCitation46 scores included dimensional information, yet, it was not enough to match the DSM-VCitation5 criteria. All records included the P300 paradigmCitation49 and the resting EEG met the requirements to use the LORETA method.Citation52
Medication history
The unmedicated condition introduced a bias because only half of the sample was completely naïve while the other was constituted by patients willing to participate, even if risking a withdrawal worsening. The majority of these had been poorly responsive to anxiolytic treatments. However, the impact of medication history was negligible, if any, on the analysis, since classification rates were not statistically different when the training sample was created from never-treated subjects when it was randomly selected (t=1.29, P=0.02).
Recruitment environment
Another limitation of the study is that our sample may not represent the entire AD population. We asked the psychiatrists to refer all AD patients willing to participate regardless of symptoms severity. However, all the contacted psychiatrists work in a major teaching hospital, where the proportion of atypical or severe cases is usually higher than in community hospitals or primary care mental health facilities.
Variable selection and combination
The variety of symptom profiles, comorbidities and longitudinal switching in AD suggest dynamic interactions of multiple processes as underlying mechanisms.Citation2 Single variables are insufficient to explore complex phenomena,Citation83 and medical problems are by definition complex.Citation84,Citation85 For centuries, the clinician’s solution has been to combine all the available information from potentially implicated sources. Trying to adopt a clinician-like strategy, we were challenged by a large amount of neurophysiological information to select from, even if focusing only on hypothesis-related variables. Therefore, we combined those related to the same process and measured on the same scale, creating ten independent factors for the analysis. The statistical properties of each factor and its relation to the clinical group were investigated with descriptive and relational methods. Factor scores were normally distributed but, as often happens in the real world, homoscedasticity could not be assumed.Citation75 The problem was addressed by using our final test as a non-parametric Bayesian discriminant model,Citation78 the PNNCCitation79 with 100 bootstrap repetitions to determine the confidence intervals of the classification accuracy.Citation81
At this point, we shall emphasize that the discriminant function was not intended as a biomarker or a diagnostic test, but only to explore the potential use of combined information when investigating complex behavioral phenomena. In that sense, despite sample and variable selection biases, oversimplification of measurements, and statistical limitations, the study fulfilled its purpose.
General findings
Nearly all patients showed evidence of atypical brain activity, varying in type and degree. Some dysfunctional mechanisms were common to all groups, with more or less individual differences, while others were related to diagnostic subtype. Dysrhythmic patterns at visual inspection, power increase in beta, and decrease in delta were frequent findings in individual patients from all clinical groups. Only two control subjects showed marginal patterns at visual inspection and one had increased ERP latencies; all other measures were within normal limits for the CNTRL group. Using single factor discriminators, this group obtained 76% correct classification with WHDP and 74% with EPI (negative correlation). Also, 75% correct classification of OCD patients was obtained with nROI, suggesting higher activation of a given network. Involvement of the right frontostriatal network was suggested by a significant association of OCD with fnROI and a non-significant with the right-side in the correspondence analysis of categorical factors. Another significant association was that of the PD group with the panic network.
Even though the controls were fairly well classified by not having dysrhythmic patterns or significant delta power deviations, none of these findings, when used as single-factor discriminant could predict overall group membership (highest correlation =−0.41, highest all-group classification =42).
In contrast, the PNNC accurately classified 80% of the sample (). From this result, we conclude that complex phenomena are better explored by combining evidence from different sources.
Hypothesis-related findings
Cortical instability
The most consistent findings across all AD groups were the whole-head power decrease in delta and increase in beta (). These were the only relevant findings in GAD, suggesting that these changes are related to anxiety as a common symptom. Increased betaCitation44 is one of the most consistent findings across AD studies. The functional significance of delta and beta activities has been under study since the beginning of the EEG. In wakefulness, beta activity denotes cortical activation,Citation86 and low voltage delta oscillations are related to cognitive processing.Citation87 Delta–beta coupling has been related to attentional controlCitation88 and efficiency of cognitive access.Citation89 Our findings of whole-head power decreased delta and increased beta denote an uncoupled diffuse hyperactivation and cortical instability. Delta power has been related to brainstem serotonin activity.Citation90,Citation91 In animal models,Citation90 different amygdaloid efferents to the hypothalamus and ventral tegmen-tal area are involved in several types of anxiety-like responses. Brainstem serotonin neurons have efferent connections back to the amygdala and the neocortex, modulating their activity. Neuroimaging studies also support brainstem serotonin involvement in AD.Citation91,Citation92 It is possible that the good response seen in most AD patients, regardless of subtype, is mediated through the effect of increased brainstem serotonin activity.
Misallocation of attentional resources
Combined latency and/or amplitude of the ERP components were beyond 2 z-scores in 30% of the patients, suggesting altered information processes. In the multivariate analysis, shorter latencies contributed to OCD group discrimination. Despite methodological differences, OCD studies reported shortening of one or more of the component latencies.Citation44 The role of dopamine on the generation of several ERP components has been thoroughly explored.Citation59,Citation93 Different lines of evidence suggest the role of DA in ERP latencies and amplitudes, as well as on the inter-trial variability, which in turn will affect the averaged amplitudes. Some of our patients, mostly from the OCD group, showed shorter latencies and increased amplitudes. This is opposite to what has been found in attention deficit patients who respond to DA medication. It is possible that the DA system plays a stronger role in the overall neurotransmitter deregulation in those patients with shortened ERP latencies.
Network hyperexcitability
The incidence of epileptiform activity () was similar to that reported in other AD studies,Citation30,Citation44,Citation50 but marginal patterns were more frequent in our patients. It is possible that our sample was biased toward atypical or more severe cases as discussed earlier. It is also possible that because “marginal patterns” lack a formal definition, we have included waveforms not considered by other studies. However, only two controls showed marginal patterns, the difference with clinical groups was large (56.0% vs 6.7%) suggesting that indeed, those patterns have clinical implication and reflect some level of brain dysfunction.
The controls also differed from the clinical groups in not showing significant increases in bzLORETA, a factor included to identify hyperactive neuronal populations. In contrast, significant increases were seen at different locations in OCD, PD and SP (). The increase was most consistent in the right fnROI for the OCD group, as shown by the correspondence analysis of categorical factors (; ). This is in agreement with studies from different neuroscience fields in OCD,Citation17,Citation41–Citation43 further supported by evidence of functional hyperconnectivity at the orbito-fronto-striatal circuit.Citation94
As discussed in the “Variables related to hyperactive neuronal populations” section, regional hyperactivities are not necessarily caused by epileptic discharges. Looking for epileptic-like changes we used broadband measures, the results turned out in favor. However, what actually supported the hypothesis of underlying epileptic behavior was the visual identification of epileptiform discharges at right frontal regions in several patients from the OCD group.
Hyperactivity at the panic network was suggested by the high bzLORETA scores in the PD group. Dysrhythmic patterns were also frequent among these patients. The main difference from the OCD group was regarding the location, affecting the panic network in PD group. Several sEEG have reported dysrhythmic patterns in PD and intracranial EEGs have shown ictal discharges during panic attacks.Citation37–Citation39 Yet, the relationship with mesiotemporal epilepsy remains elusive,Citation95 not only because of the sEEG limitations addressed in the “Variables related to hyperactive neuronal populations” section, but also because of a relatively good initial response to SSRIsCitation8 in contrast to the provocative,Citation27,Citation96,Citation97 but not generalizable,Citation98 response to antiepileptics.
The SSRI response is no longer an argument against the hypothesis of hyperactive (epileptic-like) neuronal populations underlying some of the AD symptoms. On the contrary, the antiepileptic effect of serotonin has been shown in animal models,Citation99 and its precursor, tryptophan, is currently under study in humans.Citation100
Serotoninergic sensitization and subsequent kindling of the amygdala has been hypothesized as causal mechanism of illness progression in AD.Citation101 On the other end, modulation of the hyperactive neurons has been proposed as the mechanism of action of SSRIs in anxiety and epileptic models, and presumably also in epilepsy patients.Citation102 Accordingly, SSRIs could control anxiety symptoms even if caused by epileptic neuronal behavior. However, symptoms will reappear if the excessive discharge promotes the stage progression of amygdala kindling.
The conflicting reports on AD response to antiepileptics are difficult to evaluate because of methodological caveats. The presence or absence of cerebral dysrhythmias in potential responders has been ignored and few have addressed the mechanisms of action of the specific antiepileptic used. Nevertheless, some positive findings, together with the “unexplained” incremental trend in antiepileptic use in AD,Citation24 suggest the potential advantage of this type of treatment, at least for a subset of patients.
Animal models show several types of long-lasting anxiety-like behaviors induced by kindling amygdala circuits directly, through amygdalar stimulation,Citation100 or indirectly by chronic stress.Citation103 Not all kindled neurons result in clinical epilepsy, but the hyperactivity influences distally projecting zones, including other anxiety-related structures. The same process has been shown with intracranial recordings in humans,Citation104 with evidence of diffuse cortical instability in the sEEG and chronic anxiety as clinical manifestation. Anxiety has also been suggested as a biomarker of epileptogenicity.Citation105
The PD group had the lowest classification rates (59%). A possible explanation would be that the underlying dysfunction would only appear in the presence of triggering stimuli, not included in our recording paradigm. However, only three subjects were misclassified as CNTRL, suggesting that even in the absence of stimuli-triggered symptoms, atypical patterns were present in their records. The other misclassified subjects were assigned to the PD and GAD groups. It is also possible that by including social phobia and agoraphobia the group was more heterogeneous. Patients with agoraphobia might have features more similar to the PD group, while those with social phobia could be related to GAD. The number was too small to test for these irregularities.
While most patients showed WHDP decrease or WHBP increase, regardless of subtype, not all showed dysrhythmic and/or bzLORETA increases. This suggests that in some patients, cortical instability may occur in the absence of network hyperactivity. A combination of dysfunctional mechanisms may explain different response patterns to SSRIs across the AD spectrum,Citation24 as well as a marked improvement in some, but not all patients, by combining with antiepileptics.Citation95–Citation97
Potential applications and future research
Our findings suggest that neurophysiology can be used to identify ongoing dysfunctions, their relative weights and their interactive patterns on a moment-to-moment basis. Directly addressing ongoing dysfunctions should help in designing individual therapeutic strategies as well as developing dysfunction-targeted treatments. For example, good response to SSRIs alone may be expected if there is evidence of cortical instability only. Serotonin–dopamine modulators could be an alternative, if the DA-related ERPs are also affected. Dysrhythmic EEG with focal quantitative EEG changes may respond better to antiepileptics as adjunctive or stand-alone treatment, preferably those that are effective in the early phases of epileptogenesis.
Outlasting changes in networks behavior have been shown with psychotherapy.Citation106–Citation109 Understanding the dysfunctional patterns may accelerate functional restore. On the other hand, psychotherapy will always be necessary because, independently of the original cause and ongoing neuronal dysfunction, evidently the coping mechanisms of the AD patient are not working. Learning and holding on to more adaptive strategies should make the pharmacological response more successful and enduring.
Replication of these findings in wider, less biased samples of AD patients, and perhaps including question-related ERP paradigms may greatly enhance our understanding of physiopathogenic mechanisms. This, in turn will improve the design of therapeutic strategies. Treatment-response studies of neurophysiologically guided treatments are needed to build evidence-based guidelines.
Disclosure
The authors report no conflicts of interest in this work.
References
- RevickiDATraversKWyrwichKWHumanistic and economic burden of generalized anxiety disorder in North America and EuropeJ Affect Disord2012140210311222154706
- BystritskyAKhalsaSSCameronMESchiffmanJCurrent diagnosis and treatment of anxiety disordersP T2013381305723599668
- World Health OrganizationThe ICD 10 Classification of Mental and Behavioral Disorders: Clinical Description and Diagnostic GuidelinesGenevaWorld Health Organization1992
- American Psychiatric AssociationDiagnostic and Statistical Manual for Mental Disorders5th edWashington, DCAmerican Psychiatric Association Press2013
- LangPJDavisMOhmanAFear and anxiety: animal models and human cognitive psychophysiologyJ Affect Disord200061313715911163418
- HeilmanKMGilmoreRLCortical influences in emotionJ Clin Neurophysiol19981554094239821068
- VolleberghWAIedemaJBijlRVde GraafRSmitFOrmelJThe structure and stability of common mental disorders: the NEMESIS studyArch Gen Psychiatry200158659760311386990
- PettyFDavisLLKabelDKramerGLSerotonin dysfunction disorders: a behavioral neurochemistry perspectiveJ Clin Psychiatry199657Suppl 811168698675
- GormanJMKentJMSullivanGMCoplanJDNeuroanatomical hypothesis of panic disorder, revisedAm J Psychiatry2000157449350510739407
- DamsaCKoselMMoussallyJCurrent status of brain imaging in anxiety disordersCurr Opin Psychiatry20092219611019122541
- LangPJMcTeagueLMThe anxiety disorder spectrum: fear imagery, physiological reactivity, and differential diagnosisAnxiety Stress Coping200922152519096959
- McTeagueLMLangPJThe anxiety spectrum and the reflex physiology of defense: from circumscribed fear to broad distressDepress Anxiety201229426428122511362
- EtkinAFunctional neuroanatomy of anxiety: a neural circuit perspectiveCurr Top Behav Neurosci2010225127721309113
- ShinLMLiberzonIThe neurocircuitry of fear, stress, and anxiety disordersNeuropsychopharmacology201035116919119625997
- DuvalERJavanbakhtALiberzonINeural circuits in anxiety and stress disorders: a focused reviewTher Clin Risk Manag20151111512625670901
- ShuhamaRDel-BenCMLoureiroSRGraeffFGAnimal defense strategies and anxiety disordersAn Acad Bras Cienc20077919710917401479
- MenziesLChamberlainSRLairdARThelenSMSahakianBJBullmoreETIntegrating evidence from neuroimaging and neuropsychological studies of obsessive-compulsive disorder: the orbitofronto-striatal model revisitedNeurosci Biobehav Rev200832352554918061263
- BurguièreEMonteiroPMalletLFengGGraybielAMStriatal circuits, habits, and implications for obsessive-compulsive disorderCurr Opin Neurobiol201530596525241072
- EysenckMWDerakshanNSantosRCalvoMGAnxiety and cognitive performance: attentional control theoryEmotion20077233635317516812
- BerggrenNDerakshanNAttentional control deficits in trait anxiety: why you see them and why you don’tBiol Psychol201392344044622465045
- AbramovitchADarRMittelmanAWilhelmSComorbidity between attention deficit/hyperactivity disorder and obsessive-compulsive disorder across the lifespan: a systematic and critical reviewHarv Rev Psychiatry201523424526226052877
- PetersonAThomeJFrewenPLaniusRAResting-state neuroimaging studies: a new way of identifying differences and similarities among the anxiety disorders?Can J Psychiatry201459629430025007403
- McCarthyHSkokauskasNMulliganAAttention network hypoconnectivity with default and affective network hyperconnectivity in adults diagnosed with attention-deficit/hyperactivity disorder in childhoodJAMA Psychiatry201370121329133724132732
- RavindranLNSteinMBThe pharmacologic treatment of anxiety disorders: a review of progressJ Clin Psychiatry201071783985420667290
- HofmannSGAsnaaniAVonkIJSawyerATFangAThe efficacy of cognitive behavioral therapy: a review of meta-analysesCognit Ther Res2012365427440
- BaldwinDSRoom for improvement in the pharmacological treatment of anxiety disordersCurr Pharm Des200814333482349119075725
- MulaMPiniSCassanoGBThe role of anticonvulsant drugs in anxiety disorders: a critical review of the evidenceJ Clin Psychopharmacol200727326327217502773
- AndricMHassonUGlobal features of functional brain networks change with contextual disorderNeuroimage201511710311325988223
- HirshJBMarRAPetersonJBPsychological entropy: a framework for understanding uncertainty-related anxietyPsychol Rev2012119230432022250757
- BarlowDHUnraveling the mysteries of anxiety and its disorders from the perspective of emotion theoryAm Psychol200055111247126311280938
- McEwenBSGetzLLifetime experiences, the brain and personalized medicine: an integrative perspectiveMetabolism201362Suppl 1S20S2623009787
- von SteinASarntheinJDifferent frequencies for different scales of cortical integration: from local gamma to long range alpha/theta synchronizationInt J Psychophysiol200038330131311102669
- van DiessenENumanTvan DellenEOpportunities and methodological challenges in EEG and MEG resting state functional brain network researchClin Neurophysiol201512681468148125511636
- Lopes da SilvaFFunctional localization of brain sources using EEG and/or MEG data: volume conductor and source modelsMagn Reson Imaging200422101533153815707802
- WorrellGALagerlundTDSharbroughFWLocalization of the epileptic focus by low-resolution electromagnetic tomography in patients with a lesion demonstrated by MRIBrain Topogr200012427328210912735
- ShelleyBPTrimbleMRBoutrosNNElectroencephalographic cerebral dysrhythmic abnormalities in the trinity of nonepileptic general population, neuropsychiatric, and neurobehavioral disordersJ Neuropsychiatry Clin Neurosci200820172218305281
- DevinskyOSatoSTheodoreWHPorterRJFear episodes due to limbic seizures with normal ictal scalp EEG: a subdural electrographic studyJ Clin Psychiatry19895028302910836
- SazgarMCarlenPLWennbergRPanic attack semiology in right temporal lobe epilepsyEpileptic Disord200359310012875952
- GerezMSadaATelloAAmygdalar hyperactivity, a fear-related link between panic disorder and mesiotemporal epilepsyClin EEG Neurosci2011421293921309440
- BoulogneSCatenoixHRyvlinPRheimsSLong-lasting seizure-related anxiety in patients with temporal lobe epilepsy and comorbid psychiatric disordersEpileptic Disord201517334034426235301
- AmoCQuesneyLFOrtizTLimbic paroxysmal magnetoen-cephalographic activity in 12 obsessive-compulsive disorder patients: a new diagnostic findingJ Clin Psychiatry2004652154162
- KaplanPWObsessive-compulsive disorder in chronic epilepsyEpilepsy Behav201122342843221889913
- MelloniMUrbistondoCSedeñoLGelorminiCKichicRIbanezAThe extended fronto-striatal model of obsessive-compulsive disorder: convergence from event-related potentials, neuropsychology and neuroimagingFront Hum Neurosci2012625923015786
- ClarkCRGalletlyCAAshDJMooresKAPenroseRAMcFarlaneACEvidence-based medicine evaluation of electrophysiological studies of the anxiety disordersClin EEG Neurosci20094028411219534302
- American Psychiatric AssociationDiagnostic and Statistical Manual of Mental Disorders4th ed Text revisionWashington, DCAmerican Psychiatric Press2000
- BrownTADi NardoPABarlowDHAnxiety Disorder Interview Schedule for DSM-IVSan Antonio, TXPsychological Corporation1994
- JasperHHThe ten twenty electrode system of the International FederationElectroencephalogr Clin Neurophys195810371
- OnofrjMCGhilardiMFFulgenteTMapping of event-related potentials to auditory and visual odd-ball paradigmsElectroencephalogr Clin Neurophys Suppl199041183201
- SternJMEngelJJrAtlas of EEG PatternsPhiladelphia, PALippincott Williams and Wilkins2010
- BoutrosNEpileptiform discharges in psychiatric patients: a controversy in need of resurrectionClin EEG Neurosci200940423924419780345
- ThatcherRWValidity and reliability of quantitative electroencephalography (qEEG)J. Neurother201014122152
- Pascual-MarquiRDMichelCMLehmannDLow resolution brain electromagnetic tomography: a new method for localizing electrical activity in the brainInt J Psychophysiol19941849657876038
- GomezJFThatcherRWFrequency domain equivalence between potentials and currents using LORETAInt J Neurosci20011073–416117111328689
- ThatcherRWNorthDBiverCEvaluation and validity of a LORETA normative EEG databaseClin EEG Neurosci20053611612215999907
- ThatcherRWNorthDBiverCParametric vs non-parametric statistics of low resolution electromagnetic tomography (LORETA)Clin EEG Neurosci20053611815683191
- WrightJJRobinsonPARennieCJToward an integrated continuum model of cerebral dynamics: the cerebral rhythms, synchronous oscillation and cortical stabilityBiosystems2001631–3718811595331
- BaşarEBaşar-EroğluCGüntekinBYenerGGBrain’s alpha, beta, gamma, delta, and theta oscillations in neuropsychiatric diseases: proposal for biomarker strategiesSuppl Clin Neurophysiol201362195424053030
- SinghalADoerflingPFowlerBEffects of a dual task on the N100-P200 complex and the early and late Nd attention waveformsPsychophysiology200239223624512212674
- PogarellOPadbergFKarchSDopaminergic mechanisms of target detection – P300 event related potential and striatal dopaminePsychiatry Res2011194321221822104371
- KotchoubeyBEvent-related potentials, cognition, and behavior: a biological approachNeurosci Biobehav Rev2006301426516033699
- SellingLHypothalamic epilepsy and anxiety statesPortland Clin Bull19515151214843882
- AdamaszekMOlbrichSGallinatJThe diagnostic value of clinical EEG in detecting abnormal synchronicity in panic disorderClin EEG Neurosci201142316617421870468
- EngelJReport of the ILAE classification core groupEpilepsia20064791558156816981873
- DecoGJirsaVKRobinsonPABreakspearMFristonKThe dynamic brain: from spiking neurons to neural masses and cortical fieldsPLoS Comput Biol200848e100009218769680
- GloorPExperiential phenomena of temporal lobe epilepsy. Facts and hypothesesBrain19901136167316942276040
- Lopes da SilvaFFunctional localization of brain sources using EEG and/or MEG data: volume conductor and source modelsMagn Reson Imaging200422101533153815707802
- GrechRCassarTMuscatJCamilleriKPReview on solving the inverse problem in EEG source analysisJ Neuroeng Rehabil200852518990257
- MussoFBrinkmeyerJMobascherAWarbrickTWintererGSpontaneous brain activity and EEG microstates. A novel EEG/fMRI analysis approach to explore resting-state networksNeuroimage20105241149116120139014
- DecoGJirsaVKMcIntoshAREmerging concepts for the dynamical organization of resting-state activity in the brainNat Rev Neurosci2011121435621170073
- DarvasFPantazisDKucukaltun-YildirimELeahyRMMapping human brain function with MEG and EEG: methods and validationNeuroimage200423Suppl 1S289S29915501098
- HeBModeling and Imaging of Bioelectric Activity: Principles and ApplicationsNew YorkKluwer Academic/Plenum Publishers2004
- WoolgarABorDDuncanJGlobal increase in task-related frontoparietal activity after focal frontal lobe lesionJ Cogn Neurosci20132591542155223767925
- HughesJRTaberJEFinoJJThe effect of spikes and spike-free epochs on topographic brain mapsClin Electroencephalogr1991221501601879054
- RaichleMEMacLeodAMSnyderAZPowersWJGusnardDAShulmanGLA default mode of brain functionProc Natl Acad Sci U S A200198267668211209064
- HaysCStatistics3rd edNew York, NYCBS College Publishing1981
- PetersenSEPosnerMIThe attention system of the human brain: 20 years afterAnnu Rev Neurosci201235738922524787
- StockburgerDWDummy coding. Multivariate Statistics: Concepts, Models, and Applications Available from http://www.psychstat.missouristate.edu/multibook/mlt08m.htmlAccessed December 28, 2013
- LeeHKHBayesian Nonparametrics via Neural NetworksPhiladelphia, PASIAM2004
- GishHA probabilistic approach to the understanding and training of neural network classifiersProc IEEE Int Conf Acoustic, Speech, Signal ProcessingAlbuquerque, NMIEEE Press199013611364
- BrownDECorrubleVPittardCLA comparison of decision tree classifiers with backpropagation neural networks for multimodal classification problemsPattern Recognit199326953961
- EfronBTibshiraniRJBootstrap methods for standard errors, confidence intervals and other measures of statistical accuracyStat Sci198615477
- SaletuBGrünbergerJAndererPLinzmayerLSemlitschHVMagniGPharmacodynamics of venlafaxine evaluated by EEG brain mapping, psychometry and psychophysiologyBr J Clin Pharmacol19923365896011389931
- OrsucciFFThe paradigm of complexity in clinical neurocognitive scienceNeuroscientist200612539039716957001
- PhilippePMansiONonlinearity in the epidemiology of complex health and disease processesTheor Med Bioeth199819659160710051792
- Almeida FilhoNTowards a unified theory of health-disease: II. Holo-pathogenesisRev Saude Publica201448219220524897040
- JonesBEFrom waking to sleeping: neuronal and chemical substratesTrends Pharmacol Sci2005261157858616183137
- HarmonyTThe functional significance of delta oscillations in cognitive processingFront Integr Neurosci201378324367301
- Morillas-RomeroATortella-FeliuMBornasXPutmanPSpontaneous EEG theta/beta ratio and delta-beta coupling in relation to attentional network functioning and self-reported attentional controlCogn Affect Behav Neurosci201515359860625860658
- NakataniCRaffoneAvan LeeuwenCEfficiency of conscious access improves with coupling of slow and fast neural oscillationsJ Cogn Neurosci20142651168117924345169
- GriebelG5-Hydroxytryptamine-interacting drugs in animal models of anxiety disorders: more than 30 years of researchPharmacol Ther19956533193957644567
- NikolausSAntkeCBeuMMüllerHWCortical GABA, striatal dopamine and midbrain serotonin as the key players in compulsive and anxiety disorders – results from in vivo imaging studiesRev Neurosci201021211913920614802
- LowryCAJohnsonPLHay-SchmidtAMikkelsenJShekharAModulation of anxiety circuits by serotonergic systemsStress20058423324616423712
- PolichJUpdating P300: an integrative theory of P3a and P3bClin Neurophysiol2007118102128214817573239
- BeuckeJCSepulcreJTalukdarTAbnormally high degree connectivity of the orbitofrontal cortex in obsessive-compulsive disorderJAMA Psychiatry201370661962923740050
- PandeACPollackMHCrockattJPlacebo-controlled study of gabapentin treatment of panic disorderJ Clin Psychopharmacol20002046747110917408
- DavisLLRyanWAdinoffBPettyFComprehensive review of the psychiatric uses of valproateJ Clin Psychopahrmacol200020(1) Suppl 11S17S
- HoffmanEJMathewSJAnxiety disorders: a comprehensive review of pharmacotherapiesMt Sinai J Med200875324826218704983
- CitraroRScicchitanoFDe FazioSPreclinical activity profile of α-lactoalbumin, a whey protein rich in tryptophan, in rodent models of seizures and epilepsyEpilepsy Res2011951–2606921458955
- MainardiPLeonardiAAlbanoCPotentiation of brain serotonin activity may inhibit seizures, especially in drug-resistant epilepsyMed Hypotheses200870487687917826001
- AdamecRYoungBNeuroplasticity in specific limbic system circuits may mediate specific kindling induced changes in animal affect implications for understanding anxiety associated with epilepsyNeurosci Biobehav Rev200024770572310974353
- PostRMWeissSRSensitization and kindling phenomena in mood, anxiety, and obsessive-compulsive disorders: the role of serotonergic mechanisms in illness progressionBiol Psychiatry19984431932069693391
- HamidHKannerAMShould antidepressant drugs of the selective serotonin reuptake inhibitor family be tested as antiepileptic drugs?Epilepsy Behav201326326126523395350
- JonesNCO’BrienTJStress, epilepsy, and psychiatric comorbidity: how can animal models inform the clinic?Epilepsy Behav201326336336923099287
- Tebartz van ElstLKrishnamoorthyESSchulze-BonhageALocal area network inhibition: a model of a potentially important paraepileptic pathomechanism in neuropsychiatric disordersEpilepsy Behav201122223123921784710
- KannerAMMazaratiAKoeppMBiomarkers of epileptogenesis: psychiatric comorbidities (?)Neurotherapeutics201411235837224719199
- BeauregardMFunctional neuroimaging studies of the effects of psychotherapyDialogues Clin Neurosci2014161758124733972
- PortoPROliveiraLMariJVolchanEFigueiraIVenturaPDoes cognitive behavioral therapy change the brain? A systematic review of neuroimaging in anxiety disordersJ Neuropsychiatry Clin Neurosci200921211412519622682
- BarsagliniASartoriGBenettiSPettersson-YeoWMechelliAThe effects of psychotherapy on brain function: a systematic and critical reviewProg Neurobiol201411411424189360
- MessinaISambinMPalmieriAVivianiRNeural correlates of psychotherapy in anxiety and depression: a meta-analysisPLoS One201389e7465724040309