
Abstract
Background
Obsessive–compulsive disorder (OCD) is associated with cognitive dysfunction. Although there are several studies focused on the neurobiology of OCD, little is known about the biological correlates of the cognitive deficit linked to this disorder. The aim of our study was to examine the association between cognitive impairment and current source density markers in patients with OCD.
Methods
Resting-state eyes-closed electroencephalography (EEG) data were recorded in 20 patients with OCD and 15 healthy controls who were involved in the study. Cortical EEG sources were estimated by standardized low-resolution electromagnetic tomography in seven frequency bands: delta (1.5–6 Hz), theta (6.5–8 Hz), alpha-1 (8.5–10 Hz), alpha-2 (10.5–12 Hz), beta-1 (12.5–18 Hz), beta-2 (18.5–21 Hz), and beta-3 (21.5–30 Hz). Cognitive performance was measured by the Trail-Making Test (versions A and B), Stroop CW Test, and D2 Test.
Results
Frontal delta and theta EEG sources showed significantly higher activity in the whole group of patients with OCD (N=20) than in control subjects (N=15). Subsequent analysis revealed that this excess of low-frequency activity was present only in the subgroup of eleven patients with cognitive impairment (based on the performance in the Trail-Making Test – A). The subgroup of patients with normal cognitive functions (N=9) did not differ in cortical EEG sources from healthy controls.
Conclusion
The present results suggest that frontal low-frequency cortical sources of resting-state EEG rhythms can distinguish groups of cognitively impaired and cognitively intact patients with OCD. Based on our results, future studies should consider whether the present methodological approach provides clinically useful information for the revelation of cognitive impairment in patients with OCD.
Introduction
Obsessive–compulsive disorder (OCD) is a heritable neuropsychiatric disorder characterized by intrusive, disturbing thoughts that are described as the artifact of one’s mind and/or repetitive, compulsive behaviors or mental rituals. Systematic research over the past 3 decades has confirmed that OCD is associated with dysfunction of the cortico–striato–thalamo–cortical circuitry, predominantly in the orbitofrontal cortex (OFC), dorsolateral prefrontal cortex, and caudate nucleus.Citation1 A recent meta-analysis of neuroimaging studies in OCD confirms hypermetabolism in the OFC and caudate nucleus.Citation2 Neuroimaging studies advocate that the participation of a fronto-subcortical circuit, including the OFC and basal ganglia, in the expression of OCD is a core feature.Citation3 The integrity of this circuit is supposed to be explicitly linked to the executive cognitive functions, which are the higher-level mental processes that modulate sensory, motor, cognitive, memory, and affective capabilities.Citation4–Citation6 A variety of neuropsychological studies have detected dysfunctions in cognitive functions among patients with OCD.Citation5–Citation10 One of these functions, decision-making process, has been assumed to be an important key to understanding OCD.Citation5,Citation11,Citation12 Nakao et alCitation13 examined cognitive functions in 32 OCD patients. Their results showed that cognitive dysfunction may have an influence on the severity of symptoms as well.Citation13 Another factor that may be influenced by cognitive impairment is treatment response.
Several studies have focused on various quantitative electroencephalography (EEG) parameters in patients with OCD. The most consistent findings are topographic abnormalities observed in frontal and orbitofrontal areas.Citation14–Citation20 In contrast, there are apparent inconsistencies between these studies regarding the abnormalities of specific EEG frequency bands. Previous studies have shown both decreases and increases of low-frequency (delta and theta)Citation15,Citation16,Citation18,Citation20 as well as fast-frequency (alpha and beta)Citation15,Citation18–Citation20 activities.
The first aim of our study was to determine the types, frequency, and severity of cognitive deficits among patients with OCD. The second aim was to evaluate the difference in cortical EEG sources between the group of patients with OCD and healthy controls and its relation to the presence or absence of cognitive impairment.
Methods
Subjects
Twenty patients meeting International Classification of Diseases – 10th revision criteria for OCDCitation21 were included in the study. Participants were recruited from patients treated at the Department of Psychiatry, University Hospital Olomouc. The diagnosis was made by two independent psychiatrists and confirmed by the MINI-international neuropsychiatric interview.Citation22 Two patients suffered from comorbid anxiety disorders (generalized anxiety disorder and agoraphobia). Demographic and clinical data were gathered during the interview (). The severity of symptoms was measured by Yale-Brown Obsessive Compulsive Scale, Hamilton Anxiety Rating Scale, Hamilton Depression Rating Scale, Beck Depressed Inventory, and Beck Anxiety Inventory (). The level of cognitive dysfunction was measured by Trail-Making Test (versions A and B) (TMT-A and TMT-B). This test assesses executive functions, scanning, visual search, processing speed, and mental flexibility. TMT focuses on executive functions that are primarily associated with dysfunction in frontal and occipital areas.Citation23 It was proved to be a useful indicator of organic brain damage.Citation23 TMT-B is sensitive to abnormalities in frontal areas.Citation24 Attention and concentration were measured using Stroop CW Test and D2 Test.
Table 1 Demographical and clinical data
Table 2 Trail-Making Test – Reitan
Control subjects were recruited by advertisement. The control group was matched by age, sex, and education level. The probands in the control group did not use any drugs and did not suffer from any severe mental or physical disorder.
The investigation was carried out as per the latest version of the Declaration of Helsinki and the Guideline for Good Clinical Practice.Citation25 A written informed consent was obtained from all subjects after the nature of the procedures had been fully explained. The local Ethics Committee of University Hospital Olomouc approved this project.
EEG recording and sLORETA analysis
The EEG examination was carried out between 8 and 10 am on the Graphtek PL-Winsor 3.0 standard 21-channel digital EEG with 19 Ag/AgCl surface electrodes (Fp1, Fp2, F7, F3, Fz, F4, F8, T3, C3, Tz, C4, T4, T5, P3, Pz, P4, T6, O1, and O2) placed according to the international 10/20 system. The data sampling rate was 200 Hz, and the acquired signals were filtered with digital low- and high-pass filtering at 0.15 and 70 Hz, respectively. The EEG was recorded with the patients in a semi-recumbent position with eyes closed. Before data analysis, artifact detection was performed visually to remove all EEG segments containing obvious eye and head movements or muscle artifacts. Following the transformation to a standard reference, EEG activity for a minimum of 15 2-second epochs of artifact-free resting EEG was averaged to calculate cross-spectra in standardized low-resolution electromagnetic tomography (sLORETA) for seven non-overlapping frequency bands.Citation26 Using the sLORETA transformation matrix, cross-spectra of each subject and each frequency band were then transformed to sLORETA files. The computed sLORETA images reflect the cortical current density distribution in 6,239 voxels, with a spatial resolution of 5×5×5 mm.Citation27 Before EEG recording, there was at least a 24-hour washout period for benzodiazepine anxiolytics. The patients did not show either clinical or electroencephalographical signs of benzodiazepine dependence.
Statistical analyses
Statistical analysis of the results was carried out with the Prism statistical software (GraphPad PRISM version 5.0; http://www.graphpad.com/prism/prism.htm). For all statistical tests, the acceptable level of statistical significance was set at P<0.05. The localization of the differences in activity between the groups was assessed by voxel-by-voxel unpaired t-test of the sLORETA images, based on the power of estimated electric current density, which results in t-statistic three-dimensional images. In the resulting sLORETA images, cortical voxels manifesting statistically significant differences were identified by a nonparametric approach using a randomization strategy that determined the critical probability threshold values for the observed statistic with corrections for multiple testing.Citation28
Results
Demographic and clinical data
Twenty patients (five females) and 15 healthy controls (six females) participated in the study. The groups did not statistically differ in age, sex, education level, and marital status. As expected, statistically significant differences between the groups were observed in the anxiety and depression scales Hamilton Anxiety Rating Scale, Beck Anxiety Inventory, and Beck Depressed Inventory (). Fifteen patients were using antidepressants (mean defined daily dosage was 57.58 mg), three were using anxiolytics (mean defined daily dosage was 10 mg), and seven antipsychotics (mean defined daily dosage was 1.48 mg).
Cognitive impairment
Cognitive impairment was measured by TMT-A and TMT-B, Stroop CW Test, and D2 Test. Nineteen patients fulfilled the criteria for Stroop CW Test for patients with neurotic disorder. Only one patient showed worse results. Also, most patients showed good results in the D2 Test. There were only two results of concentration performance subtest below the 20th percentile. However, results of seven patients were higher than the 80th percentile. The mean time of TMT-A in patients was 42.95±18.62 seconds and TMT-B was 115.45±62.05 seconds. In healthy controls, the mean time of TMT-A was 25.07±8.34 seconds and TMT-B was 72.27±28.76 seconds. We used the Reitan’s normsCitation29 for adult population to divide the patients into two groups. In the first group, there were patients with no cognitive impairment (excellent or normal), and in the second group were patients with mild-to-severe impairment ().
sLORETA analysis – comparison to the control group
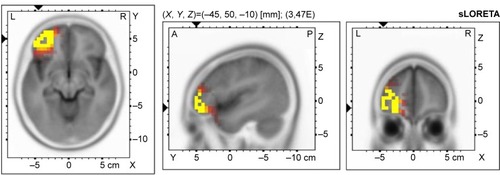
Compared to healthy controls, patients with OCD showed an increase of delta sources in superior, middle, inferior, precentral, orbital, and rectal frontal gyrus, frontal lobe sub-gyral area, superior and middle temporal gyrus, parahippocampal gyrus, extranuclear area, limbic cingulate gyrus anterior cingulate, and insula (). The highest t-value was located in medial frontal gyrus (Brodmann area 9). Moreover, we found an increase of theta sources in inferior, middle, and superior frontal gyrus in the left hemisphere. The highest t-value was located in middle frontal gyrus (Brodmann area 10) ().
Figure 1 Voxel-wise statistical nonparametric map of sLORETA images in all patients (N=20) compared to healthy controls at the 0.05 significance level after correction for multiple comparisons.
Abbreviations: sLORETA, standardized low-resolution electromagnetic tomography; L, left; R, right; A, anterior; P, posterior.
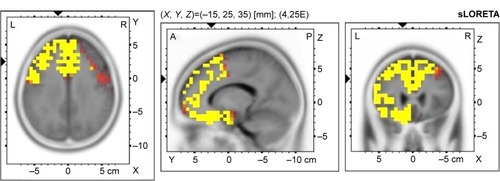
Figure 2 Voxel-wise statistical nonparametric map of sLORETA images in all patients (N=20) compared to healthy controls at the 0.05 significance level after correction for multiple comparisons.
Abbreviations: sLORETA, standardized low-resolution electromagnetic tomography; L, left; R, right; A, anterior; P, posterior.
sLORETA analysis – cognitive impairment
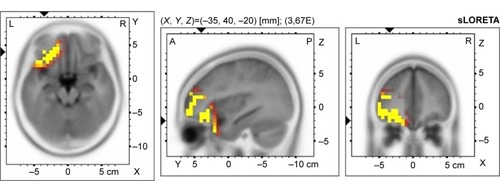
Patients with excellent or good performance in TMT-A showed no difference in EEG sources compared to healthy controls. In the group of patients with mild-to-severe cognitive impairment, we found the significant increase of delta and theta sources in different cortical regions ( and ). Statistically significant increase in delta sources was observed in superior, middle, and inferior frontal gyrus, frontal orbital, rectal, subcallosal, cingulate, and precentral gyrus, superior and middle temporal gyrus, uncus, insula, and anterior cingulate, and significant increase in theta sources was seen in superior, middle, inferior, and orbital frontal gyrus, and superior temporal gyrus. The highest t-value in delta source was located in the insula (Brodmann area 13). The maximum t-value in theta source was located in middle frontal gyrus (Brodmann area 11).
Figure 3 Voxel-wise statistical nonparametric map of sLORETA images in OCD patients with cognitive impairment (N=11) compared to healthy controls at the 0.05 significance level after correction for multiple comparisons.
Abbreviations: sLORETA, standardized low-resolution electromagnetic tomography; OCD, obsessive–compulsive disorder; L, left; R, right; A, anterior; P, posterior.
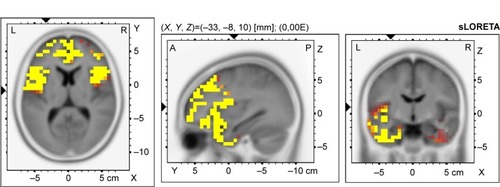
Figure 4 Voxel-wise statistical nonparametric map of sLORETA images in OCD patients with cognitive impairment (N=11) compared to healthy controls at the 0.05 significance level after correction for multiple comparisons.
Abbreviations: sLORETA, standardized low-resolution electromagnetic tomography; OCD, obsessive–compulsive disorder; L, left; R, right; A, anterior; P, posterior.
Discussion
Our study had two aims. The first one was to evaluate the presence of cognitive impairment in patients with OCD. We used three tests (TMT-A and TMT-B, Stroop CW Test, and D2 Test). In the second part of the study, we compared the cortical EEG sources between patients with OCD and healthy controls. In the last step, we tried to find the association between EEG signal and cognitive performance.
The patients showed good results in both Stroop CW Test and D2 Test. This finding was in agreement with studiesCitation8,Citation9 that also showed good performance in these tests. Cognitive impairment was found only when using TMT (versions A and B). This was also in agreement with other studies.Citation8–Citation10 This test focuses mostly on executive function; thus, D2 Test and Stroop CW Test were used to examine attention and concentration.
We found an increase of delta and theta sources in frontal areas in patients with OCD compared to healthy controls. This increase was present only in patients with cognitive impairment measured by TMT-A. We replicated finding of other authors who also found an increase in delta and theta activities in frontal areas.Citation15,Citation16,Citation18,Citation20 Abnormalities in frontal brain areas in patients with OCD were found in functional magnetic resonance imaging studies.Citation30–Citation32 Theta activity is assumed to depend on current behavior, and to be present during rapid eye movement sleep, and hippocampus regulates information transmission. Working memory and mental effort are mostly associated with theta band.Citation33 Also, delta oscillation correlates with cognitive functions. Its relation to signal detection and decision making was hypothesized.Citation34
The presence of low frequencies in frontal areas is not specific only to patients with OCD. Impaired low-frequency bands were also found in patients with schizophrenia,Citation35,Citation36 depression,Citation37,Citation38 and social phobia.Citation39 There is also an association between the presence of delta source in frontal areas and cognitive impairment in patients with Alzheimer’s disease and mild cognitive impairment (measured by Mini-mental state examination).Citation40
In our study, we found frontal EEG abnormalities in patients whose performance was poor in TMT-A but not in TMT-B. This inconsistency may be explained by focusing on the different cognitive domains. TMT-A assesses information processing, attention, visual scanning, and eye–hand coordination. TMT-B focuses on working memory and executive functions.
Groups differed in severity of OCD, but this variance could not explain the differences in EEG signals. The presence of clinical symptoms in patients with OCD was not associated with the presence of low-frequency activity.Citation19 The analysis did show statistically significant correlation between results of TMT-A and Yale-Brown Obsessive Compulsive Scale score; there was only a trend (P=0.093).
Patients were treated by various medications. We excluded patients using drugs that potentially influence EEG signal. Benzodiazepines were discontinued at least 24 hours before EEG monitoring. We made a post hoc analysis of doses of antidepressants and results of TMT-A and TMT-B and did not find any correlation between doses of drugs and score in TMT (unpaired t-test, t=0.1916, df=13, ns). We found that medication did not play a role both in our EEG findings and in performance in TMT.
Nevertheless, the EEG difference appeared when comparing patients group versus controls; many patients had normal EEG records. However, for those who displayed impaired attention, information processing, visual scanning, and eye–hand coordination, the signal was different. If symptoms do not correlate with the severity of cognitive dysfunctions, it could mean that the specific EEG findings are linked to the cognitive deficit. So far, it is not clear whether this cognitive deficit and EEG changes could play a role in therapy. There is only one study examining the influence of cognitive impairment on the outcome of cognitive behavioral therapy yet.Citation41 In this study, memory and executive functions did not predict the response to cognitive behavioral therapy. Thus, it was a small study of only 39 patients, and this finding was not yet replicated. Up to our opinion, further research is needed. It is suggested that special cognitive behavioral therapy techniques for this group of patients may be developed.
The study has several limitations. The number of participants was relatively small, it was a cross-sectional study, patients were not drug-naive, and they were also treated with various medications.
Conclusion
Our study confirmed poor results in neurocognitive test focused on executive functions and good performance in attention and concentration tests. The results of our study suggested that frontal low-frequency cortical sources of resting-state EEG rhythms can potentially distinguish groups of cognitively impaired and cognitively intact patients with OCD. Our study confirmed previous findings of impaired low-frequency activities in frontal areas in patients with OCD. We also found that these changes were present only in patients with cognitive impairment measured by TMT-A. Based on our results, future studies should consider whether the present methodological approach provides clinically useful information for the revelation of cognitive impairment in patients with OCD.
Acknowledgments
This study was supported by IGA_LF_2014_029.
Disclosure
The authors report no conflicts of interest in this work.
References
- SaxenaSRauchSLFunctional neuroimaging and the neuroanatomy of obsessive–compulsive disorderPsychiatr Clin North Am20002356358410986728
- NakaoTOkadaKKanbaSNeurobiological model of obsessive-compulsive disorder: evidence from recent neuropsychological and neuroimaging findingsPsychiatry Clin Neurosci20146858760524762196
- StrobelADreisbachGMüllerJGoschkeTBrockeBLeschKPGenetic variation of serotonin function and cognitive controlJ Cogn Neurosci2007191923193117892388
- BecharaANeurobiology of decision-making: risk and rewardSemin Clin Neuropsychiatry2001620521611447572
- CavediniPGoriniABellodiLUnderstanding obsessive–compulsive disorder: focus on decision makingNeuropsychol Rev20061631516708289
- YücelMHarrisonBJWoodSJFunctional and biochemical alterations of the medial frontal cortex in obsessive–compulsive disorderArch Gen Psychiatry20076494695517679639
- MenziesLAchardSChamberlainSRNeurocognitive endopheno-types of obsessive–compulsive disorderBrain20071303223323617855376
- KimMSJangKMKimBNThe neuropsychological profile of a subclinical obsessive-compulsive sampleJ Int Neuropsychol Soc200915228629019203429
- MoritzSBirknerCKlossMExecutive functioning in obsessive-compulsive disorder, unipolar depression, and schizophreniaArch Clin Neuropsychol200217547748314592001
- PenadésRCatalánRAndrésSSalameroMGastóCExecutive function and nonverbal memory in obsessive-compulsive disorderPsychiatry Res20051331819015698680
- LawrenceNSWoodersonSMataix-ColsDDavidRSpeckensAPhillipsMLDecision making and set shifting impairments are associated with distinct symptom dimensions in obsessive–compulsive disorderNeuropsychology20062040941916846259
- SachdevPSMalhiGSObsessive–compulsive behaviour: a disorder of decision-makingAust N Z J Psychiatry20053975776316168033
- NakaoTNakataniENabeyamaMYoshiokaKTomitaMNakagawaADuration effect on neuropsychological function and treatment response of OCDSeishin Shinkeigaku Zasshi20051071286129816509426
- IschebeckMEndrassTSimonDKathmannNAltered frontal EEG asymmetry in obsessive-compulsive disorderPsychophysiology20145159660124673721
- KaradagFOguzhanogluNKKurtTOguzhanogluAAteşciFOzdelOQuantitative EEG analysis in obsessive compulsive disorderInt J Neurosci200311383384712775347
- KopřivováJCongedoMHoráčekJEEG source analysis in obsessive-compulsive disorderClin Neurophysiol20111221735174321354363
- KopřivováJHoráčekJRaszkaMBrunovskýMPraškoJStandardized low-resolution electromagnetic tomography in obsessive-compulsive disorder – a replication studyNeurosci Lett201354818518923701862
- PogarellOJuckelGMavrogiorgouPSymptom-specific EEG power correlations in patients with obsessive-compulsive disorderInt J Psychophysiol200662879216554100
- SherlinLCongedoMObsessive-compulsive dimension localized using low-resolution brain electromagnetic tomography (LORETA)Neurosci Lett2005387727416061322
- VelikovaSLocatelliMInsaccoCSmeraldiEComiGLeocaniLDysfunctional brain circuitry in obsessive-compulsive disorder: source and coherence analysis of EEG rhythmsNeuroimage20104897798319683062
- World Health OrganisationICD-10: The ICD-10 Classification of Mental and Behavioural Disorders: Clinical Descriptions and Diagnostic GuidelinesGenevaWord Health Organisation1992
- LecrubierYSheehanDVWeillerEThe MINI-international neuropsychiatric interview (M.I.N.I.): a short diagnostic structured interview: reliability and validity according to the CIDIEur Psychiatry199712224231
- WenSLChengMFChengMHYueJHLiJFXieLJNeurocognitive dysfunction and regional cerebral blood flow in medically naïve patients with obsessive-compulsive disorderDev Neuropsychol201439375024405183
- ReitanRMValidity of the Trail Making Test as an indicator of organic brain damagePercept Mot Skills19588271276
- EMEA2002Guideline for good clinical practiceLondonEMEA2002 Available from: http://www.edctp.org/fileadmin/documents/EMEA_ICH-GCP_Guidelines_July_2002.pdfAccessed March 20, 2009
- KubickiSHerrmannWMFichteKFreundGReflections on the topics: EEG frequency bands and regulation of vigilancePharmakopsychiatr Neuropsychopharmakol197912237245223177
- Pascual-MarquiRDStandardized low-resolution brain electromagnetic tomography (sLORETA): technical detailsMethods Find Exp Clin Pharmacol20022451212575463
- HolmesAPBlairRCWatsonJDFordINonparametric analysis of statistic images from functional mapping experimentsJ Cereb Blood Flow Metab1996167228530558
- ReitanRMTrail Making Test: Manual for Administration and ScoringTucson, AZReitan Neuropsychology Laboratory1992
- BeuckeJCSepulcreJEldaiefMCSeboldMKathmannNKaufmannCDefault mode network subsystem alterations in obsessive-compulsive disorderBr J Psychiatry2014205537638225257066
- HouJSongLZhangWMorphologic and functional connectivity alterations of corticostriatal and default mode network in treatment-naïve patients with obsessive-compulsive disorderPLoS One20138e8393124358320
- NakamaeTSakaiYAbeYAltered fronto-striatal fiber topography and connectivity in obsessive-compulsive disorderPLoS One20149e11207525375933
- BuzsakiGTheta oscillations in the hippocampusNeuron20023332534011832222
- Başar-EroğluCBaşarEDemiralpTSchürmannMP300-response: possible psychophysiological correlates in delta and theta frequency channels: a reviewInt J Psychophysiol1992131611791399755
- LavoieSSchaferMRWhitfordTJFrontal delta power associated with negative symptoms in ultra-high risk individuals who transitioned to psychosisSchizophr Res201213820621122520856
- SponheimSRClementzBAIaconoWGBeiserMClinical and biological concomitants of resting state EEG power abnormalities in schizophreniaBiol Psychiatry2000481088109711094142
- LeuchterAFCookIAHunterAMCaiCHorvathSResting-state quantitative electroencephalography reveals increased neurophysiological connectivity in depressionPLoS One20127e3250822384265
- MeerwijkELFordJMWeissSJResting-state EEG delta power is associated with psychological pain in adults with a history of depressionBiol Psychol201510510611425600291
- SachsGAndererPDantendorferKSaletuBEEG mapping in patients with social phobiaPsychiatry Res200413123724715465293
- BabiloniCFrisoniGSteriadeMFrontal white matter volume and delta EEG sources negatively correlate in awake subjects with mild cognitive impairment and Alzheimer’s diseaseClin Neurophysiol20061171113112916564740
- VandborgSKHartmannTBBennedsenBEPedersenADThomsenPHCan memory and executive functions in patients with obsessive-compulsive disorder predict outcome of cognitive behavioural therapy?Nord J Psychiatry2015217