
 ?Mathematical formulae have been encoded as MathML and are displayed in this HTML version using MathJax in order to improve their display. Uncheck the box to turn MathJax off. This feature requires Javascript. Click on a formula to zoom.
Abstract
Durable superhydrophobic coatings were synthesized using a system of silica nanoparticles (NPs) to provide nanoscale roughness, fluorosilane to give hydrophobic chemistry, and three different polymer binders: urethane acrylate, ethyl 2-cyanoacrylate, and epoxy. Coatings composed of different binders incorporating NPs in various concentrations exhibited different superhydrophobic attributes when applied on polycarbonate (PC) and glass substrates and as a function of coating composition. It was found that the substrate surface characteristics and wettability affected the superhydrophobic characteristics of the coatings. Interfacial tension and spreading coefficient parameters (thermodynamics) of the coating components were used to predict the localization of the NPs for the different binders’ concentrations. The thermodynamic analysis of the NPs localization was in good agreement with the experimental observations. On the basis of the thermodynamic analysis and the experimental scanning electron microscopy, X-ray photoelectron spectroscopy, profilometry, and atomic force microscopy results, it was concluded that localization of the NPs on the surface was critical to provide the necessary roughness and resulting superhydrophobicity. The durability evaluated by tape testing of the epoxy formulations was the best on both glass and PC. Several coating compositions retained their superhydrophobicity after the tape test. In summary, it was concluded that thermodynamic analysis is a powerful tool to predict the roughness of the coating due to the location of NPs on the surface, and hence can be used in the design of superhydrophobic coatings.
Introduction
Superhydrophobic surfaces have been studied for a variety of applications, such as self-cleaning,Citation1,Citation2 anticorrosion,Citation3 antipollution,Citation4 oil/water separation,Citation5,Citation6 self-healing,Citation7 anti-fouling,Citation8 and ice repellant surfaces.Citation7,Citation9–Citation12 Superhydrophobic surfaces have static contact angles >150° and sliding angles <10°, allowing easy rolling of water droplets along the surface.
The two key parameters for superhydrophobicity include hydrophobic chemistry and a nano/micro-hierarchical surface structure. Hydrophobic chemistry can be imparted by different low surface energy materials, such as fluorinated and long alkyl chain compounds.Citation13 A self-assembled monolayer of alkyltrichlorosilane (ATS) was shown to modify the surface energy of W18O49 nanowire substrates by changing the carbon length of ATS. Results showed an increase in contact angle with increasing the number of carbons in ATS.Citation14 The wettability of a zinc oxide nanowire array was monotonically changed from hydrophilic to hydrophobic by increasing the carbon chain length of a chemisorbed fatty acid (FA).Citation15 A self-assembling film of fatty acids with different carbon chain lengths on hydroxyapatite discs surfaces showed that contact angles increased significantly with increases in the FA carbon chain length.Citation16 Additionally, a hierarchical structure composed of nanoscale texture on microscale texture is needed to obtain superhydrophobic characteristics. The rough structure can support a liquid droplet, in the Cassie–Baxter state, and display high contact angles as air is trapped between the rough asperities. Such roughness may also provide lower sliding angles as the small contact area leads to reduced drop pinning (lower resistance to droplet movement). Roughness can reduce the apparent surface free energy (SFE) of the superhydrophobic surface due to the reduced contact area between the liquid drop and the surface.Citation17 This roughness can enhance the ability of superhydrophobic surfaces to repel low surface tension liquids, such as oils.
In order to prepare superhydrophobic surfaces, a variety of materials and techniques have been used including top-down methods, such as lithographyCitation18–Citation21 and plasma etching,Citation22 and bottom-up methods using different nanoparticles (NPs), such as silica,Citation23–Citation25 silica/polyhedral oligomeric silsesquioxane,Citation26 functionalized aluminum oxide NPs,Citation27,Citation28 titania,Citation29,Citation30 carbon nanotubes,Citation31–Citation34 ZnO particles,Citation8,Citation35–Citation37 and silanized calcium carbonate.Citation38–Citation41 Regardless of the technique or the substrates used, each method provided micro/nanometer features for roughness and a low surface energy chemistry.
Although superhydrophobic surfaces have been studied previously, their applications are limited due to their high production costs and low abrasion resistance.Citation26,Citation30 A particularly attractive approach is a coating, which can be applied to a wide variety of surfaces. It should be mentioned that, in many studies, the coatings are limited to specific substrates due to the specific composition and/or preparation techniques involved.Citation42–Citation48 The interactions between the surface/substrate and the coating as well as between the binder/NPs affect the structure of the coating and any resultant hierarchical structure needed to create superhydrophobicity in addition to the coatings’ durability. Thus, a fundamental study of these parameters is necessary to understand the effect of the substrate and coating properties for preparing new coatings on a wide array of substrates in the future.
Another key attribute is durability, such that the surface retains its superhydrophobic characteristics, despite abrasion or wear. A previous studyCitation22 indicated that a stable superhydrophobic urethane acrylate (UA) coating was obtained using silica NPs of various diameters grafted with photoreactive benzophenone groups and methylated fumed silica NPs with a fluorosilane top layer. The coatings showed good abrasion resistance under air flow and good durability in accelerated weathering conditions. Consequently, this work is aimed at investigating the thermodynamics of the system based on the interfacial tension and spreading coefficient parameters. Hence, the effects of binder type, binder concentration, and substrate wetting properties on the coating properties and morphology were studied. Two substrates, polycarbonate (PC; hydrophobic) and glass (hydrophilic), coated with a variety of formulations incorporating hydrophobic silica NPs dispersed in three different binders, ethyl cyanoacrylate (ECA), epoxy, and urethane acrylate (UA), were studied for the formation of superhydrophobic coatings having good durability. In the present case where low viscosity binders have been used, the mixing and coating processes are thermodynamically driven and kinetics do not play a role in the thermodynamics that lead to localization of the NPs.
Methods
Three different binders and five different binders to silica ratios were studied. Each formulation was spin coated on glass and PC, respectively. A total of 30 formulations were investigated. The thermodynamics analysis was composed of several steps. In the first step, the surface tension of neat and diluted uncured binders was calculated to analyze the solvent effect on the surface tension. In the second step, the effect of the dispersed NPs on the interfacial tension between the dissolved binders and the dispersed NPs was analyzed using two different methods. In the third step, the interfacial tensions were used to calculate the spreading coefficients in the mixing stage to analyze the mixing process of the dissolved binders and dispersed NPs. In the fourth step, the spreading coefficient in the coating step was studied to determine the final localization of the NPs. Finally, the substrates’ wetting by the binder was addressed by comparing the interfacial tension between the solvent and substrate and the interfacial tension between the diluted uncured binders and the substrate. To support the thermodynamic analysis, the topography of all the 30 coatings was studied using scanning electron microscopy (SEM). Finally, the wetting characteristics of the cured solid samples were studied using contact angle and sliding angle measurements. Since superhydrophobicity is obtained by low surface energy (attributed to chemistry and roughness), the SFEs of the coatings were compared to the neat cured binders. In the last stage of the study, durability was evaluated using a tape test.
Materials and methods
Fumed silica NPs (CAB-O-SIL® TS-720; Cabot Corporation, Billerica, MA, USA) were used throughout the study. The particles were mixed with a fluoroalkylsilane (FAS) (Dynasylan® F8263; Evonik, Essen, Germany) in isopropyl alcohol (IPA). The fluoroalkyl functionality provides low surface energy. The average particle (aggregate) diameter was 0.2–0.3 µm.
Three binders were used: ECA resin (Loctite® Super Glue; Henkel Corporation, Seabrook, NH, USA), a two component epoxy (EPO-TEK® 301; Epoxy Technologies, Billerica, MA, USA), and a one-part ultraviolet (UV) curing UA resin (NOA 61; Norland Products Incorporated, Cranbury, NJ, USA). The carrier solvent for the coating was acetone (Sigma Aldrich, St Louis, MO, USA). The physical properties of the binders obtained from their safety data sheets are shown in .
Table 1 Physical properties of the binders
The silica NPs (constant concentration of 2.5 wt%) were dispersed in the fluoroalkylsilane solution (in IPA) and stirred at room temperature for 10 minutes. Each binder was dissolved in acetone and stirred for 10 minutes at room temperature. Then, the two solutions were mixed together and stirred for another 10 minutes. For each formulation, the binder concentration ranged from 5 to 25 wt%. A total of 15 formulations were prepared.
Coating preparation
Glass microscope slides and PC sheet cut to 2.54 cm × 2.54 cm squares served as substrates for the coating. The substrates were rinsed with ethanol and dried under air pressure. One milliliter of solution was spin coated on the substrate at 1250 rpm for 1 minute. ECA and epoxy formulations were cured at 110°C for 2 hours. UA was cured under UV radiation for 2 minutes. A medium pressure mercury lamp (Heraeus Noblelight America LLC; Heraus, Gaithersburg, MD, USA) with a 365 nm wavelength at 100% intensity was used for the UV curing.
Characterization
The contact angle (CA) was measured according to the sessile drop method using a commercial video-based, software-controlled, contact angle analyzer (DSA 100; KRUSS GmbH, Hamburg, Germany). Deionized water was used for the measurements. The sliding angle was measured using a tilting unit incorporated into the contact angle analyzer. A drop was first deposited on the horizontal substrate and after equilibrium the substrate plane was tilted until the onset of drop motion. Both contact and sliding angles were measured using a 5 µL water drop. The surface tension of the diluted binders and dispersed silica NPs were calculated using the pendant drop method. The surface tension of the hanging liquid drop in air was determined using the Young–Laplace method taking into consideration the characteristic drop shape under the influence of gravity. The SFEs of the superhydrophobic surfaces were determined using Zisman’s method,Citation49 which determines the critical surface tension (γc). To obtain the γc value, the contact angles of nonpolar liquids having progressively smaller surface tensions were measured. In the current work, diiodomethane, n-hexadecane, and n-octane with surface tensions of 50.8, 27.47, and 21.62 mN/m (from DSA-100 software database), respectively, were used. The surface tensions of these liquids were correlated with the contact angles (cosine of the angle), yielding approximately straight lines. Extrapolation to cosθ=1 yielded the value of γc. Combining Young’s Equation for the contact angle and Zisman’s method lead to the relationship between γc and γs – the surface tension of the surface, as follows:
(1) where b is the tangent of the γc measurements.
For superhydrophobic surfaces with very low SFE (insignificant polar interactions), Zisman’s method is commonly used because only dispersion interactions are considered. For the neat binders and the PC substrate, which have polar contributions, the SFE was measured using the Lifshitz–van der Waals/acid–base (LW/AB) method. In the LW/AB method, the SFE is assumed to be composed of two main contributions, a nonpolar component
and acid–base component
, where the acid–base component is, in turn, composed of electron donor
and electron acceptor
components. The total SFE is given by
(2)
To obtain
,
, and
values for a solid, it is necessary to measure the contact angles of three different liquids of which at least two must be polar. In the present work, water and formamide (Thermo Fisher Scientific, Waltham, MA, USA) were used as the polar liquids and diiodomethane was the nonpolar liquid.
The interfacial tension between the different components in the solution state was calculated using two methods, Antonoff’s rule for immiscible systems:
(3) and the Girifalco and Good methodCitation50 for miscible systems:
(4) where γA and γB are the interfacial tension of the binder (neat or diluted) and the dispersed NPs, respectively. The molar volume (φ) is given by
(5) where Va is the molar volume of component A and Vb is the molar volume of component B. The Girifalco and Good method is valid for substances interacting with dispersive forces. In the present system based on hydrophobic chemistry, polar interactions are insignificant.
The spreading coefficient (SAB) that determines whether liquid B will spread on liquid A or solid A was calculated using
(6) When SAB>0, spontaneous spreading will occur, leading to a reduction in the SFE; however, when SAB<0, no or partial spreading will occur.
SEM was used to investigate the surface morphology. An field emission SEM (FESEM) (JEOL JSM 7401F) at 10 kV accelerating voltage was employed for this work. Prior to imaging, all substrates were sputtered with gold for 180 seconds (Leica SCD500).
X-ray photoelectron spectrometry (XPS) was used for chemical analysis (VG Scientific ESCALAB MKII). XPS provides information regarding the chemical composition in the top few atomic layers (down to 100Å).
The adhesion of the coatings to the substrates was determined using the tape test (ASTM D3359). A sharp razor blade was used to create 1 mm2 cuts through the coating to the substrate. The center of the tape was placed over the coating and adhered under the pressure of a pencil eraser to ensure good contact of the tape. Then, the tape was removed rapidly as close as possible to180°.
Results and discussion
Thermodynamic analysis
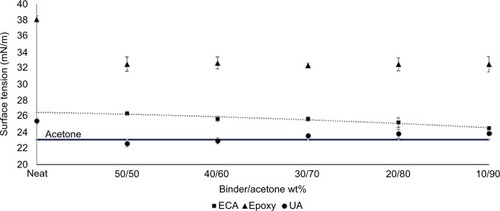
For this study, hydrophobic silica NPs and three low-molecular-weight binders ECA, epoxy, and UA were used. As the presence of the NPs on the surface is critical to obtain nanoscale roughness and thus superhydrophobic surfaces, the thermodynamics in the liquid state of the different formulations was investigated to explain the localization of the NPs in different binder formulations. In an ideal emulsion having low molecular weight and hence low viscosity, the localization at equilibrium of the silica particles is governed by thermodynamics, as kinetic effects do not play a significant role.Citation51,Citation52 Thus, in this system (dispersed NPs in diluted binders) the localization of the NPs will be thermodynamically driven to its lowest energy state. Consequently, provided that an interaction between the dispersed NPs in diluted binder will reduce the total free energy of the system, better spreading will be achieved and favor the location of the NPs in the binder phase. If the interaction between the dispersed NPs in diluted binder will increase the total free energy of the system, spreading will not occur and will favor the location of the NPs on the binder surface. To investigate the localization of the NPs as a result of spreading considerations, the surface tensions of the neat and diluted binders (uncured) were measured using the pendant drop method and are shown in and S1. In the case of neat ECA, the surface tension was difficult to measure due to its rapid polymerization in humidity, and thus, was assumed to be 26.67 mN/m using the trend line extrapolation (Table S1).
The results in Table S1 indicate that the surface tensions of the diluted binders are lower compared to the neat ones. No significant change in surface tension, however, was observed with increasing acetone concentration from 50 to 90 wt%.
Addition of the dispersed NPs into the diluted binders is a critical step to insure good mixing and compatibility between the NPs and the binder. If the addition is thermodynamically favored, then NPs will be mixed spontaneously; however, if mixing is not thermodynamically favored, then NPs will not distribute well and remain on the surface of the binder. In this system (containing a binder polymer, NPs, and two solvents), the interfacial tension (γAB) between the dissolved or neat binders (γA) and the dispersed NPs (γB) was calculated and compared using both Antonoff’s rule (immiscible system) and the Girifalco and Good method (miscible system with dispersion attraction). The results are shown in . The average surface tension for the dispersed NPs in IPA was 21.45 mN/m using the pendant drop measurement.
Table 2 Interfacial tensions calculated using Antonoff and Girifalco and Good methods for binders and dispersed NPs
Both Antonoff’s rule and the Girifalco and Good method showed a decrease in interfacial tension (IFT) for the diluted binder as compared to the neat binder. However, the Girifalco and Good method exhibited lower interfacial tension values compared to Antonoff’s rule, probably because acetone and IPA are miscible with each other. Comparison of the interfacial tension between the different binders showed that UA system exhibited the lowest interfacial tension values, whereas epoxy possessed the highest interfacial tension values. The interfacial tension values, however, do not reflect the full energy balance of the system. If the system (binder and solvent) is at a high free energy state (high surface tension) and the addition of a second component will decrease the total free energy of the system, it will favor spontaneous spreading. In contrast, if the system (binder and solvent) is at low free energy state (low surface tension), and the addition of second component will increase the total free energy of the system, the addition of the second component is not favored. To quantify the spreading phenomenon, the spreading coefficient parameters were determined. Accordingly, if the surface tension of component A is greater than the sum of surface tension of component B and interfacial tension AB, then the spreading coefficient is positive and the total free energy will be reduced, resulting in spontaneous spreading. If the surface tension of component A is lower than the sum of surface tension of component B and interfacial tension AB, then spreading is negative since the total free energy of the system is increased and partial or no spreading will occur. A zero spreading coefficient means that the total free energy of the system before and after adding component B has not changed and spreading will occur provided continuous mixing is used.
As mentioned earlier, since complete wetting between the dispersed NPs and the diluted binders is important, the spreading coefficient during the mixing stage should be positive to allow spontaneous spreading and good mixing of the system. The spreading coefficient using Antonoff’s rule was zero for NPs containing formulations, which indicated that these systems are not immiscible. Thus, the calculated spreading coefficients were based on the Girifalco and Good method and are shown in .
Table 3 Spreading coefficients for neat and diluted binders with dispersed NPs in IPA
All formulations showed positive spreading coefficients; epoxy, however, showed significantly higher values compared to UA and ECA. The spreading coefficient decreased with increasing acetone (binder solvent) wt%. The more positive the spreading coefficient value the greater the tendency for spontaneous spreading of NPs dispersed in IPA will occur in the binder. This behavior would suggest good wetting between the binder solution and the dispersed NPs and favor the localization of the NPs in the binder phase, which is an important stage before the coating process. Partial or no spreading in the mixing stage can affect the NPs localization in the final coating process.
Finally, the thermodynamics of the coating step was studied. During the coating process, the diluted formulations were spin coated on the substrate while acetone (binder solvent) and IPA (NPs carrier solvent) flowed to the surface and evaporated. As acetone has a higher evaporation rate compared to IPA (5.6 and 1.5,Citation53 respectively), it will evaporate first and IPA will complete evaporation last. This dynamic process is critical for determining the final localization of the NPs. During IPA evaporation the specific binder can either spread on the NPs or not. If the spreading will result in a reduction of the total free energy, then the spreading coefficient will be positive, and NPs are expected to be located within the binder phase. If the spreading, however, results in an increase in the total free energy, then the spreading coefficient will be negative, and NPs are expected to be located on the surface. In order to calculate the interfacial tension between the binders and the solid NPs a special experimental step was used. Accordingly, glass slides were coated with the dispersed NPs in IPA and heated for 1 hour to ensure complete evaporation of IPA. Then, contact angles were measured between the NP-coated surface (γs) and neat binders (γL). The interfacial tension was calculated using Young’s equation. The results are summarized in . The SFE of the solid NPs was taken as 22.4 mN/m (discussed later).
Table 4 Spreading coefficient for neat binders and solid NPs
The results in demonstrate that all the binders have negative spreading coefficients. The spreading coefficient between ECA and NPs was extremely low and indicates that the NP will be localized on the surface for the ECA/NP system. This results in the formation of superhydrophobicity if the “right” roughness is obtained. For UA and epoxy the spreading coefficients were moderately negative however could reach zero if energy, such as heat (for curing), is supplied. These results predict the NPs localization inside the binder and loss of the nanoroughness, which is needed for superhydrophobicity. Hence, we would expect that only the ECA system could produce a superhydrophobic coating. It should be emphasized that the binder loading, in addition to the wetting of the substrate, will affect the final coating behavior and ultimate superhydrophobicity due to the development of the specific surface morphology. To study the effect of binder loading, different binder wts% ranging from 5 to 25 were formulated. All formulations were spin coated on glass (hydrophilic) and PC (hydrophobic) substrates to understand the effect of substrate wetting behavior on superhydrophobicity. SEM was used to study the coatings’ topographies with different binder wt% on two different substrates (–).
Figure 1 SEM of surface morphology with increasing ECA wt% on two different substrates.
Abbreviations: ECA, ethyl cyanoacrylate; PC, polycarbonate; SEM, scanning electron microscopy; SH, superhydrophobic.
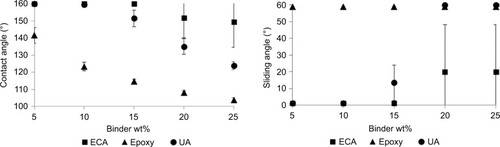
Figure 2 Scanning electron microscopy of surface morphology with increasing epoxy wt% on two different substrates.
Abbreviations: PC, polycarbonate; SH, superhydrophobic.
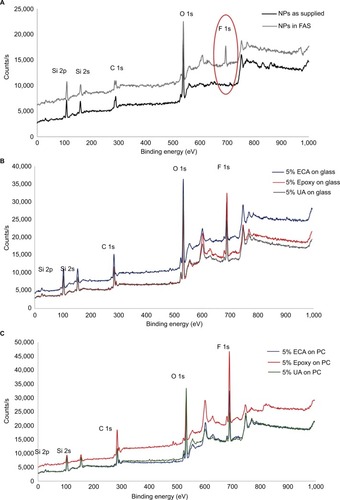
Figure 3 SEM of surface morphology with increasing UA wt% on two different substrates.
Abbreviations: PC, polycarbonate; SEM, scanning electron microscopy; UA, urethane acrylate; SH, superhydrophobic.
The SEM images indicate that a variety of hierarchical structures are developed with respect to the NP location in the coatings; these changes were due to changing interactions between the binder and the NPs, the substrate and the coating system, as well as the binder concentration. For ECA formulations on glass, for all binder concentrations, the hydrophobic NPs appeared to locate on the top layer of the coating as predicated in the analysis. On PC, the results also supported the prediction and NPs appeared to be located on the top layer; however the ECA did not fully wet the substrate surface leading to non-coated regions. In the case of the epoxy binder on glass, >10 wt% epoxy, NPs mostly resided in the binder as predicted. Below 10 wt% binder, NPs were identified on the surface, probably due to lack of sufficient binder to completely surround the particles. On PC, most NPs appeared to be embedded in the epoxy binder as predicted. Coatings with UA binders provided similar trends as those observed for coatings with epoxy binders where NPs appeared to be embedded in the cases of high UA concentrations. As opposed to the other two binders, the NPs were not seen to spread on the surface, but were kept in the binder boundary surface.
The thermodynamic-based predictions for the NPs location for the ECA system were consistent with the SEM images showing that the NPs were mostly located on the surface for all ECA concentrations. For the UA and epoxy systems where the spreading coefficient was close to zero, the interaction between the binder and NPs in addition to the heat is sufficient to result to localization in the binders, with 15–25 wt% binder. For 5 and 10 binder wt%, although the spreading coefficient was negative, the NPs were on the surface due to the lack of sufficient binder to wet the NPs.
The substrate wetting behavior affects the wetting of the binders. All three binders showed complete wetting on glass, as expected, as glass has high SFE compared to the binders. On PC substrates having lower SFE, epoxy showed full wetting; however, ECA and UA did not wet the surface even at higher binder wt% and uncoated areas were observed.
The calculated surface tensions (γt is the total surface tension, γd is the dispersive component of the surface tension, and γp is the polar component of the surface tension), using the pendant drop method, of the neat uncured binders are given in . To quantify the SFE of the PC substrate, both Zisman’sCitation49 and LW/AB methods were used (). The surface tension of glass (high surface energy) was taken as 146 mN/m (based on the literature for microscope soda lime slides).Citation54
Table 5 Surface free energy calculation for PC based on Zisman and LW/AB methods
A comparison of the SFE value shows that the Zisman method had lower value for PC than LW/AB method. As Zisman’s method uses only nonpolar liquids and LW/AB uses both polar and nonpolar liquids, polar interactions are not considered in Zisman’s method. As PC has two aromatic rings and a carbonyl group, which are electron donors, the SFE was taken as 44.36 mN/m.
All three binders exhibited lower SFE values than glass, which could be attributed to full wetting of the glass by the binders as seen previously by SEM (–). For PC, mixed results were observed because SEM showed only full wetting of PC by the epoxy while ECA and UA did not wet the PC. To explain why ECA and UA having lower surface energy than PC, did not fully wet the surface, further work has been carried out as follows.
In spin coating, when the interaction energy between a substrate and a solvent overcomes that between a substrate and a polymer, the films become rough and segregate. On the contrary, when the interaction energy between a substrate and a polymer is stronger than that between a substrate and a solvent, or when both interaction energies are weak, the films obtained are homogeneous and flat.Citation55 Hence, the calculated interaction energy between the substrate/binder and substrate/solvent can explain the experimental results. The higher the interfacial tension the lower is the interaction between the liquid and the solid. Subsequently, the interfacial tensions were calculated using Young’s equation for contact angle measurements. As acetone was used as the binders’ solvent, the interfacial tension between acetone and the substrates was also measured using the same method. The results are presented in and .
Table 6 Interfacial tension for acetone solvent and uncured binders with glass
Table 7 Interfacial tension for acetone solvent and uncured binders with PC
The results in , for glass substrate, show very high interfacial tension values for both acetone/glass and binders/glass. Because high interfacial tension values means weak interactions, the solvent and binders demonstrate weak interaction energies, resulting in a flattened and more homogeneous film as evident by the respective SEM. The results in can explain why ECA and UA did not fully wet the PC substrate. The interfacial tensions between ECA/PC and UA/PC were higher (lower interaction) than the acetone/PC interfacial tension, resulting in segregation and uncoated areas as shown by the respective SEM. For epoxy, the interaction energy with PC was lower than the acetone/PC interaction, meaning stronger interaction energy, resulting in a flattened and more homogeneous film as shown in the respective SEM.
Superhydrophobicity study
The superhydrophobicity of glass and PC substrates coated with silica NPs dispersed in different binders was evaluated by contact and sliding angle measurements. Three samples were prepared for each formulation, and the average values are shown in and .
Figure 4 Wetting characteristics on glass using contact angle and sliding angle measurements for three different binder formulations as a function of increasing wt% binder.
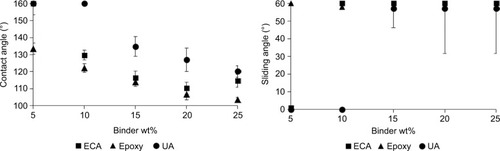
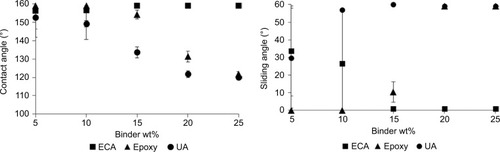
Figure 5 Wetting characteristics on PC using contact angle and sliding angle measurements for three different binder formulations as a function of increasing wt% binder.
The contact angle results correlate well with the SEM images and with the formation of nanoroughness, as shown in and . ECA system exhibited superhydrophobicity for all ECA wt% on glass due to the presence of hydrophobic NPs on the top layer as shown in the respective SEM. On PC, however, superhydrophobicity was not obtained when ECA concentration was >10 wt%. SEM showed NPs located on the top layer; however ECA did not fully wet the substrate surface leading to non-coated regions. The presence of coated and non-coated regions on the PC can explain the high standard deviations of the contact angle results for high ECA concentrations – that is, some areas were superhydrophobic and some were not. Epoxy exhibited superhydrophobicity when coating glass from 5 to 10 binder wt%, but superhydrophobicity was lost at higher epoxy wt%. SEM showed that with an increase in binder wt%, it appeared that more NPs penetrated into the binder, resulting in the loss of nanoroughness, and hence, decreasing contact angle values. In the case of the PC substrate, contact angles increased with decreasing epoxy wt% due to the appearance of NPs on the surface; however, none of the epoxy formulations were superhydrophobic. This is probably because the appropriate roughness was not obtained due to the lack of sufficient numbers of NPs on the surface. The UA formulation showed superhydrophobicity at 5 and 10 binder wt% for both glass and PC. SEM showed that <10 wt% UA, NPs were on the surface. In general, the glass substrates provided superhydrophobicity over a wider range of compositions compared to PC.
As the formation of nanoroughness is essential for superhydrophobicity, it was necessary to characterize better the localization of NPs on the coating surface as they impart the nanoscale roughness to the surface. Hence, XPS was carried out to analyze whether the NPs were located on the surface, as they appeared to be in the SEM images. First, the as-supplied fumed silica NPs (control sample) and modified (with FAS) silica NPs were mounted on carbon tape and analyzed. The results are shown in . The XPS spectra detected the presence of silicon, oxygen, carbon, and fluorine on the surface, whereas no fluorine was detected for the as-supplied fumed NPs. Thus, the detection of FAS via fluorine atoms can be used to determine if the treated NPs are on the surface or embedded in the matrix. Because the coverage of the NPs on the carbon tape was not complete, the detection of carbon on the as-supplied fumed silica NPs was also related to the carbon tape. present XPS data for all glass and PC samples coated with 5 wt% binder concentration. The XPS data confirmed the presence of NPs with FAS on the coating surface as was also confirmed by the respective SEM analysis. It should be emphasized that all these coatings were superhydrophobic except 5 wt% epoxy on PC, although NPs were on the surface for this formulation as well. This non-superhydrophobic surface could be attributed to the lack of sufficient NPs to create the appropriate surface roughness for superhydrophobicity.
Figure 6 XPS of silica, binders on glass and PC.
Notes: (A) XPS survey scanning of the surface composition of dry, as-supplied silica NPs and with the presence of FAS; (B) XPS survey scanning of all 5 wt% binder formulations on glass; and (C) XPS survey scanning of all 5 wt% binder formulations on PC. The red circle indicates position of fluorine peak.
Abbreviations: ECA, ethyl cyanoacrylate; NPs, nanoparticles; PC, polycarbonate; UA, urethane acrylate; XPS, X-ray photoelectron spectroscopy; FAS, fluoroalkylsilane.
To conclude this part of the work, spreading coefficient calculation can predict NPs localization for formulations with high binder wt% (≥15) on high surface energy substrates, such as glass. At low binder loading (15 wt%) and with low surface energy substrates, NPs localization did not follow our prediction. The above-mentioned thermodynamic analysis showed that different binder systems demonstrate different behaviors due to the different spreading coefficients, which was shown to be an effective tool to predict the localization of the NPs within the binder used. This allows one to potentially predict which binder systems would create superhydrophobic surfaces when combined with the NPs.
Surface free energy (SFE)
Thermodynamic analysis was used to study the SFE of the different cured coatings leading to a variety of hierarchical structures with respect to the NPs location in the coatings. The SFE expresses the tendency of a system to increase its surface area resulting in a lower SFE. Hence, the presence of NPs on the surface increases the surface area and causes a reduction of SFE. SFE is further reduced by the presence of fluoro groups on the surface. To quantify the interactions, the SFEs of the component materials were calculated using both Zisman’s and LW/AB methods (). The surface tension of glass (high surface energy) was taken as 146 mN/m (based on the literature for microscope soda lime slides).Citation44
Table 8 SFE calculation for neat cured binders and PC based on Zisman and LW/AB methods
A comparison of the SFE values shows that Zisman’s method has the best correlation with the LW/AB method for the epoxy binder. As Zisman’s method uses nonpolar liquids and LW/AB uses polar and nonpolar liquids, these values indicate that polar interactions are insignificant for epoxy. The Zisman SFE values for PC, ECA, and UA were lower than LW/AB values, indicating significant polar interactions in these cases. PC has two aromatic rings and a carbonyl group, ECA has a cyano group and ester group, and UA has urethane and acrylate groups, which are electron donors so their SFEs were taken as 44, 34, and 46 mN/m, respectively. The LW/AB values were used for comparison.
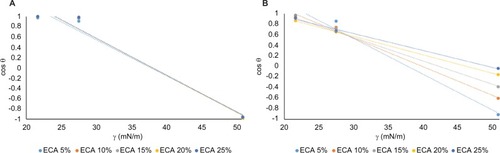
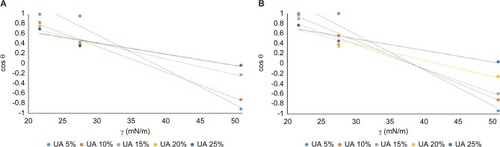
A similar procedure was used to determine the SFE for the binder formulations (cured binder, NPs, and fluoroalkylsilane). In this case, the determined LW/AB values were not suitable for highly hydrophobic surfaces, so Zisman’s method was used. Zisman’s values for all binder formulations on glass and PC are reported in and graphs are shown in Figures S1–S4.
Table 9 SFE values for all binder formulations on glass and PC using Zisman’s method
As expected, all the surfaces showed lower SFE compared to the neat binders (). SFE results, however, did not indicate a clear distinction between the superhydrophobic and non-superhydrophobic surfaces. In fact, some non-superhydrophobic surfaces exhibited lower SFE than the superhydrophobic ones. These results confirmed that low SFE values alone are not sufficient to define superhydrophobicity and that surface morphology has an important role in achieving superhydrophobicity.
As observed in , for ECA formulations coated on glass no significant change in SFE was obtained due to the presence of NPs on the surface (as was shown in the SEM images). For PC, a small change in SFE was obtained between the formulations due to some non-coated areas and exposure of the PC substrate, which has a lower SFE value. As the droplet used to measure the contact angles was large enough (1 mm diameter) to encompass both the non-coated and coated areas, the size of the non-coated areas and their structure must be considered. In the case of epoxy formulations applied on glass, higher SFE values were found for the superhydrophobic formulations with the NPs on the top surface, compared to the non-superhydrophobic ones. For PC, there was no significant change in SFE for all formulations except 5 wt% (where the NPs were on the surface and thus gave a higher SFE value). Superhydrophobic UA formulations (5 and 10 wt%) on glass and PC showed higher SFE values than the non-superhydrophobic ones, as expected.
It should be noted that the surface tension of neat ECA and UA measured by the pendant drop method was not consistent with the calculated SFE of the cured binders using the LW/AB method; 25 and 27 mN/m compared to 34 and 47 mN/m, respectively. This difference was attributed to the low molecular weight of the monomers compared to the cured binder as the surface tension of polymers tends to increase with increasing molecular weight.Citation56 In the case of the two-part epoxy, no significant change was observed between the surface tension and SFE of the cured binder, 38 and 39 mN/m, respectively. This result indicated that the uncured epoxy oligomers may have high enough molecular weight.
Durability evaluation and analysis
Superhydrophobic coatings can lose their nanoroughness by shear forces due to abrasion or other mechanical forces. As durability is critical for real applications, the mechanical integrity of the coatings was studied using the tape test. The superhydrophobicity after the tape test was determined and the results are shown in and .
Figure 7 Wetting characteristics after the tape test on glass using contact angle and sliding angle measurements for three different binder formulations with increasing binder wt%.
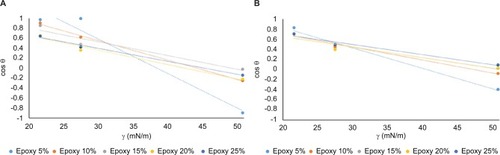
Figure 8 Wetting characteristics after the tape test on PC using contact angle and sliding angle measurements for three different binder formulations with increasing binder wt%.
Tape tests, which are often used to study coating adhesion, were used as a preliminary method to evaluate the adhesion and durability of the superhydrophobicity. No detachment of the coating was visually observed after the tape test. The results indicated that epoxy exhibited the highest durability on glass and PC compared to ECA and UA. All epoxy formulations (the superhydrophobic and non-superhydrophobic) showed only small changes in the contact angle and sliding angle values before ( and ) and after the tape test. This durability was attributed to the negative interfacial tension values between the NPs and epoxy (calculated in ), resulting in good adhesion. The tape test results for the ECA/glass system indicated low durability for low binder wt%. This behavior was attributed to excess NPs on the top surface layer that can be detached easily. At higher binder wt%, high contact angles and low sliding angles were unchanged following the tape test due to the low interfacial tension of 4.14 mN/m between ECA and the NPs, which resulted in good adhesion. For the PC substrate, with increasing binder wt% some of the areas were coated, while some were not (), a condition that resulted in high standard deviations of the measured contact angles. UA coatings demonstrated low durability even though NPs were embedded in the binder. This poor durability may be due to the increased SFE of the cured UA (46 mN/m) compared to the non-cured UA (27 mN/m), which resulted in higher interfacial tension and low adhesion between the binder and the NPs.
Of interest is the fact that some of the coatings are able to retain their superhydrophobic behavior after durability testing. The ECA formulations show good retention of superhydrophobic properties on glass. Clearly further work is needed to improve the behavior on PC.
Conclusion
To obtain the necessary surface morphology for superhydrophobicity (exposed NPs) combined with durability (embedded NPs), a balance should be achieved between wetting of the NPs by the binder and migration of the NPs to the surface. Thus, the use of thermodynamic analysis as an analytical tool to predict the localization of NPs is essential for the selection of binders, NPs, and substrates for different systems.
Three different binders, ECA, epoxy, and UA, and two substrates, PC and glass, were included in the study. The interfacial tensions and spreading coefficients of the as prepared solutions and the evaporation during spin coating were calculated to predict the localization of the NPs. The thermodynamic investigation was in good agreement with the SEM analysis with respect to the localization of the NPs as function of the binder concentration and substrate type. ECA showed a high negative spreading coefficient value with NPs resulting in localization of the NPs on the surface. Epoxy and UA showed moderately negative spreading coefficient values that can be overcome by heat during curing. In all three systems, with 5 and 10 binder wt%, although the spreading coefficient is positive, the NPs were on the surface due to the lack of sufficient binder to wet the NPs.
While the ECA formulations exhibited superhydrophobicity on glass from 5 to 25 binder wt%, they showed superhydrophobicity on PC only from 5 to 10 binder wt%. Epoxy exhibited superhydrophobicity on glass from 5 to 10 binder wt%, but did not form superhydrophobic structures on PC substrates. The UA formulation showed superhydrophobicity at 5 and 10 binder wt% for both glass and PC. In general, the glass substrates provided superhydrophobicity over a wider range of compositions compared to PC.
SEM analysis revealed the presence of nanoroughness from the presence of NP localization on the surface, which is critical for the creation of superhydrophobic surfaces. In all cases, the 5 and 10 binder wt% showed superhydrophobicity from insufficient binder to wet the NPs.
Some of the coatings retained their superhydrophobic behavior after durability testing demonstrating the potential of preparing durable superhydrophobic coatings for a variety of applications.
Acknowledgments
The authors appreciate the support of the National Science Foundation (Award #EEC-0832785) and the Davis and Francis Pernick Fund.
Supplementary materials
Figure S1 Surface tension results for neat and diluted uncured binders using pendant drop method.
Abbreviations: ECA, ethyl cyanoacrylate; UA, urethane acrylate.
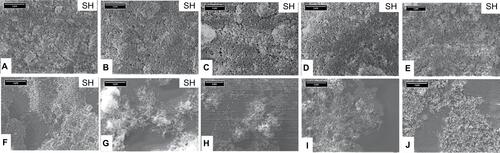
Figure S2 Zisman linear regression plot to find the critical surface free energy for ECA formulations (A) on glass (B) on PC.
Abbreviations: ECA, ethyl cyanoacrylate; PC, polycarbonate.
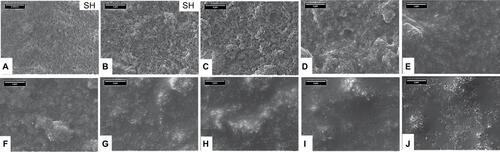
Figure S3 Zisman linear regression plot to find the critical surface free energy for epoxy formulations (A) on glass (B) on PC.
Abbreviation: PC, polycarbonate.
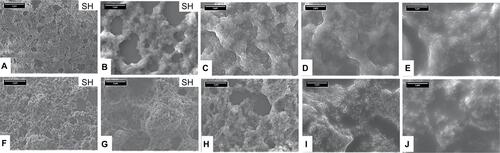
Figure S4 Zisman linear regression plot to find the critical surface free energy for UA formulations (A) on glass and (B) on PC.
Abbreviations: PC, polycarbonate; UA, urethane acrylate.
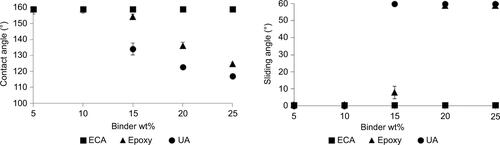
Table S1 Surface tension calculation for neat and diluted binders
Disclosure
The authors report no conflicts of interest in this work.
References
- RiosPFDodiukHKenigSMcCarthySDotanADurable ultra-hydrophobic surfaces for self-cleaning applicationsPolym Adv Technol20081916841691
- ChenYChenSYuFSunWZhuHYinYFabrication and anti-corrosion property of superhydrophobic hybrid film on copper surface and its formation mechanismSurf Interface Anal200941872877
- ChengJYangZRHaiJYangJXPreparation and performance of RTV coating for anti-pollution flashover with superhydrophobicity by filling CaCO3/SiO2 composite particles into silicone rubberAdv Mater Res201132833012631267
- SeoHOKimKDJeongMGSuperhydrophobic carbon fiber surfaces prepared by growth of carbon nanostructures and polydimethylsiloxane coatingMacromol Res2011202216219
- WangZLiQSheZChenFLiLLow-cost and large-scale fabrication method for an environmentally-friendly superhydrophobic coating on magnesium alloyJ Mater Chem201222140974105
- DikićTMingWVan BenthemRAEstevesACde WithGSelf-replenishing surfacesAdv Mater201224273701370422700365
- AlizadehAYamadaMLiRDynamics of ice nucleation on water repellent surfacesLangmuir20122863180318622235939
- HölkenIHoppeMMishraYKGorbSNAdelungRBaumMJComplex shaped ZnO nano- and microstructure based polymer composites: mechanically stable and environmentally friendly coatings for potential antifouling applicationsPhys Chem Chem Phys201618107114712326883913
- DotanADodiukHLaforteCKenigSThe relationship between water wetting and ice adhesionJ Adhes Sci Technol2009231519071915
- KulinichSAFarhadiSNoseKDuXWSuperhydrophobic surfaces: are they really ice-repellentLangmuir2011271252921141839
- FarhadiSFarzanehMKulinichSAAnti-icing performance of superhydrophobic surfacesAppl Surf Sci20112571462646269
- ArianpourFWater and Ice-Repellent Properties of Nanocomposite Coatings Based on Silicone Rubber [Master’s thesis]Vancouver, CanadaUniversite du Quebec2010 French
- MengLYParkSJSuperhydrophobic carbon-based materials: a review of synthesis, structure, and applicationsCarbon Letters201415289104
- LeeJYongKSurface chemistry controlled superhydrophobic stability of W18O49 nanowire arrays submerged underwaterJ Mater Chem2012222025020256
- KwakGSeolMTakYYongKSuperhydrophobic ZnO nanowire surface: chemical modification and effects of UV irradiationJ Phys Chem C2009113281208512089
- WangXLSongWLGabYHSuperhydrophobic modification of hydroxyapatite decreased in vitro streptococcus mutans adhesion and calcium dissolutionChin J Dent Res20091211550
- BarshiliaHCMohanDKSelvakumarNRajamKSEffect of substrate roughness on the apparent surface free energy of sputter deposited superhydrophobic polytetrafluoroethylene thin filmsAppl Phys Lett200995033116
- KimTIBaekChSuhKYSeoSMLeeHHOptical Lithography with printed metal mask and a simple superhydrophobic surfaceSmall20084218218518200650
- FengJTuominenMTRothsteinJPHierarchical superhydrophobic surfaces fabricated by dual-scale electron-beam-lithography with well-ordered secondary nanostructuresAdv Funct Mater2001211937153722
- KimBHLeeDHKimJYMussel-inspired block copolymer lithography for low surface energy materials of teflon, graphene, and goldAdv Mater201123475618562222021119
- HeadrickJEArmstrongMCrattyJHammondSSheriffBABerrieCLNanoscale patterning of alkyl monolayers on silicon using the atomic force microscopeLangmuir20052194117412215835982
- SchweikartAZiminDHandgeUABennemannMAltstädtVFeryAKochKFabrication of artificial petal sculptures by replication of sub-micron surface wrinklesMacromol Chem Phys2010211259264
- NahumTDodiukHDotanAKenigSLelloucheJPSuperhydrophobic durable coating based on UV-photoreactive silica nanoparticlesJ Appl Polym Sci201413141122
- LattheSSImaiHGanesanVVenkateswaraRPorous superhydrophobic silica films by sol-gel processMicropor Mesopor Mat2010130115121
- KarmouchRRossGGSuperhydrophobic wind turbine blade surfaces obtained by a simple deposition of silica nanoparticles embedded in epoxyApplied Surface Science20102573665669
- RiosPFDodiukHKenigSMcCarthySDotanAThe effects of nanostructure and composition on the hydrophobic properties of solid surfacesJ Adhesion Sci Technol2006206563587
- AlexanderSEastoeJLordAMGuittardFBarronARBranched hydrocarbon low surface energy materials for superhydrophobic nanoparticle derived surfacesACS Appl Mater Interfaces20168166066626641156
- LeeMLeeSYimCJeonSSurface wetting of superhydrophobic aluminum oxide nanostructures investigated using the fiber-optic spectrometer and quartz crystal microbalanceSensor Actuat B Chem2015220799804
- KartiniISantosaSJFebriyantiENugrohoORYuHWangLHybrid assembly of nanosol titania and dodecylamine for superhydrophobic self-cleaning glassJ Nanopart Res2014162514
- XuQFLiuYLinFJMondalBLyonsAMSuperhydrophobic TiO2-polymer nanocomposite surface with UV-induced reversible wettability and self-cleaning propertiesACS Appl Mater Interfaces20135188915892423889192
- PengMLiaoZQiJZhouZNonaligned carbon nanotubes partially embedded in polymer matrixes: a novel route to superhydrophobic conductive surfacesLangmuir20102616135721357820695606
- JungSDorestijnMRapsDDasAMegaridisCMPoulikakosDAre superhydrophobic surfaces best for icephobicityLangmuir20112763059306621319778
- SrinivasanSPraveenVPhilipRAjayaghoshABioinspired super-hydrophobic coatings of carbon nanotubes and linear pi systems based on the bottom-up self-assembly approachAngew Chem Int Ed2008473157505754
- LauKKSBicoJTeoKBKSuperhydrophobic carbon nanotube forestsNano Lett200331217011705
- JinXDengMKapsSStudy of tetrapodal ZnO-PDMS composites: a comparison of fillers shapes in stiffness and hydrophobicity improvementsPLoS One201499e10699125208080
- WangBBFengJTZhaoYPYuTXFabrication of novel superhydrophobic surfaces and water droplet bouncing behavior — part 1: stable ZnO–PDMS superhydrophobic surface with low hysteresis constructed using ZnO nanoparticlesJ Adhes Sci Technol20102415–1626932705
- AtesESUnalanHEZinc oxide nanowire enhanced multifunctional coatings for cotton fabricsThin Solid Films20125201446584661
- WangHTangLWuXDaiWQiuYFabrication and anti-frosting performance of super hydrophobic coating based on modified nano-sized calcium carbonate and ordinary polyacrylateAppl Surf Sci200725388188824
- ZhangHZengHGaoYShiFZhangPChenJFA facile method to prepare superhydrophobic coatings by calcium carbonateInd Eng Chem Res201150630893094
- WangGGZhuLQLiuHCLiWPSelf-assembled biomimetic superhydrophobic CaCO3 coating inspired from fouling mineralization in geothermal waterLangmuir20112720122751227921919516
- AttaaAMAl-LohedanaHAEzzataAOAl-HussaincSACharacterization of superhydrophobic epoxy coatings embedded by modified calcium carbonate nanoparticlesProg Org Coat2016101577586
- QianBShenZFabrication of superhydrophobic surfaces by dislocation-selective chemical etching on aluminum, copper, and zinc substratesLangmuir200521209007900916171323
- TeshimaKSugimuraHInoueYTakaiOTakanoATransparent ultra water-repellent poly(ethylene terephthalate) substrates fabricated by oxygen plasma treatment and subsequent hydrophobic coatingAppl Surf Sci20052441–4619622
- BhushanBBioinspired Structured SurfacesLangmuir20122831698171422233136
- ZhangXShiFYuXPolyelectrolyte multilayer as matrix for electrochemical deposition of gold clusters: toward super-hydrophobic surfaceJ Am Chem Soc2004126103064306515012132
- RahmawanYXuLYangSSelf-assembly of nanostructures towards transparent, superhydrophobic surfacesJ Mater Chem A20131929552969
- XiuYZhuLHessDWWongCPHierarchical silicon etched structures for controlled hydrophobicity/superhydrophobicityNano Lett20077113388339317929875
- ScarrattLRHoatsonBSWoodESHawkettBSNetoCDurable superhydrophobic surfaces via spontaneous wrinkling of teflon AFACS Appl Mater Interfaces20168106743675026910574
- ZismanWARelation of the equilibrium contact angle to liquid and solid constitutionAdv Chem196443151
- GirifalcoLAGoodRJTheory for the estimation of surface and interfacial energies. I. derivation and application to interfacial tensionJ Phys Chem1957617904909
- GubbelsFJeromeRKinetic and thermodynamic control of the selective localization of carbon black at the interface of immiscible polymer blendsChem Mater199810512271235
- EliasLFenouillotFMajesteJCCassagnauPhMorphology and rheology of immiscible polymer blends filled with silica nanoparticlesPolymer2007482060296040
- SmallwoodIMHandbook of Organic Solvent PropertiesNew York, NYJohn Wdey & Sons1996
- TillotsonEWOn the surface tension of silicate and, borosilicate, glassesInd Eng Chem191249651652
- BrazJCharacterization of spin-coated polymer filmsChem Soc2002135695699
- MoreiraJCDemarquetteNRInfluence of temperature, molecular weight, and molecular weight dispersity on the surface tension of PS, PP, and PE. I. experimentalJ Appl Polym Sci20018219071920