 ?Mathematical formulae have been encoded as MathML and are displayed in this HTML version using MathJax in order to improve their display. Uncheck the box to turn MathJax off. This feature requires Javascript. Click on a formula to zoom.
Abstract
Highly crystalline nanospherical iron–platinum systems were produced by 248 nm laser irradiation of a liquid precursor at different laser fluences, ranging from 100–375 mJ/cm2. The influence of laser intensity on particle size, iron composition, and structure was systematically investigated. Different nanostructures of iron–platinum alloy and chemically disordered iron–platinum L10 phase were obtained without annealing. The prepared precursor solution underwent deep photolysis to polycrystalline iron–platinum nanoalloys through Fe(III) acetylacetonate and Pt(II) acetylacetonate. Fe(II) and Pt(I) acetylacetone decomposed into Fe0 and Pt0 nanoparticles. We found that the (001) diffraction peak shifted linearly to a lower angle, with the last peak shifting in opposition to the others. This caused the face-centered cubic L10 structure to change its composition according to laser fluence. The nanostructures were shown to contain iron and platinum only by energy-dispersive spectroscopy at several spots. The response of these iron–platinum nanoparticles to infrared depends on their stoichiometric composition, which is controlled by laser fluence.
Introduction
Nanoparticles are of great interest to the scientific community due to their ability to control both quantum and classical coupling interactions.Citation1,Citation2 This is of practical importance, because control of quantum interactions would provide a means of precisely tuning the electronic properties of solid particles. Further, synthesis of nanoparticles with controlled size and composition is of fundamental technological interest.
Some types of nanoparticles have already shown great potential in biomedical applications.Citation3 Platinum complexes, including cisplatin, have been used in chemotherapy and shown to have good activity against tumors.Citation4,Citation5 Cisplatin is particularly effective against testicular cancer, improving the cure rate from 10% to 80%.Citation4
Platinum compounds induce apoptosis in malignant cells and are used extensively in the treatment of cancer.Citation5 Sawosz et al showed that bacteria could be used as a vehicle to deliver nanoplatinum to specific parts of the body.Citation6 In the case of Salmonella serotype Enteritidis, nanoplatinum was seen inside bacterial cells, and partly left in bacterial cells.
Recent studies have shown hippocampal accumulation of iron in patients with Alzheimer’s disease and in the substantia nigra in Parkinson’s disease, leading to the suggestion that accumulation of iron is associated with progressive neuropathological changes in these regions.Citation7–Citation9 High doses of intravenous iron have a role in the treatment of a number of diseases associated with iron deficiency, iron deficiency anemia, and blood loss. Where hormone replacement with an erythropoiesis-stimulating agent is required, iron adequacy can optimize treatment.Citation10
Magnetic resonance imaging (MRI), used to track labeled cells, has several advantages, including spatial and temporal resolution and good tissue contrast. Superparamagnetic iron nanoparticles, which are a class of MRI contrast agents generating strong T2-negative contrast in MRI and decreasing signal intensity, have been shown to be efficient.Citation11
We seek to provide means to improving qualify of life by fabricating ultra-small Fe-Pt system for biomedical applications. In comparison with in vitro applications,Citation12,Citation13 in vivo applications of magnetic nanocrystals are more complicated and challenging.Citation14–Citation19 It has been demonstrated that both particle size and surface chemical structures are critical parameters determining the half-life of magnetic nanocrystals in the blood, as well as their opsonization, biokinetics, and biodistribution.Citation20,Citation21
Iron–platinum nanoparticles are predominant amongst these nanostructures. Recently, the cytotoxicity of unmodified iron–platinum nanoparticles was evaluated in endothelial brain cells. Fe48Pt52 nanoparticles were found not to have any significant effect on bEnd3 cells over a 24-hour period.Citation22,Citation23 The streptavidin-biotin binding pair was used to demonstrate that water-based iron–platinum nanoparticles could be further functionalized to include a biotin moiety for specific interaction with streptavidin protein.Citation24 Recently, Chen et al reported effective internalization of iron–platinum nanoparticles into cells and demonstrated that these particles could be used in vivo for cellular imaging and MRI applications.Citation25,Citation26 This opened the way for several future applications of iron–platinum nanoparticles, including regenerative medicine and stem cell therapy, in addition to enhanced MRI diagnostics. Efforts to understand the detailed science of ever smaller structures have been paralleled by efforts to exploit their beneficial properties, but are as yet not well established.
When synthesizing nanoparticles, it is very important to control particle size, shape, and morphology. In this work, we prepared ultrafine iron–platinum nanoparticles using laser solution photolysisCitation27,Citation28 which provides a simple and clean route for synthesis of nanostructures. There have been considerable efforts made to organize iron–platinum nanocrystals for a range of applications, including ultrahigh density recording media and a number of biological applications.Citation13,Citation29,Citation30 Herein, we report on iron–platinum composition, particle size, and structural and vibrational studies as a function of laser fluence. The correlation between nanoparticle size, structure, and iron–platinum composition as a function of laser fluence is also reported. The formation of smaller particles due to ultraviolet laser irradiation caused a slight shift in the optical absorption spectra, which is also reported.
Materials and methods
The iron-platinum nanoparticles were prepared using a method previously described by Mwakikunga et al.Citation31 Precursors for this iron–platinum system comprised a CH3OH (Sigma-Aldrich, St Louis, MO) solution in which Fe(III) acetylacetonate [Fe(III)(C5H7O2)3, 99.9+%, Sigma-Aldrich], denoted by Fe(III) (acac)3, and Pt(II) acetylacetonate [Pt(II) (C5H7O2)2, Sigma-Aldrich 97%] solution, denoted by Pt(II) (acac)2 were completely dissolved. The concentration of the Fe(III) (acac)3 and Pt(II) (acac)2, was 2.4 and 0.6 mM, respectively. Four samples were irradiated at different incident laser fluence settings. Soon after irradiation, the black precipitates formed were washed to remove impurities, and some were allowed to dry on silicon substrates for scanning electron microscopy (SEM) and X-ray diffraction studies.
The irradiation conditions for the samples were as follows: pulse energy was varied in the range of 68–141 mJ, and the pulse frequency was fixed at 10 Hz. The irradiation time was also fixed to 15 minutes. The incident beam had a rectangular shape with dimensions of 5 × 2 mm2 and a pulse duration of 30 nanoseconds. An emitted laser light carrying 5.0 eV per photon was introduced to the surface of the precursor solution through an ultraviolet cuvette by passage through a focusing mirror.
A drop of the liquid was also placed on holey carbon film supported by copper grids for high resolution transmission electron microscopy (TEM) conducted on a JEOL 2100 microscope (Tokyo, Japan) equipped with a LaB6 filament and a Gartan U1000 camera with 2028 × 2028 pixels. Optical band studies were carried on a Varian Cary 500 ultraviolet-visible near infrared spectrophotometer in the absorbance mode.
The X-ray diffraction scan was carried out using a Panalytical X’pert Pro PW 3040/60 X-ray diffractometer equipped with a Cu Kα (λ = 0.154 nm) monochromated radiation source. The measurements were extracted at 45.0 kV and 40.0 mA. High resolution SEM was performed on a JEOL JSM 7500 machine operated at an accelerating voltage of 2 kV.
Results and discussion
Optical properties
Soon after laser irradiation, the red-colored precursor solution for iron–platinum changed in color to black. The black precipitates from the iron–platinum nanoparticles were immersed at the bottom of the liquid solvent. The ultraviolet-visible light region absorbance spectrum was investigated before and after laser irradiation, as shown in . Using an absorption spectroscopy technique, it has been shown that laser photons can dissociate the ligand from precursor molecules,Citation32 allowing formation of new materials due to selective dissociation. Next, the two precursor chemicals, Fe(III) (acac)3 and Pt(II) (acac)2 in 2.4 and 0.6 mM, respectively, were mixed in methanol for laser irradiation. The absorbance spectrum in shows that Fe(III) (acac)3 has its main peak at 272 nm due to π–π* transition within the ligand,Citation33 which is dominant for the precursor spectrum before irradiation. We assume that the precursor absorbance peak close to the KrF excimer laser wavelength of 248 nm enables efficient photolysis of the complexes.
Figure 1 Ultraviolet-visible absorption spectra of iron–platinum precursor [Fe(III) (acac)3/Pt (II) (acac)2 = 2.4/0/6 mM] before and after laser irradiation (150 mJ, 10 Hz).
![Figure 1 Ultraviolet-visible absorption spectra of iron–platinum precursor [Fe(III) (acac)3/Pt (II) (acac)2 = 2.4/0/6 mM] before and after laser irradiation (150 mJ, 10 Hz).](/cms/asset/9423915c-d309-41d6-a2f9-84ac3a0aec72/dnsa_a_24419_f0001_c.jpg)
Laser irradiation did not cause any new band but a reduction in peak intensities of all absorption bands and a slight shift in the optical absorption spectrum, indicating that this shift is towards shorter wavelengths (blue shift). This could be due to formation of smaller particles, changes in their morphology, and surface microstructures. This was also seen in the reported laser photolysis of Fe(II) acetylacetonate in 2-propanol solvent.Citation32
In addition, the sharp peaks in the absorbance spectrum indicate that the particles are in the nanosize range and that the particle size distribution is narrow. It is not clear if the maximum peak in the absorbance spectrum corresponds to the true optical band gap of the iron–platinum nanoparticles. A common method of obtaining the band gap from the absorbance spectra is to get the first derivative of absorbance with respect to photon energy and find the peak in the derivative spectrum at lower energy levels.Citation27,Citation34 The derivative of absorbance of the iron–platinum nanoparticles is shown in the inset of , and indicates a band gap of 4.48 eV at 300 K for one of our samples synthesized at a lower incident fluence of 100 mJ/cm2. The good absorption of the iron–platinum nanoparticles in the ultraviolet region demonstrates the potential applications of this product, eg, for sunscreen protection and antiseptic products.Citation27,Citation35
Energy-dispersive X-ray analysis
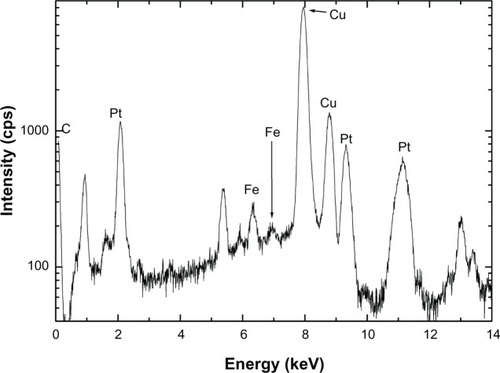
shows the TEM energy-dispersive spectra for the iron–platinum nanocrystals. Some of these particles were formed by spherical crystals (from TEM) and were composed of iron and platinum elements only at several points on the nanocrystals. This observation confirmed iron–platinum alloying in nanoform. There have been a number of reports of iron–platinum nanoparticles being of spherical shape.Citation23–Citation25,Citation30 The carbon and copper in the energy-dispersive spectroscopy spectra were from the grids.
Figure 2 Energy-dispersive spectroscopy spectrum of iron–platinum nanocrystal confirming the presence of iron and platinum elements.
Morphology and structure
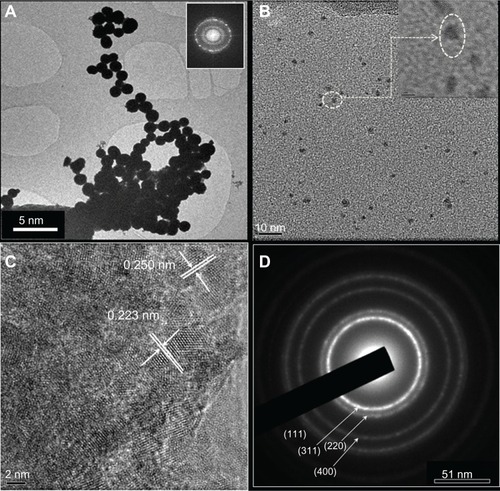
TEM and high-resolution TEM images with different magnifications are shown for iron–platinum nanocrystals in –, as well as an electron diffraction pattern (). From the images, the average diameters of the iron–platinum nanoparticles were in the range of 1.4–3.3 nm. Interference fringes, which are characteristic of crystallinity in nanoparticles, were partly observed, with well dispersed nanoparticles spread over large areas in the inset. The lattice spacing of these iron–platinum nanoparticles measured 0.237 nm on average, with a standard deviation of less than 5%, as shown in . The electron diffraction pattern in shows that these nanocrystals are highly polycrystalline, and we have determined that their electron diffraction displays rings assigned to (111), (220), and (400) Miller planes of iron–platinum. For practical purposes, iron-rich compositions greater than equiatomic ones are necessary due to the steep dissipation of magnetization at platinum-rich concentrations.Citation23,Citation29,Citation30
Figure 3 (A) Low magnification transmission electron microscopy of spherical iron–platinum nanocrystals, (B) randomly scattered particles, (C) high resolution transmission electron microscopy of a highly polycrystalline iron–platinum particle with well-defined fringes, and (D) electron diffraction beam pattern.
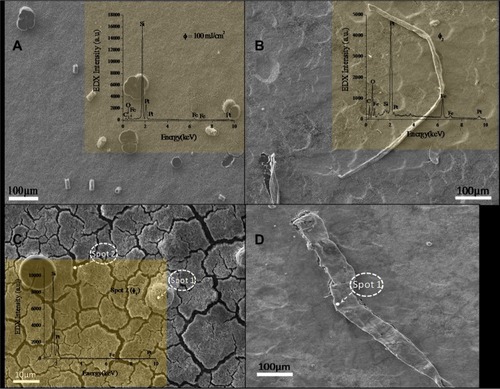
SEM images of the samples prepared by localized surface plasmon resonance at different incident fluences are shown in –, with energy-dispersive spectra shown in the insets. No postsynthesis annealing was done on these samples. This suggests that these different nanostructures grow by a mechanism different from that of nanorods to some structures such as nanobelts that are slight twisted or wrapped and spherical nanostructures. All these nanostructures are from nanoalloys of iron–platinum. The fact that some of these samples gave us these structures is interesting. The mechanism by which these structures form is not clear, but they are reported here for the first time as forming via the technique of localized surface plasmon resonance.
Figure 4 Scanning micrographs of iron–platinum nanostructures synthesized on a silicon substrate without annealing by laser solution photolysis using different laser fluences.
We speculate that the driving force for formation of any structure is based on energy input. It is well known that nature prefers to form spheres rather than any other structure. This is because of its low surface energy. Supposing that more energy is available during structure formation, any structure might form depending on how it expends a given amount of energy. Researchers using laser pyrolysis have tried to synthesize different nanostructures of nanowires, stars, fibers, and spheres.Citation36–Citation38 They proposed a mechanism for nanowire formation and advanced a potential explanation for the manner of growth of nanowires from laser pyrolysis. Their model was founded on basic statistical mechanics theory.
One has to understand what energy is needed to form what structure, and other ambient conditions also have to be considered, eg, concentration of the starting material, time at which such energy is available, and the relationship between that material and the wavelength energy. Note that the energy-dispersive spectra confirms alloying at different spots in –. also shows formation of cracks and spheres. Also, at spot 2 in (inside the crack), energy-dispersive spectroscopy shows more silicon peaks and some platinum and iron. This is because the material was placed on a silicon substrate.
shows the spectra for iron–platinum nanoparticles from the same precursor concentration. The samples were prepared at different laser fluences. No postsynthesis annealing was done on these samples, as mentioned earlier. The spectra show that no ordered superlattice peaks were present, which is characteristic of a chemically disordered iron-platinum alloy with a face-centered cubic phase. No separate peaks for platinum and iron were present, providing evidence of a face-centered cubic alloy of iron and platinum.
Figure 5 X-ray diffraction patterns for samples with different iron–platinum composition achieved without post-synthesis annealing.
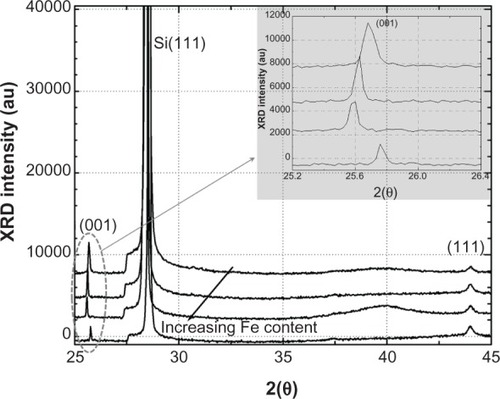
However, as more iron is produced in the system, there is a noticeable shift of the (001) peak to lower angles. This shift can be used to monitor the relative composition of an iron–platinum alloy. This shift in peak position is consistent with Vegard’s law which states that the lattice parameter of a solid binary alloy solution is directly proportional to the atomic percentage of the alloy.
Klemmer et alCitation29 noted that as the iron-rich composition is pushed from the 50% iron region, a small change in the c parameter is seen, while the a parameter is changing faster and getting smaller. The opposite is true for the platinum region. In our case, the (001) peak is shifting and the (111) peak at around 44°C = 2Θ does not seem to have shifted. The fact that the (111) peak position has not shifted suggests that the iron–platinum nanoparticles have not oxidized. This was also observed by Liu et al, while the shift in (001) can be used to monitor the iron–platinum composition.Citation29
The d-spacing for the simple face-centered cubic structure is given by the following well known equation:
where d is the value of the interplanar spacing, and a, h, k, and l are Miller indices giving the value of the lattice planes under investigation. Inserting the values of the lattice planes into EquationEquation 1(1) , the a and d-spacing [0.371 nm (from the literature) and 0.223 and/or 0.225 nm (observed), respectively] is obtained for the disordered face-centered cubic phase of iron–platinum. Searching for the h, k, and l Miller indices that would yield the closest experimental d-spacing gave Miller indices for the plane (hkl) = (111), with a d-spacing of 0.214 nm.
The calculated d-spacing was very close to the observed spacing of 0.223 and 0.225 nm, as shown in the TEM images of iron-platinum (). The refection plane (001) had a d-spacing = a = 0.371 nm. This is near the a parameter of 0.385 nm for the L10 phase. The (001) peak of the last sample shifted in opposition to the others. The reason for this has yet to be identified.
Iron–platinum nanoparticle composition and mechanism
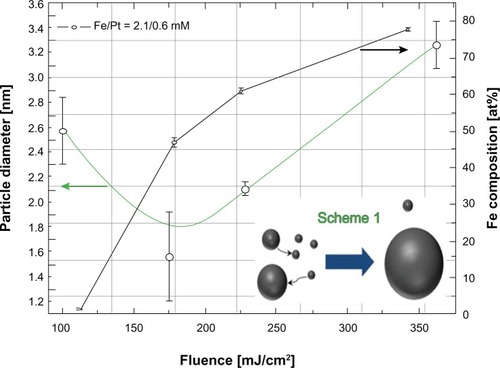
We investigated the influence of laser fluence on iron–platinum composition and particle size in order to explore controllability of the nanoparticles by adjustment of laser fluence. By changing the laser fluence we were able to control the iron–platinum composition below and above the equiatomic value of iron–platinum nanoparticles, and their particle sizes were also controlled. (black line) shows an increasing iron content as a function of laser fluence. The iron content has a tendency to increase with increasing laser fluence due to the effect of irradiation. Thus, to achieve 50% iron and 50% platinum, a critical laser fluence of 195 mJ/cm2 (76 mJ) is required.
Figure 6 Particle size distribution and iron composition with increasing laser fluence of the iron–platinum nanosystems with a precursor molar concentration of 2.4/0.6 for Fe(III) (acac)3/Pt(II) (acac)2.
In order to obtain iron–platinum nanoparticles with higher iron contents, higher energies (laser fluences) are required. This is because dissociation of Fe(III) acetylacetonate is harder than for Pt(II) acetylacetonate. In earlier reports of ultraviolet laser solution photolysis,Citation28,Citation40,Citation41 investigators have proposed deep photolysis from acac complexes directly to zerovalent elemental iron and photofragments. Pola et al reported this to happen without passing through an intermediate product, in their case Cu(II) acetylacetonate.Citation40 A multiphoton dissociation process is highly possible in the case of Fe(II) (acac)2 through cleavage of acetylacetonate ligands. EquationEquation 2(2) shows the photolysis that took place:
where n248nm represents the number of photons of wavelength 248 nm. From the experimental conditions, a minimum of approximately 8.48 × 10¹⁶ photons can be delivered. The photolysis mentioned in EquationEquation 2(2) also happens in the case of platinum acac complexes.
Decomposition becomes disproportionally faster at higher laser fluences. Combining the two chemicals in methanol, Fe(III) (acac)3 and Pt(II) (acac)2, the nanoparticle formation mechanism becomes based on multiphoton dissociation processes, as shown in EquationEquation 3(3) for both complexes:
By looking at the absorbance spectra shown in , Fe(III) (acac)3 absorbs more 248 nm photons than does Pt(II) (acac)2. The photolytic process shown in EquationEquation 3(3) becomes more efficient for decomposition, consuming disproportionally more 248 nm photons, which favors Fe (acac)3, hence forming iron–platinum alloys of nanoparticles with an iron content which increases as the laser fluence increases.
This could be one of the reasons for the increased iron content at higher laser fluence. The iron–platinum nanoparticles formed by laser bombardment remained stable for a number of days. The iron–platinum particle size can also be controlled easily by this technique. Rough statistics obtained from randomly selected nanoparticles given as a histogram (not shown here) show that the nanoparticles followed a Gaussian distribution on each and every sample prepared at a different laser fluence.
Four samples were prepared at different laser fluences and are plotted in . The green line is a plot of average particle diameter as a function of laser fluence. It can be seen that the particle diameter is reduced from 2.6 nm to 1.7 nm as the laser fluence is increased. It can also be seen that it cannot be reduced any further beyond about 195 mJ/cm2. Beyond this critical fluence (approximately 195 mJ/cm2), the particle diameter is increased with increasing laser fluence. Using the Lambert–Beer law, the lower absorbance () of these nanoparticles after laser irradiation implies formation of a lower concentration (c) of iron–platinum nanoparticles, and the extinction coefficient (ɛ) of these nanoparticles is decreased by laser fluence, resulting in formation of a smaller particle size.
Beyond the critical laser fluence, the size of the smaller particles will shrink due to net atomic transport to larger particles (shown in the schema for ). The particle size of iron–platinum increases exponentially, with an increase in laser fluence due to coalescence associated with the Oswald ripening process,Citation42 typically due to an increase in temperature. This is one of the coalescence phenomena that are always associated with thermal annealing and have been studied for decades.
By studying both the black and green lines of , at critical laser fluence (about 195 mJ/cm2) there is an interesting correlation phenomenon observed. As the iron content increases, the particle size decreases and increases as a function of laser fluence. It is demonstrated by laser photolysis that it is possible to correlate and control the particle size and composition of iron–platinum nanoalloys. This has been achieved without annealing or sintering, as in previous work.Citation29 This means that the iron-rich component has larger particles than the platinum-rich component. From the report by Klemmer et al,Citation29 it is quite clear that, as we increase the laser fluence, a structural change occurs, resulting in a shift from an asymmetric to symmetric arrangement of atomic sites.
Fourier transform infrared spectroscopic analysis
Fourier transform infrared spectra of the iron–platinum nanoparticles are shown in . Using the Fourier transform infrared technique, it is possible to detect if there is a change in structure of the same material when prepared under different conditions, ie, annealing.Citation43 It is also difficult with Fourier transform infrared spectra to predict the structure that was assumed in the current form. This technique has been used previously to examine the conformational structure of particle-bound or organic surfactant monolayers, where the energies of the symmetric and asymmetric stretching vibrations are taken as a sensitive diagnostic indicator for ordering of adsorbed organic molecules.Citation44
Figure 7 Infrared spectra of (A) irradiated and (B) nonirradiated iron–platinum nanoparticles showing a peak in the fingerprint region at 1024 cm−1.
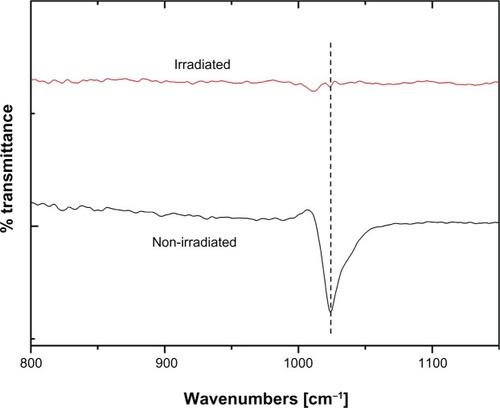
We were interested in using this technique to understand the nanostructures before and after laser irradiation. This was confirmed when looking at the nonirradiated spectra of which shows a sharp strong peak at 1024 cm−1. This vibrational mode is assigned to an organic molecule bonded to the surface of the iron–platinum nanoparticle.Citation41 Soon after the precursor is irradiated with laser (248 nm of KrF excimer), it becomes “infrared-inactive”. Therefore, we speculate that the irradiated material has no dipole moment or rather is symmetrical, ie, cubic.Citation27,Citation45 This suggests that the iron–platinum material rearranges itself in a symmetrical order due to the influence of 248 nm pulse laser irradiation.
There were several small absorption bands before 1024 cm−1, which were likely related to O–H and/or C–O absorbed from the atmosphere, and therefore these can be ignored. Ouchi et alCitation41 have shown that an excess of iron in iron–platinum nanoparticles plays a critical role in influencing surfactant bonding to the surface of these nanoparticles. Platinum is a noble metal and therefore its oxides are not stable. In our study, we ruled out any oxidation because more iron is produced as a result of the (111) peak not shifting, as shown in the X-ray diffraction results.
These types of materials are usually Raman-active, based on the selection rule of Raman scattering. This is due to structural changes as mentioned earlier. On the basis of results reported by Klemmer et al,Citation29 the authors have undertaken structural studies of iron–platinum nanoparticles. It is shown in their results that iron–platinum can rearrange itself, ie, become cubic, as a result of an annealing effect. With the addition of platinum, the composition becomes platinum-rich from the equiatomic L10 phase, such that the extra platinum must substitutionally sit on the L10 iron sublattice, which effectively makes the structure more like a cubic phase with atomic positions in the vicinity of the defect similar to the L12 phase. Again, as the composition was pushed iron-rich from the 50% iron region, another L12 phase was reported to be cubic, for the same reason as that given earlier. In our Raman results, which are not shown here, we observed photon modes became stronger as we increased the iron content (increasing laser fluence). The reasons for this observation will be canvassed further in our future research.
Conclusion
KrF laser photolysis of Fe(III) and Pt(II) acetylacetonate in methanol was undertaken via liquid precursors of Fe(II) and Pt(I) to yield solid-state iron–platinum alloys. Iron acetylacetonate was initially found to be harder to decompose than platinum acetylacetonate. Photolytic alloying formed nanoparticles of a certain stoichiometry, depending on laser fluence. The present technique represents a versatile approach to controlling material structure and composition. Particle sizes in the range of 1.5–3.4 nm were achieved, with the larger particles containing more iron than platinum. We show that these nanoparticles undergo structural transformation reversibly from facecentered cubic to facecentered tetragonal as seen by a FTIR spectroscopy study of the precursor solution and the subsequent XRD of the solid state particles after photolysis. The technique represents a versatile and easy way to fabricate iron–platinum nanoparticles suitable for medical applications. Chemically disordered L10 iron–platinum particles were obtained without annealing treatment. Different nanostructures of iron–platinum were observed by SEM, and the growth mechanism is not understood.
Acknowledgments
SSN wishes to thank Henk Van Wyk for his assistance in KrF laser. The CSIR National Laser Centre is thanked for financial and infrastructural support and characterization facilitation of the CSIR National Centre for Nanostructured Materials is acknowledged.
Disclosure
The authors report no conflicts of interest in this work.
References
- FeldheimDLFossAJrMetal Nanoparticles: Synthesis, Characterisation and ApplicationsNew York, NYMarcel Dekker Inc2002
- HeilmannAPolymer Films with Embedded Metal NanoparticlesBerlin, GermanySpringer-Verlag Series in Materials Science2003
- HuFWeiLZhouZRanYLiZGaoMPreparation of biocompatible magnetite nanocrystals for in vivo magnetic resonance detection of cancerAdv Mater20061825532556
- EinhornLHTreatment of testicular cancer: a new and improved modelJ Clin Oncol19908177717811700077
- GillJSWindebankAJCisplatin-induced apoptosis in rat dorsal root ganglion neurons is associated with attempted entry into the cell cycleJ Clin Invest199810284228509637718
- SawoszEChwalibogASzeligaJVisualization of gold and platinum nanoparticles interacting with Salmonella Enteritidis and Listeria monocytogenesInt J Nanomed20105631637
- BrarSHendersonDSchenkJZimmermanEAIron accumulation in the substantia nigra of patients with Alzheimer disease and parkinsonismArch Neurol20096637137419273756
- BartzokisGAge-related myelin breakdown: a developmental model of cognitive decline and Alzheimer’s diseaseNeurobiol Aging20042551814675724
- SchenckJFZimmermanEAHigh-field magnetic resonance imaging of brain iron: birth of a biomarker?NMR Biomed20041743344515523705
- GozzardDWhen is high-dose intravenous iron repletion needed? Assessing new treatment optionsDrug Des Devel Ther201155160
- ChenRYuHJiaZ-YYaoQ-LTengG-JEfficient nano iron particle-labeling and noninvasive MR imaging of mouse bone marrow-derived endothelial progenitor cellsInt J Nanomedicine2011651151921468354
- XuCXuKGuHDopamine as a robust anchor to immobilize functional molecules on the iron oxide shell of magnetic nanoparticlesJ Am Chem Soc20041269938993915303865
- GuHHoPLTsangKWWangLXuBUsing biofunctional magnetic nanoparticles to capture vancomycin-resistant enterococci and other gram-positive bacteria at ultralow concentrationJ Am Chem Soc2003125157021570314677934
- HuhYMJunYSongHTIn vivo magnetic resonance detection of cancer by using multifunctional magnetic nanocrystalsJ Am Chem Soc2005127123871239116131220
- ZhaoMBeauregardDALoizouLDavletovBBrindleKMNon-invasive detection of apoptosis using magnetic resonance imaging and a targeted contrast agentNat Med200171241124411689890
- TsourkasAShinde-PatilVRKellyKAIn vivo imaging of activated endothelium using an anti-VCAM-1 magnetooptical probeBioconjug Chem20051657658115898724
- WeisslederRMooreAMahmoodUIn vivo MR imaging of transgene expressionNat Med2000635135510700241
- WeisslederRKellyKSunEYShtatlandTJosephsonLCell-specific targeting of nanoparticles by multivalent attachment of small moleculesNat Biotechnol2005231418142316244656
- LubbeASBergemannCBrockJMcClureDGJ Magn Magn Mater19997700
- GuptaAKGuptaMSynthesis and surface engineering of iron oxide nanoparticles for biomedical applicationsBiomaterials2005263995402115626447
- MeldrumFCHeywoodBRMannSJ Magn Reson Imaging199444977802866
- OlszewskiUPoulsenTTUlspergerEPoulsenHSGeisslerKHamiltonGIn vitro cytotoxity of combinations of dichloroacetate with anticancer platinum compoundsClin Pharmacol2010217718322291503
- KimDKKanDVeresTMonodispersed Fe-Pt nanoparticles for biomedical applicationsJ Appl Phys200597
- ChiangP-CHungD-SWangJ-WHoC-SYaoY-DEngineering water-dispersible iron-platinum nanoparticles for biomedical applicationsIEEE20074324452447
- ChenSWangLDuceSLEngineered biocompatible nanoparticles for in vivo imaging applicationsJ Am Chem Soc2010132150221502920919679
- GaoJGuHXuBMultifunctional magnetic nanoparticles: design, synthesis, and biomedical applicationsAcc Chem Res2009421097110719476332
- Khorsand ZakARazaliRAbd MajidWHDarroudiMSynthesis and characterization of a narrow size distribution of zinc oxide nanoparticlesInt J Nanomedicine201161399140321796242
- WatanabeMTakamuraHSugaiHPreparation of ultrafine Fe-Pt alloy and Au nanoparticle colloids by KrF excimer laser solution photolysisNanoscale Res Lett2009456557320596425
- KlemmerTJShuklaNLiuCWuXWSvedbergEBMryasovOStructural studies of L10FePt nanoparticlesAppl Phys Lett20028122202222
- SunSMurrayCBWellerDFolksLMoserAMonodisperse FePt nanoparticles and ferromagnetic FePt nanocrystal superlatticesScience2000281989199210720318
- MwakikungaBForbesASideras-HaddadEManikandanESelf assembly and properties of C:WO3nano-platelets and C:VO2/V2O5triangular capsules of C:VO2/V2O5fullerenes and quantum dots produced by laser solution photolysisNanoscale Res Lett2010538939720671779
- PolaJMaryskoMVorlicekVUV laser photolytic solution deposition of a-Fe/polyoxocarbosilane/carbon nanocomposite and evolution to alpha-Fe2O3/polyoxocarbosilane/carbon nanocompositeJ Photochem Photobiol2008199156
- KishiKIkedaSHirotaKInfrared and ultraviolet studies of the adsorption of acetylacetone on evaporated iron and nickel filmsJ Phys Chem19677143844389
- BecerrilMSilva-LopezHZelaya-AngelOBand gap energy in Zn-rich Zn1-xCdxTe thin films grown by r. f. sputteringRev Me Fis200450588593 Spanish
- HardingFBreast Cancer: Cause – Prevention – CureAylesbury, UKTekline Publishing2006
- MwakikungaBForbesASidera-HaddadEArendseCOptimization, yield studies and morphology of WO3nano-wires synthesized by laser pyrolysis in C2H2and O2ambients – validation of a new growth mechanismNanoscale Res Lett20083372380
- MwakikungaBWSideras-HaddadEArendseCWitcombMJForbesAWO3nano-spheres into W18O49one-dimensional nano-structures through thermal annealingJ Nanosci Nanotechnol200993286329419453005
- GovenderMShikwambanaLMwakikungaBSideras-HaddadEErasmusRForbesAFormation of tungsten oxide nanostructures by laser pyrolysis: stars, fibers and spheresNanoscale Res Lett2011616621711678
- LiuCKlemmerTJShuklaNOxidation of iron-platinum nanoparticlesJ Magn Magn200326696101
- PolaJOuchiABakardjievaSLaser photolytic approach to Cu/polymer sols and Cu/polymer nanocomposites with amorphous Cu phaseJ Photochem Photobiol2007A1928492
- OuchiATsunodaTBastlZSolution photolysis of ferrocene into Fe-based nanoparticlesJ Photochem Photobiol2005A171255260
- RatkeLVoorheesPWGrowth and Coarsening: Ostwald Ripening in Material ProcessingNew York, NYSpringer2002
- SmithEDentGModern Raman Spectroscopy – A Practical ApproachChichester, UKJohn Wiley & Sons Ltd2005
- ShuklaNSvedbergEBEllJSurfactant isomerisation and dehydrogenation on iron-platinum nanoparticlesColloids Surf A Physicochem Eng Asp2007301113116
- ZakAKAbrishamiMEMajidWHAbd YousefiRHosseiniSMEffects of annealing temperature on some structural and optical properties of ZnO nanoparticles prepared by a modified sol-gel combustion methodCeram Inter201137393398