
Abstract
Purpose
Obstructive sleep apnea (OSA) is a highly prevalent disorder associated with increased risk for cardiovascular disease, diabetes, and other chronic conditions. Unfortunately, up to 90% of individuals with OSA remain without a diagnosis or therapy. We assess the relationship between OSA and blood biomarkers, and test the hypothesis that combinations of markers provide a characteristic OSA signature with diagnostic screening value. This validation study was conducted in an independent cohort in order to replicate findings from a prior feasibility study.
Patients and methods
This multicenter prospective study consecutively enrolled adult male subjects with clinically suspected OSA. All subjects underwent overnight sleep studies. An asymptomatic control group was also obtained. Five biomarkers were tested: glycated hemoglobin (HbA1c), C-reactive protein (CRP), uric acid, erythropoietin (EPO), and interleukin-6 (IL-6).
Results
The study enrolled 264 subjects. The combination of HbA1c+CRP+EPO (area under the curve 0.78) was superior to the Epworth Sleepiness Scale (ESS; 0.53) and STOP-Bang (0.70) questionnaires. In non-obese subjects, the combination of biomarkers (0.75) was superior to body mass index (BMI; 0.61). Sensitivity and specificity results, respectively, were: HbA1c+CRP+EPO (81% and 60%), ESS (78% and 19%), STOP-Bang (75% and 52%), BMI (81% and 56%), and BMI in non-obese patients (81% and 38%).
Conclusion
We verify our hypothesis and replicate our prior feasibility findings that OSA is associated with a characteristic signature cluster of biomarker changes in men. Concurrent elevations of HbA1c, CRP, and EPO levels should generate a high suspicion of OSA and may have utility as an OSA screening tool. Biomarker combinations correlate with OSA severity and, therefore, may assist sleep centers in identifying and triaging higher risk patients for sleep study diagnosis and treatment.
Introduction
Obstructive sleep apnea (OSA) is a disorder with high prevalence – estimated to occur in 34% of men and 17% of women,Citation1 afflicting more than 100 million adults worldwide.Citation2,Citation3 Unfortunately, less than 30% of patients currently evaluated by a primary care provider are screened for OSA, with the result that up to 90% of individuals with OSA remain without a diagnosis or therapy.Citation2–Citation5 Patients with untreated OSA are at increased risk for hypertension, cardiovascular disease, heart failure, stroke, obesity, metabolic dysregulation, diabetes mellitus, daytime sleepiness, depression, accidents, and all-cause mortality,Citation6–Citation11 and are a significant burden on the healthcare system.Citation12,Citation13 After treatment, decreases in the risk of chronic health conditionsCitation12,Citation14 as well as healthcare utilization and cost have been reported.Citation15 The association between OSA and adverse health consequences has led the American Heart Association and others to suggest that OSA screening be integrated into routine clinical care.Citation6,Citation16
Current tools for OSA screening rely on questionnaires with low diagnostic accuracy from low-quality studies, as reported in meta-analyses.Citation17 OSA screening measures that are frequently used include the Epworth Sleepiness Scale (ESS) and STOP-Bang questionnaires. The ESS assesses subjective daytime sleepiness but is nonspecific for OSA, was not designed nor validated for OSA screening (yet, remains the most frequently used test, particularly by primary care and other non–sleep-medicine clinicians), is prone to bias, and demonstrates a high false-negative rate.Citation12 The STOP-Bang questionnaire, a screening tool specific for OSA, has a relatively high sensitivity but low specificity.Citation12 The recent American Academy of Sleep Medicine (AASM) clinical practice guidelinesCitation12 report that more accurate and user-friendly screening tools, such as blood biomarkers, are needed to better predict OSA diagnosis and severity. A recent review of potential OSA biomarkersCitation18 concludes that an optimal screening test should be clinically sensitive, specific, simple, timely, inexpensive, and correlate to disease severity. Furthermore, biomarkers should make pathophysiological sense, reflecting functional changes that accompany OSA.Citation19,Citation20 A blood test could potentially meet these criteria, providing risk stratification to prioritize diagnostic sleep study testing and treatment.
Numerous individual OSA blood biomarkers have been studied previously.Citation18,Citation20,Citation21 Dysfunctions in metabolic and endocrine systems induced by OSA, chronic inflammation, hypoxemia, sleep fragmentation, and stress are associated with alterations in biomarkers. These biomarkers include glycated hemoglobin (HbA1c), C-reactive protein (CRP), erythropoietin (EPO), interleukin-6 (IL-6), and uric acid.Citation18,Citation21–Citation26 Unfortunately, the diagnostic utility of individual biomarkers or combinations of markers is inconclusive in identifying OSA.Citation18,Citation21
The objective of this study was to assess the relationship between OSA and five blood biomarkers in patients with a clinical suspicion of OSA, and validate findings from a feasibility study in which 11 biomarkers were assessed.Citation27 Both studies (feasibility and validation) were conducted in independent cohorts. Additionally, a hypothesis was tested that combinations of markers are more predictive of OSA than individual markers. Such clusters of OSA-associated biomarkers could provide a characteristic physiologic signature of OSA that may be valuable in OSA screening.
Material and methods
Study participants
A multicenter prospective study was conducted to assess the relationship between OSA and endocrine, inflammatory, and metabolic biomarkers in consecutively enrolled adult male patients with a clinical suspicion of OSA; subjects were followed from a general medical clinic population (primary care clinicians 82%) to a sleep clinic. Subjects excluded were those with previously diagnosed or treated OSA or currently using steroids, chronic anti-inflammatory drugs, or opioid pain medications. All subjects underwent attended polysomnography in an accredited sleep center, or unattended home sleep apnea testing, as per routine clinical practice. An uncomplicated clinical population was also enrolled as a healthy control group. The study was approved by the institutional review boards or ethics committees at participating centers, and carried out in accordance with The Code of Ethics of the World Medical Association (Declaration of Helsinki). The full title of each ethical review board, and its affiliated institution, is provided in a supplementary . Written informed consent was obtained from all subjects.
Study sites
This study was conducted at six institutions: Stanford Medical School/VA Palo Alto Health Care System; Brigham and Women’s Hospital/Harvard Medical School (Boston, MA); Southern California Permanente Medical Group/Kaiser Permanente Sleep Center (Fontana, CA, USA); Sleep Center Orange County (Irvine, CA, USA); SleepMed (Columbia, SC, USA); EENA Comprehensive Neurology and Sleep Center (Boynton Beach, FL, USA). Additionally, an uncomplicated asymptomatic clinical population was also recruited from a contract research organization.
Clinical assessment and questionnaires
Clinical evaluation included a sleep history, physical examination, and follow up under the supervision of a board-certified sleep medicine specialist. Questionnaires were completed and medical histories were obtained before the subjects underwent sleep studies. Daytime sleepiness was assessed by the Epworth Sleepiness Scale (ESS); ESS scores range from 0 to 24; a score >10 indicates excessive daytime sleepiness. The STOP-Bang questionnaire was also administered; this OSA screening tool consists of 4 questions relating to symptoms (snoring, tired, observed, blood pressure) and 4 questions relating to physical attributes (BMI, age, neck circumference, gender), with scores ranging from 0 to 8. A score ≥3 suggests increased risk of OSA.
Diagnostic sleep studies
Participants underwent attended in-laboratory polysomnography (PSG) in an accredited sleep center, or unattended Type 3 home sleep apnea testing (HSAT) with a technically adequate device approved by the AASM under the supervision of a board-certified sleep medicine physician, who followed published recommendations, methods and scoring guidelines.Citation12,Citation28 Patients with comorbidities or symptoms of other significant sleep disorders underwent PSG, whereas patients without complications underwent HSAT. The sleep recordings were manually scored by a registered polysomnographic technologist and subsequently reviewed by a board-certified sleep physician. The apnea–hypopnea index (AHI) was used in the diagnosis and assessment of severity. Respiratory events (apneas and hypopneas) were scored per the AASM Scoring Manual v2.3.Citation28 Severity thresholds for mild, moderate, and severe OSA were AHI ≥5, AHI ≥15, and AHI ≥30, respectively. Other parameters measured were minimum and average oxygen saturation as well as percentage of time with oxygen saturation <90%.
Sample collection and biomarker testing
Five biomarkers were tested: HbA1c, high sensitivity CRP, IL-6, uric acid, and EPO. These were selected as the most predictive markers from a feasibility study in which 11 bio-markers were assessed.Citation27 Clinicians interpreting the diagnostic sleep studies were blinded to the biomarker results. Blood samples were collected in EDTA and serum (SST) tubes at the time of study enrollment prior to initiation of therapy, within 1 day (median) of the sleep study (interquartile range [IQR] 0–3 days). Whole blood samples were stored at −20°C or colder, and shipped to a central laboratory for HbA1c testing. Serum for all other testing was separated from cells, dispensed into cryo-tubes, stored at −20°C or colder, and shipped to a central laboratory for testing. Samples were tested on the following systems: Beckman Coulter AU System (HbA1c, CRP, and uric acid), and Beckman Coulter UniCel® Access® 2 System (EPO and IL-6).
Statistical methods
Descriptive statistics for each variable were two-tailed Student’s t-tests or Mann–Whitney tests for continuous variables, and chi-square tests for dichotomous variables. Spearman correlation coefficients were used. To assess clinical performance for OSA detection, cutoffs were evaluated using receiver operating characteristic (ROC) curves. Sensitivity and specificity as well as area under the curve (AUC) and 95% CI were determined. Statistical analyses were conducted using SAS System software (version 9.3, SAS Institute Inc., Cary, NC, USA) and Analyse-it (version 2.26, Analyse-it Software, Ltd., Leeds, United Kingdom).
Biomarker combinations
The algorithm developed investigated the discriminative power of five biomarkers in the following manner: two- and three-biomarker combinations were examined with a linear classification model with two optimization methods (linear model – linear value; linear model – log value). Either the original values or the log values of the biomarkers were treated as independent variables of a predictive model and the output of the model was an algorithm-derived numerical score indicating the severity of OSA.
Results
Study population characteristics
Two-hundred and sixty-four male subjects were enrolled in this study. Patients with AHI ≥5 were considered to have OSA (n=221), and patients with AHI <5 were enrolled as the Non-OSA control group (n=31; median age 38; median BMI 29). Furthermore, an uncomplicated asymptomatic clinical population was enrolled as a healthy control group (n=12; median age 37 years; median BMI 24) in whom occult OSA was excluded, in order to replicate findings from the feasibility trial (n=20 healthy controls) that correlated biomarkers with severity of disease. Study population characteristics stratified by diagnosis are shown in . In this study population, 48% reported daytime sleepiness (ESS >10), 97% had a STOP-Bang score ≥3, and 72% had a STOP-Bang score ≥5.
Table 1 Study population characteristics by diagnosis
Biomarkers and measures of OSA severity: correlations
The most significant associations of biomarkers with OSA severity indices were for CRP and HbA1c. Specifically, statistically significant correlations were observed for CRP vs AHI (r=0.40, p<0.0001), CRP vs minimum oxygen saturation (r=–0.36, p<0.0001) and CRP vs sleep time with oxygen saturation ≤90% (r=0.41, p<0.0001). Significant results were also observed for HbA1c vs AHI (r=0.29, p<0.0001), HbA1c vs minimum oxygen saturation (r=–0.31, p<0.0001), and HbA1c vs sleep time with oxygen saturation ≤90% (r=0.28, p<0.0001). Moreover, statistically significant correlations were observed for EPO vs AHI (r=0.17, p=0.008), EPO vs minimum oxygen saturation (r=–0.17, p=0.008), and EPO vs sleep time with oxygen saturation ≤90% (r=0.16, p=0.02).
Probability of moderate/severe OSA using CRP and HbA1c in combination
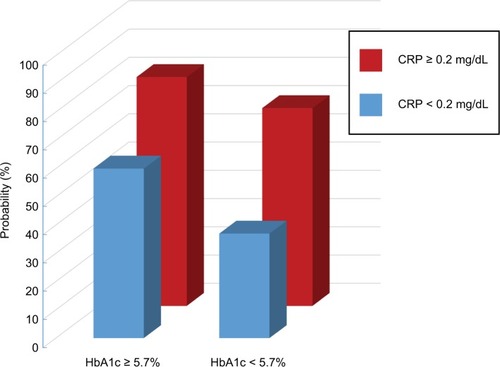
The probabilities of moderate/severe OSA by CRP and HbA1c values in combination are shown in . The predictive value is additive when CRP and HbA1c are combined. When CRP ≥0.2 mg/dL and HbA1c ≥5.7%, the probability was 81%. When neither marker was elevated, the probability was 37%. When only one of the two markers was elevated (but not both), the probability was 60% to 70%.
Figure 1 Probability of moderate/severe OSA by CRP and HbA1c values in combination.
Abbreviations: CRP, C-reactive protein; OSA, obstructive sleep apnea.
ROC curve analysis and AUC
The ROC AUCs for the five individual biomarkers are shown in . The strongest predictors of OSA were CRP and HbA1c.
Table 2 Comparison of ROC AUCs for OSA: biomarkers and clinical measures
Biomarker combinations
Algorithms generated potentially promising combinations of markers. A weighted linear combination (hereafter referred to as “HbA1c+CRP+EPO”) with the formula 12.81*log(HbA1c) + 0.75*log(CRP) + 1.53*log(EPO) (Note: CRP units are mg/dL, and “log” refers to log base 10), yielded a 0.06 increase in AUC (0.78 [95% CI 0.71–0.86]) over individual markers (HbA1c 0.68 [95% CI 0.61–0.76]; CRP 0.72 [95% CI 0.63–0.81]; and EPO 0.67 [95% CI 0.58–0.76]) for detection of OSA.
This validates the results of our feasibility study which demonstrated that a combination of markers provides superior diagnostic utility to individual markers alone; the feasibility study found that the combination HbA1c+CRP+EPO yielded a 0.07 increase in AUC (0.82 [95% CI 0.72–0.91]) over individual markers (HbA1c 0.74 [95% CI 0.63–0.86]; CRP 0.67 [95% CI 0.55–0.80]; and EPO 0.68 [95% CI 0.55–0.80]) for detection of OSA. A similar pattern of results, with the biomarker combination yielding a higher AUC than the individual markers, was observed for detection of moderate/severe OSA.Citation27
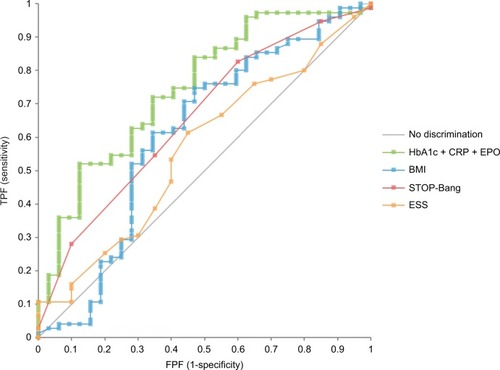
shows that the point estimate for the AUC for the combination of three markers in the current study (0.78) was higher than all individual biomarkers, STOP-Bang (0.70), and ESS (0.53) scores, and all clinical measures apart from BMI (0.78). However, in non-obese subjects (BMI<30, n=109), the combination of biomarkers (0.75) was higher than BMI (0.61), as well as the STOP-Bang (0.66) and ESS (0.56) scores ().
Figure 2 ROC curves for detection of OSA in non-obese subjects (BMI <30).
Abbreviations: AUC, area under the curve; BMI, body mass index; BP, blood pressure; CRP, C-reactive protein; EPO, erythropoietin; ESS, Epworth Sleepiness Scale; FPF, false positive fraction; OSA, obstructive sleep apnea; ROC, receiver operating characteristic; TPF, true positive fraction.
The combination of three markers performed comparably in asymptomatic (ESS≤10, n=144; AUC 0.76) and symptomatic (ESS >10, n=120; AUC 0.73) patients.
Sensitivity, specificity, and cutoff for detection of OSA
The combined biomarkers correctly identified a greater percentage of OSA patients (sensitivity) and non-OSA patients (specificity) compared to the ESS and STOP-Bang questionnaires. Defining the optimal cutoff as one that yields approximately 80% sensitivity, the following sensitivity and specificity results, respectively, were obtained for HbA1c+CRP+EPO (81% and 60%), ESS (78% and 19%), and STOP-Bang (75% and 52%). Furthermore, HbA1c+CRP+EPO provided comparable sensitivity and higher specificity compared to BMI in all subjects (81% and 56%), and particularly in non-obese subjects (81% and 38%). The biomarker combination weighted formula HbA1c+CRP+EPO cutoff that yielded these results is 9.95.
Defining optimal cutoffs as those commonly used in clinical practice, shows measures of diagnostic test performance for key parameters.
Table 3 Measures of diagnostic test performance for key parameters
Correlation with severity of disease
The combination of three biomarkers increased with increasing severity of disease. HbA1c+CRP+EPO median values (IQR) were as follows: Controls 9.47 (9.30–9.91), Non-OSA 9.90 (9.49–10.35), Mild-OSA 10.28 (9.74–10.75), Moderate-OSA 10.50 (10.00–10.83), and Severe-OSA 10.74 (10.34–11.62) (p<0.0001 for all).
Correlation coefficients were calculated to evaluate the relationship between the HbA1c+CRP+EPO biomarker combination and measures of OSA severity (AHI, minimum oxygen saturation, and percentage cumulative sleep time with oxygen saturation <90%). Significant correlations were observed (r=0.40 p<0.0001; r=−0.40 p<0.0001; r=40 p<0.0001) for all three measures of severity.
Odds ratios
Multivariate logistic regression models tested the association between possible risk factors and OSA. Unadjusted statistically significant predictors of OSA included age (OR 2.58, p=0.035), BMI (OR 4.31, p=0.0005), and HbA1c+CRP+EPO (OR 5.18, p<0.0001). In multiple logistic regression models adjusted for age and BMI, HbA1c+CRP+EPO remained significantly associated with OSA (OR 3.36, p=0.005) whereas the adjusted OR for age was 1.97 (p=0.16) and BMI was 3.41 (p=0.005).
Discussion
The objective of this multicenter prospective study was to evaluate the use of blood biomarkers, individually and in combination, to screen for OSA in adult men, to test the hypothesis that clusters of biomarkers may provide a characteristic signature of OSA. This validation study was conducted in order to replicate findings from a prior feasibility study.Citation27 When using biomarker panels and algorithms, reproducibility is essential to establishing the correct biomarkers and formulas. Two studies were required in two independent cohorts – a feasibility study and a validation study. The earlier feasibility study served to generate a hypothesis, and the current validation study is the pivotal trial demonstrating reproducibility of results and establishing the relevant combination of biomarkers and the algorithm formula.
We found that the most predictive individual OSA biomarkers were CRP and HbA1c, replicating findings from the earlier feasibility study.Citation27 The ROC curve analysis for HbA1c and CRP found that these individual biomarkers showed an advantage over existing OSA screening tools, particularly the ESS questionnaire (AUCs 0.68, 0.72, and 0.53, respectively). Furthermore, we demonstrate that a combination of HbA1c+CRP+EPO yielded a higher AUC (0.78) than individual markers alone and was more predictive than ESS (0.53) and STOP-Bang (0.70) questionnaires. The diagnostic utility of the combination biomarker persisted after adjusting for age, BMI, and subjective sleepiness. Thus, our identified combination biomarker provides greater diagnostic utility than common OSA screening questionnaires, and may assist primary care providers in identifying at-risk patients requiring sleep study referral.
OSA is a highly prevalent medical condition that remains underdiagnosed. The AASM reports blood biomarkers may be useful in identifying individuals at risk for OSA.Citation12 Implementation of OSA biomarker screening by primary care providers in high-risk populations could significantly improve the accuracy of sleep specialist referrals and ultimately improve patient outcomes.Citation29 The biomarker combination correlates with OSA severity, with concomitant elevation of HbA1c and CRP indicating a high probability of moderate/severe OSA (81%); this probability fell to less than half (37%) when neither marker was elevated. Use of the HbA1c+CRP+EPO biomarker combination (higher values indicate more serious disease), and use of probability estimates from HbA1c and CRP, provides two methods to identify more serious moderate/severe disease. The AUC for the combination of markers (0.78) was higher than all clinical measures except for BMI (0.78). However, in non-obese subjects (BMI<30), the combination of biomarkers (0.75) was higher than BMI (0.61), STOP-Bang (0.66), and ESS (0.56) scores. Given that one-third to one-half of patients ultimately diagnosed with OSA are not obese,Citation30,Citation31 up to 90% of individuals with OSA remain undiagnosed,Citation2–Citation5 and 34% of men have this disorder;Citation1 a successful screening test such as the combination biomarker that identifies non-obese men with OSA would represent a major opportunity to improve the diagnosis of millions of men with this highly prevalent condition. Future studies examining this non-obese population in detail would further validate our findings. Prior studies lend support to our results and have reported inflammatory biomarkers to be significantly higher in OSA patients independent of obesity.Citation32
Our study is the first to comprehensively assess the diagnostic accuracy of a novel combination of blood biomarkers in identifying patients with suspected OSA. Although the markers with the highest predictive value (HbA1c, CRP, and EPO) in our study have previously been associated individually with OSA, they have not been evaluated as a signature cluster, and few prior studies report ROC analyses with sensitivity and specificity results.Citation18
The high diagnostic performance of these specific markers is not unexpected. Prior studies have reported independent associations between OSA, insulin resistance, and diabetes,Citation33 with mild to moderate elevations in HbA1c (≥5.7%) suggestive of prediabetes. Prediabetes is associated with disorders typically only considered with diabetes, such as cardiovascular disease, hypertension, and metabolic syndrome.Citation34 Elevated CRP levels (≥0.2 mg/dL) are associated with intermediate to high risk of heart disease, with reported independent associations between OSA and cardiovascular disease.Citation6 OSA-induced hypoxemia is associated with increased EPO concentrations,Citation25 and EPO decreases after continuous positive airway pressure (CPAP) therapy in those with OSA.Citation25,Citation35 Healthy individuals subjected to hypoxemia show increased EPO.Citation36 EPO promotes the formation of red blood cells; the mild EPO elevations (≥8 mIU/mL) observed in OSA patients in this study may represent a response to hypoxemia. Therefore, there is a biological plausibility for including EPO in the biomarker panel for OSA.
Study limitations
Our study results provide a new potential methodology to improve the accuracy of screening for OSA, and suggest areas for further research. Studies in large cohorts, particularly population-based studies, are required to further validate our study findings, and to evaluate the diagnostic utility in additional patient subgroups, including women. These larger studies could also evaluate biomarker algorithms incorporating additional clinical data such as BMI, snoring, and sleepiness. In addition, monitoring studies may be useful to assess the utility of the individual biomarkers and a combination of biomarkers in measuring compliance and response to therapy. Health economic studies assessing the cost-effectiveness of biomarker screening in broader populations, and whether the biomarker results motivate patients to follow up with a sleep study referral, may also be useful.
Conclusion
OSA-associated blood biomarkers in combination provide a new approach to screening for OSA. The biomarker combination HbA1c+CRP+EPO was diagnostically superior to ESS and tended to be more predictive than the STOP-Bang questionnaire. In non-obese subjects (up to 50% of OSA patients are non-obese), the biomarker combination was superior to BMI in predicting OSA. The combination performed well in both asymptomatic and symptomatic patients. The results of this study verify our hypothesis and replicate findings from a prior feasibility study in an independent cohort that show OSA is associated with a characteristic signature cluster of biomarker changes. As mentioned in Study Limitations, population-based studies would assist with validation of the algorithm before use in general medical practice. Concurrent elevations of HbA1c, CRP, and EPO levels should generate a high index of OSA suspicion and, thus, may be useful as an initial OSA screening tool, which could subsequently lead to a sleep study referral. Combinations of biomarkers correlate with severity of disease and, therefore, may also assist sleep centers in identifying and triaging higher risk patients for sleep study diagnosis and treatment.
Acknowledgments
The authors are grateful to the sleep center staff for their expertise and technical assistance in data collection and participation in the study. Beckman Coulter has a patent pending: Obstructive Sleep Apnea (OSA) Biomarker Panel.
Supplementary material
Table S1 Full title of each ethical review board, and its affiliated institution
Disclosure
This work was supported by research grant funding from Beckman Coulter, Inc. (Brea, CA, USA) provided to the respective institutions of Drs. Fleming, Holty, Bogan, Hwang, Ferouz-Colborn, Budhiraja, Redline, Mensah-Osman, Osman, and Li. Drs. Samoszuk, Riley, and Southwick, as well as Ms. Cruz, Mr. Bai, and Mr. Lu are employed by Beckman Coulter. Dr. Azad and Ms. Podolak report no conflicts of interest in this work.
References
- PeppardPEYoungTBarnetJHPaltaMHagenEWHlaKMIncreased prevalence of sleep-disordered breathing in adultsAm J Epidemiol201317791006101423589584
- WatsonNFHealth care savings: the economic value of diagnostic and therapeutic care for obstructive sleep apneaJ Clin Sleep Med20161281075107727448424
- BousquetJKhaltaevNWorld Health OrganizationGlobal surveillance, prevention and control of chronic respiratory diseases: a comprehensive approachGenevaWHO2007 Available from: http://www.who.int/gard/publications/GARD%20Book%202007.pdfAccessed February 03, 2018
- KapurVStrohlKPRedlineSIberCO’ConnorGNietoJUnderdiagnosis of sleep apnea syndrome in U.S. communitiesSleep Breath200262495412075479
- YoungTEvansLFinnLPaltaMEstimation of the clinically diagnosed proportion of sleep apnea syndrome in middle-aged men and womenSleep19972097057069406321
- St-OngeMPGrandnerMABrownDAmerican Heart Association Behavior Change, Diabetes, and Nutrition Committees of the Council on Lifestyle and Cardiometabolic HealthCouncil on Cardiovascular Disease in the YoungCouncil on Clinical CardiologyStroke CouncilSleep duration and quality: impact on lifestyle behaviors and cardiometabolic health: a scientific statement from the American Heart AssociationCirculation2016134367386
- RedlineSScreening for obstructive sleep apnea: implications for the sleep health of the populationJAMA2017317436837028118433
- BudhirajaRBudhirajaPQuanSFSleep-disordered breathing and cardiovascular disordersRespir Care201055101322133220875159
- PunjabiNMCaffoBSGoodwinJLSleep-disordered breathing and mortality: a prospective cohort studyPLoS Med200968e100013219688045
- AuroraRNPunjabiNMObstructive sleep apnoea and type 2 diabetes mellitus: a bidirectional associationLancet Respir Med20131432933824429158
- RedlineSYenokyanGGottliebDJObstructive sleep apnea-hypopnea and incident stroke: the sleep heart health studyAm J Respir Crit Care Med2010182226927720339144
- KapurVKAuckleyDHChowdhuriSClinical practice guideline for diagnostic testing for adult obstructive sleep apnea: an American Academy of Sleep Medicine clinical practice guidelineJ Clin Sleep Med201713347950428162150
- KapurVBloughDKSandblomREThe medical cost of undiagnosed sleep apneaSleep199922674975510505820
- KakkarRKBerryRBPositive airway pressure treatment for obstructive sleep apneaChest200713231057107217873201
- KapurVKObstructive sleep apnea: diagnosis, epidemiology, and economicsRespir Care20105591155116720799998
- SuraniSRDiabetes, sleep apnea, obesity and cardiovascular disease: Why not address them together?World J Diabetes20145338138424936259
- QaseemADallasPOwensDKStarkeyMHoltyJEShekellePClinical Guidelines Committee of the American College of PhysiciansDiagnosis of obstructive sleep apnea in adults: a clinical practice guideline from the American college of physiciansAnn Intern Med2014161321022025089864
- De Luca CantoGPachêco-PereiraCAydinozSMajorPWFlores-MirCGozalDBiomarkers associated with obstructive sleep apnea: a scoping reviewSleep Med Rev201523284525645128
- MaederMTMuellerCSchochODAmmannPRickliHBiomarkers of cardiovascular stress in obstructive sleep apneaClin Chim Acta201646015216327380998
- MontesiSBBajwaEKMalhotraABiomarkers of sleep apneaChest2012142123924522796846
- De Luca CantoGPachêco-PereiraCAydinozSMajorPWFlores-MirCGozalDDiagnostic capability of biological markers in assessment of obstructive sleep apnea: a systematic review and meta-analysisJ Clin Sleep Med2015111273625325575
- PapanasNSteiropoulosPNenaETzouvelekisAMaltezosETrakadaGBourosDHbA1c is associated with severity of obstructive sleep apnea hypopnea syndrome in nondiabetic menVasc Health Risk Manag2009575175619774216
- PunjabiNMBeamerBAC-reactive protein is associated with sleep disordered breathing independent of adipositySleep2007301293417310862
- YokoeTMinoguchiKMatsuoHElevated levels of C-reactive protein and interleukin-6 in patients with obstructive sleep apnea syndrome are decreased by nasal continuous positive airway pressureCirculation200310781129113412615790
- WinnickiMShamsuzzamanALanfranchiPErythropoietin and obstructive sleep apneaAm J Hypertens200417978378615363820
- HirotsuCTufikSGuindaliniCMazzottiDRBittencourtLRAndersenMLAssociation between uric acid levels and obstructive sleep apnea syndrome in a large epidemiological samplePLoS One201386e6689123826169
- FlemingWEFerouz-ColbornASamoszukMKBlood biomarkers of endocrine, immune, inflammatory, and metabolic systems in obstructive sleep apneaClin Biochem2016491285486127184708
- BerryRBBrooksRGamaldoCEAmerican Academy of Sleep MedicineThe AASM Manual for the Scoring of Sleep and Associated Events: Rules, Terminology and Technical Specifications. Version 2.3Darien, ILAmerican Academy of Sleep Medicine2016
- AuroraRNQuanSFQuality measure for screening for adult obstructive sleep apnea by primary care physiciansJ Clin Sleep Med20161281185118727397659
- PunjabiNMSorkinJDKatzelLIGoldbergAPSchwartzARSmithPLSleep-disordered breathing and insulin resistance in middle-aged and overweight menAm J Respir Crit Care Med2002165567768211874813
- VgontzasANPapanicolaouDABixlerEOSleep apnea and daytime sleepiness and fatigue: relation to visceral obesity, insulin resistance and hypercytokinemiaJ Clin Endocrinol Metab20008531151115810720054
- ThunströmEGlantzHFuMIncreased inflammatory activity in nonobese patients with coronary artery disease and obstructive sleep apneaSleep201538346347125325463
- BotrosNConcatoJMohseninVSelimBDoctorKYaggiHKObstructive sleep apnea as a risk factor for type 2 diabetesAm J Med2009122121122112719958890
- BuysschaertMMedinaJLBergmanMShahALonierJPrediabetes and associated disordersEndocrine201548237139325294012
- CahanCDeckerMJArnoldJLGoldwasserEStrohlKPErythropoietin levels with treatment of obstructive sleep apneaJ Appl Physiol (1985)1995794127812858567573
- KnauppWKhilnaniSSherwoodJScharfSSteinbergHErythropoietin response to acute normobaric hypoxia in humansJ Appl Physiol (1985)19927338378401400046