Abstract
Background
Sleep health questionnaires are often employed as a first assessment step for sleep pathology. The Epworth Sleepiness Scale (ESS) and the Pittsburgh Sleep Quality Index (PSQI) are two commonly employed questionnaire instruments. Aspects of sleep health may be measured differently depending on choice of instrument.
Objectives
In a patient population at high risk for sleep disorders, referred for polysomnography (PSG), we evaluated the level of association between results from these two instruments. Questionnaire results were also compared with measured PSG parameters.
Methods
Records of patients undergoing overnight PSG in the sleep laboratory between February–June 2011 were retrospectively reviewed for eligibility. Inclusion criteria were met by 236 patients. PSQI and ESS scores, demographic information, and PSG data were extracted from each record for analysis. Four subgroups based on normal/abnormal values for ESS and PSQI were evaluated for between-group differences.
Results
Of 236 adult participants, 72.5% were male, the mean age was 52.9 years (13.9), mean body mass index (BMI) 34.4 kg/m2 (8.3), mean ESS 9.0 (4.8; range: 0–22), PSQI mean 8.6 (4.2; range: 2–19). The Pearson correlation coefficient was r = 0.13 (P = 0.05) for association between ESS and PSQI. Participants with an abnormal ESS were more likely to have an abnormal PSQI score (odds ratio 1.9 [1.1–3.6]; P = 0.03). Those with an abnormal ESS had higher BMI (P = 0.008) and higher apnea–hypopnea indexes (AHI) (P = 0.05). Differences between the four subgroups were observed for BMI and sex proportions, but not for AHI.
Conclusions
We observed limited association between these two commonly used questionnaire instruments, the ESS and the PSQI. These two questionnaires appear to evaluate different aspects of sleep. In terms of clinical application, for global assessment of patients with sleep problems, care should be taken to include instruments measuring different facets of sleep health.
Introduction
Primary sleep disorders are an increasing public health concern and are definitively diagnosed by polysomnography (PSG). However, as access to PSG may be limited, sleep health questionnaires are often employed as a first assessment step.Citation1
Two commonly employed sleep health assessment questionnaires are the Epworth Sleepiness Scale (ESS) and the Pittsburgh Sleep Quality Index (PSQI).Citation2,Citation3 These instruments are utilized as general measures of sleep health and daytime dysfunction, and are not specific for any single primary sleep disorder. Both the ESS and the PSQI have been widely translated and employed in a wide range of both population-based and clinical studies.Citation4–Citation7 However, there have been few studies examining the relationship between the two instrument measures.
An evaluation in a general adult community population by Buysse et al,Citation8 demonstrated little association between the ESS and PSQI. The PSQI score was also not found to be associated with specific PSG measures. Patient subgroups were examined based on combinations of normal/abnormal PSQI and ESS scores for association with objective measures. In this general population, these questionnaire aggregates did not strongly associate with PSG findings.
In this present study we apply these questionnaires, the ESS and PSQI, to a population referred for PSG, with a high probability of sleep pathology. Our objectives were to compare PSQI and ESS scores in this high-risk population and evaluate the level of association between these two questionnaire instrument results. We hypothesize the level of association between these questionnaires would be high in such a sleep laboratory referral population. Further, we evaluate whether PSQI/ESS score aggregate-based subgroups in this referral population would exhibit differences in objective PSG characteristics.
Methods
Records of 367 consecutive patients studied by PSG in a university sleep disorders laboratory between February 2011 and June 2011 were retrospectively reviewed for inclusion in this study. Referrals to the sleep laboratory were restricted to select physicians trained in sleep medicine. All patients attending the sleep laboratory were requested to complete standard questionnaires, which include the PSQI, and the ESS. A total of 236 patients met the study inclusion criteria which included age 18 years or older, and appropriate completion of the PSQI and ESS questionnaires. Charts were excluded if the ESS or PSQI questionnaires were incomplete.
The PSQI is a seven domain (19 item) self-rated questionnaire evaluating usual sleep habits during the last month. The seven domain scores including: subjective sleep quality, sleep latency, sleep duration, sleep efficiency, daytime dysfunction, sleep fragmentation, and use of sleep aid medications; combine to provide a global sleep quality index score. The possible scores range from 0–21, with greater than five indicative of impaired sleep quality.Citation3
The ESS is an eight-item assessment of somnolence, with possible scores from 0 to 24. A score of over 10 is considered to be abnormal.Citation2
The PSQI and ESS have been demonstrated to be stable measures over time in early middle-aged adults, and have been recently validated in older men.Citation9,Citation10
The sleep laboratory charts were reviewed by a single researcher (PM), using a standardized data collection form. Questionnaire scores for the PSQI and ESS were extracted from the charts, as well as demographic data including: age, sex, and body mass index (BMI). PSG objective measures including: apnea hypopnea index (AHI), apnea index (AI), respiratory effort-related arousals (RERA), and sleep efficiency (SE: time asleep/total time in bed) were also recorded for each patient.
Patients were studied overnight in the sleep lab using the standard 15 channel PSG (version 8.0, sleep diagnostic software; Sandman Elite, Ottawa, Canada). Established protocols were used for all PSG studies.Citation11 This included electroencephalogram (EEG, 3 channel), electrooculogram (2 channels), electromyogram (chin and leg), electrocardiogram, heart rate, snoring, thermistor airflow, nasal pressure airflow, oxygen saturation, chest wall motion, and abdomen motion.
Institutional ethics approval was obtained for this study, which complied with the Declaration of Helsinki.
Statistical methods
We checked variables regarding assumptions underlying the use of parametric and nonparametric statistics, and analyzed accordingly. Descriptive statistics were used to characterize global PSQI scores, ESS scores, demographics, and PSG measures of sleep continuity. Pearson correlation coefficients were calculated to examine the correlation between quantitative variables. We performed Student’s t-test, analyses of variance (ANOVA) for normally distributed variables (BMI, age, ESS, SE, and PSQI), Wilcoxon and Kruskal-Wallis tests for nonnormally distributed variables (AHI, AI, arousing periodic limb movements (APLM), and RERA). Chi-square test was used to examine the association between categorical variables. Cronbach’s alpha was utilized to evaluate internal questionnaire consistency in the study population.Citation12
Published cut-off scores (>5 on the PSQI, >10 on the ESS)Citation2,Citation3 for each instrument were used to create four subgroups that had higher scores on each, normal scores on each, or one higher, and one normal score. ANOVA and Kruskal-Wallis test were conducted to find differences in means/medians among these subgroups for demographics and PSG measures. Chi-square test was used to find association between these subgroups and sex, BMI category. Data were analyzed using SAS software (v 9.3; SAS Cary, NC, USA). The level of significance was set at 0.05 (two-tailed). For sample size estimation, based on the previous study of Buysse et al,Citation8 reporting correlation of PSQI and ESS of r = 0.16, with the assumption of a correlation of r = 0.15 with alpha of 0.05 and beta of 0.20, the study required a minimum sample of n = 173 participants.
Results
Measured parameters within the study population are detailed in . Of the 236 patients, the male:female proportions were 72.5% (n = 171): 27.5% (n = 65). There were no statistically significant differences in age (P = 0.32) or BMI (P = 0.30) between sex groups.
Table 1 Measured parameters within the study population
As an assessment of internal consistency, Cronbach’s alpha equaled 0.83 and 0.74 for the ESS and PSQI instruments respectively in this study sample. This represents good-to-acceptable levels of internal consistency.Citation12
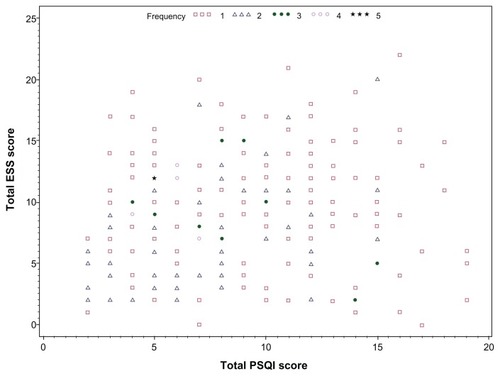
Associations were examined between the two sleep questionnaire scores. Correlations were weak with Pearson correlation coefficient (r = 0.13; P = 0.05) between the ESS and PSQI scores. ESS and PSQI raw scores in this population are illustrated by scatterplot (). If the daytime dysfunction domain of the PSQI is not considered in the collated score, the association with the ESS is further weakened (r = 0.05; P = 0.43). In isolation, the daytime dysfunction scale score correlates moderately well with the ESS (r = 0.42; P < 0.0001). Additionally, associations were examined between the ESS, PSQI, and PSG measures. The AHI is particularly relevant in the diagnosis of obstructive sleep apnea (OSA). Between AHI and PSQI (r = −0.12; P = 0.07) and between AHI and ESS (r = 0.13; P = 0.046).
Figure 1 Scatterplot of PSQI and ESS scores.
Comparison by category, normal/abnormal as illustrated in , provides an odds ratio of 1.9 (P = 0.03) for having an abnormal PSQI with an abnormal ESS.
Table 2 Categorical comparisons
Of the female participants, 43.1% (28) had abnormal ESS > 10, and 86.1% (56) had abnormal PSQI > 5. In the male participants, 36.3% (62) had abnormal ESS and 64.9% (111) had abnormal PSQI scores. We examined the populations based on separate categorization by normal/abnormal PSQI and normal/ abnormal ESS ( and ). Covariate comparison between groups reveals no statistically significant differences in PSG measures between groups based on PSQI category. Comparison between groups based on ESS status demonstrates statistically significant differences in BMI, AHI, and APLM.
Table 3 Association of PSQI with PSG parameters
Table 4 Association of ESS with PSG parameters
We also considered potential differences between cluster groups for ESS and PSQI results. We divided the population into four groups: normal PSQI/normal ESS; normal PSQI/abnormal ESS; abnormal PSQI/normal ESS; and abnormal PSQI and abnormal ESS. Examining the population by these subgroups (), we observe statistically significant differences between groups for sex proportion, and mean BMI. There were no statistically significant differences observed between these subgroups for most PSG measured parameters.
Table 5 Comparison of empirically-defined PSQI/ESS subgroups
Discussion
In this retrospective chart review study of patients suspected of sleep disorder and referred for diagnostic polysomnographic testing, we found only weak correlation between ESS and PSQI scores.
The ESS gauges a respondent’s self-reported probability of falling asleep in eight common situations. These everyday situations include while sitting and reading, watching television, sitting inactive in a public place, as a passenger in a car for an hour, while lying down in the afternoon, while sitting and talking to another, sitting quietly after lunch, and in a car while stopped in traffic.Citation2 While the ESS score reflects subjective self-reported levels of sleepiness, an objective measure of sleepiness or hypersomnolence would be documentation of sleep latency by multiple sleep latency test (MSLT).Citation13 Previous investigators have reported correlations between ESS and MSLT-defined sleepiness with coefficients of between 0.03 and 0.86.Citation14–Citation16 Using survival analysis in a large population, Aurora et al have recently reported a clear association between the ESS score and the average sleep latency as objectively measured from MSLT diagnostic testing.Citation16 Interestingly, an ESS score of ≥13 was identified by Aurora as most effectively predicting objective sleepiness,Citation16 in contrast to the conventional threshold score of >10.Citation2
In this present study, the mean ESS score reported was 9 (range: 0–22). As a reflection of sleep health status, this subjective measure of sleepiness correlated only weakly with the PSQI (r = 0.13; P = 0.05). Examination of dichotomous categories of ESS and PSQI revealed an odds ratio of 1.9 (P = 0.03) for an individual with an abnormal (>10) ESS having an abnormal PSQI (>5). As obstructive sleep apnea was the most common suspected diagnosis in this referral population, the ESS association with AHI was examined, with an equally weak association observed (r = 0.13; P = 0.046). Participants with an ESS > 10 had statistically significantly higher BMIs and apnea hypopnea indexes consistent with OSA. These findings are consistent with those recently reported by Sil and Barr in a UK study of sleep laboratory patients.Citation17
The PSQI, in contrast to the ESS, evaluates subjective sleep quality over the previous month. The multidimensional sleep quality assessment predominantly gauges perceived nocturnal sleep quality with one component to address daytime dysfunction.Citation3 In this study population, we did observe that omitting the daytime dysfunction component weakened the correlation with the ESS scores (r = 0.05; P = 0.43). Previous investigators have reported the strong association of PSQI scores to depression and psychosocial stress.Citation18 The ESS has also been reported to have some association with depression instrument scores.Citation19 Benitez and Gunstad recently reported an independent relationship between PSQI domain scores and cognitive decrements impacting attention and executive functions.Citation20 It has been recognized that the PSQI may be influenced by various internal and also external factors, and may not always be associated with polysomnographic findings of a distinct primary sleep disorder such as abnormal AHI or periodic limb movements (PLMs).Citation21,Citation22 Kezirian et al found PSQI scores to be unassociated with measures of sleep disordered breathing severity in older men.Citation21 Neau et al recently reported lack of correlation in multiple sclerosis patients, between PSQI scores and results of objective assessments of vigilance and sleep.Citation23 In a nonclinical sample, PSQI scores correlated with depression scale results, but not with actigraphic measures of sleep.Citation24
In this current study, the mean PSQI score was 8.6 (range: 2–19). As previously mentioned, the correlation between the global PSQI score (including the daytime dysfunction component) and the ESS was weak (r = 0.13; P = 0.05). The distribution of ESS and PSQI scores in provides further illustration of the tenuous association. Examination of the relationship with AHI measurements from PSG also revealed a weak correlation (r = −0.12), which did not achieve statistical significance (P = 0.07). Participants with abnormal PSQI > 5 exhibited no statistically significant differences in PSG measures examined compared to those with normal PSQI scores.
In our aggregate sub-group comparison, the sex proportion and mean BMI exhibited between group differences. With the exception of the APLM index, which was relatively low frequency, the PSG measures were not statistically significantly different in these four groups categorized by normal/abnormal for ESS and PSQI.
This was a chart review study and therefore subject to the limitations inherent in a retrospective review. As the patient population was derived from a group referred for PSG, there is the risk of inclusion bias, both for men in whom sleep disorders are perhaps more readily questioned, and for those who may be more overtly symptomatic or aware of sleep problems. However, the generalizability of our findings to other populations may be questionable, although the observation of limited association between the PSQI and ESS is in keeping with the results from Buysse et al in a community-based population.Citation8 These observations in both these population samples do not denigrate the value of either questionnaire assessment, but further emphasize the disparity in the facet of sleep health under examination through each instrument.
In the assessment of between-group differences or associations in terms of polysomnographic measures, we acknowledge that there is the potential for a ‘first night effect’, which would potentially impact on PSG parameters, in particular, sleep efficiency. This concern would likely be a lesser issue for objective measures such as AHI.Citation25
In summary, in this retrospective study of high-risk patients referred for PSG, there was limited association observed between these two commonly used questionnaire instruments, the ESS and the PSQI. These two questionnaires appear to evaluate different aspects of sleep. In terms of clinical application, for global assessment of patients with sleep problems, care should be taken to include instruments measuring different facets of sleep health.
Acknowledgments
The authors gratefully acknowledge support from University of Saskatchewan Department of Medicine Research Fund. Prosanta Mondal was also supported by the Western Regional Training Centre for Health Services Research.
Disclosure
The authors report no conflicts of interest in this work.
References
- WellsMEVaughnBVPoor sleep challenging the health of a nationNeurodiagn J201252323324923019761
- JohnsMJA new method for measuring daytime sleepiness: the Epworth Sleepiness ScaleSleep1991145405451798888
- BuysseDJReynoldsCRIMonkTHBermanSRKupferDJThe Pittsburgh Sleep Quality Index: a new instrument for psychiatric practice and researchPsychiatry Res19892821932132748771
- BeiskeKKKjelsbergFNRuudEAStavemKReliability and validity of a Norwegian version of the Epworth Sleepiness ScaleSleep Breath2009131657218560916
- Sadeghniiat HaghighiKMontazeriAKhajej MehriziAThe Epworth Sleepiness Scale: translation and validation study of the Iranian versionSleep Breath2112012 [Epub ahead of print.]
- ShochatTTzischinskyOOksenbergAPeledRValidation of the Pittsburgh Sleep Quality Index Hebrew translation (PSQI-H) in a sleep clinic sampleIsr Med Assoc J200791285385618210924
- BertolaziANFagondesSCHoffLSValidation of the Brazilian Portuguese version of the Pittsburgh Sleep Quality IndexSleep Med2011121707521145786
- BuysseDJHallMLStrolloPJRelationships between the Pittsburg Sleep Quality Index (PSQI), Epworth Sleepiness Scale (ESS), and clinical/polysomnographic measures in a community sampleJ Clin Sleep Med20084656357119110886
- KnutsonKLRathouzPJYanLLLiuKLauderdaleDSStability of the Pittsburgh Sleep Quality Index and the Epworth Sleepiness Questionnaires over 1 year in early middle-aged adults: the CARDIA studySleep200629111503150617162998
- SpiraAPBeaudreauSAStoneKLReliability and validity of the Pittsburgh Sleep Quality Index and the Epworth Sleepiness Scale in older menJ Gerontol A Biol Sci Med Sci201267443343921934125
- IberCAncoli-IsraelSChessonAQuanSTfor the American Academy of Sleep MedicineThe AASM Manual for the Scoring of Sleep and Associated Events: Rules, Terminology and Technical SpecificationsWestchester, PAAmerican Academy of Sleep Medicine2007
- BlandJMAltmanDGStatistics notes: Cronbach’s alphaBMJ19973145729055718
- ReynoldsCF3rdCoblePAKupferDJHolzerBCApplication of the multiple sleep latency test in disorders of excessive sleepinessElectroencephalogr Clin Neurophysiol19825344434526175506
- ChervinRDAldrichMSThe Epworth Sleepiness Scale may not reflect objective measures of sleepiness or sleep apneaNeurology1999521251319921859
- KomadaYInoueYMukaiJShirakawaSTakahashiKHondaYDifference in the characteristics of subjective and objective sleepiness between narcolepsy and essential hypersomniaPsychiatry Clin Neurosci20055919419915823167
- AuroraRNCaffoBCrainiceanuCPunjabiNMCorrelating subjective and objective sleepiness: revisiting the association using survival analysisSleep201134121707171422131609
- SilABarrGAssessment of predictive ability of Epworth scoring in screening of patients with sleep apneaJ Laryngol Otol2011126437237922152589
- SelviYAydinABoysanMAtliAAgargunMYBesirogluLAssociations between chronotype, sleep quality, suicidality, and depressive symptoms in patients with major depression and healthy controlsChronobiol Int2010279–101813182820969525
- IshmanSLCaveyRMMettelTLGourinCGDepression, sleepiness, and disease severity in patients with obstructive sleep apneaLaryngoscope2010120112331233520939075
- BenitezAGunstadJPoor sleep quality diminishes cognitive functioning independent of depression and anxiety in healthy young adultsClin Neuropsychol201226221422322335237
- KezirianEJHarrisonSLAncoli-IsraelSBehavioral correlates of sleep-disordered breathing in older menSleep200932225326119238813
- GjevreJATaylor-GjevreRMNairBVLimHJDo sleepy rheumatoid arthritis patients have a sleep disorder?Musculoskeletal Care5112012 [Epub ahead of print.]
- NeauJPPaquereauJAucheVSleep disorders and multiple sclerosis: a clinical and polysomnography studyEur Neurol201268181522627080
- GrandnerMAKripkeDFYoonIYYoungstedtSDCriterion validity of the Pittsburgh Sleep Quality Index: Investigations in a non-clinical sampleSleep Biol Rhythms20064212913922822303
- MoskoSSDickelMJAshurstJNight to night variability in sleep apnea and sleep-related periodic movements in the elderlySleep1988113403483206054