
Abstract
Objective
To investigate the changes in the wavelet entropy during wake and different sleep stages in patients with insomnia disorder.
Methods
Sixteen patients with insomnia disorder and sixteen normal controls were enrolled. They underwent scale assessment and two consecutive nights of polysomnography (PSG). Wavelet entropy analysis of electroencephalogram (EEG) signals recorded from all participants in the two groups was performed. The changes in the integral wavelet entropy (En) and individual-scale wavelet entropy (En(a)) during wake and different sleep stages in the two groups were observed, and the differences between the two groups were compared.
Results
The insomnia disorder group exhibited lower En during the wake stage, and higher En during the N3 stage compared with the normal control group (all P < 0.001). In terms of En(a), patients with insomnia disorder exhibited lower En(a) in the β and α frequency bands during the wake stage compared with normal controls (β band, P < 0.01; α band, P < 0.001), whereas they showed higher En(a) in the β and α frequency bands during the N3 stage than normal controls (β band, P < 0.001; α band, P < 0.001).
Conclusion
Wavelet entropy can reflect the changes in the complexity of EEG signals during wake and different sleep stages in patients with insomnia disorder, which provides a new method and insights about understanding of pathophysiological mechanisms of insomnia disorder. Wavelet entropy provides an objective indicator for assessing sleep quality.
Introduction
Sleep accounts for approximately one-third of human life, and sleep plays a crucial role in the physiological mechanisms of humans. Epidemiological studies have shown that the prevalence of insomnia in industrialized nations is at least 5% to 10%.Citation1,Citation2 Insomnia seriously affects people’s quality of life, and poses a great challenge to public health and safety. Insomnia can lead to excessive daytime sleepiness, emotional instability, and may also trigger a series of health problems such as depression, anxiety, cognitive decline, and an increased risk of chronic diseases.Citation3–5 Insomnia disorder is defined as a subjective report of dissatisfaction with the sleep duration and/or quality, despite adequate opportunities and circumstances for sleep, which impacts daytime social functioning.Citation6 Currently, clinical diagnosis of insomnia disorder relies primarily on patients’ subjective complaints.
The widespread use of polysomnography (PSG) technique contributes to a more objective and standardized diagnosis of insomnia disorder. Patients with insomnia disorder present changes in sleep architecture, such as prolonged sleep latency, reduced sleep efficiency, increased number of arousal, and decreased time spent during deep sleep, but these changes still cannot perfectly reflect the true sleep quality. The mechanisms of insomnia disorder are still unclear. Hyperarousal, as a key component of insomnia disorder, has become a hot spot for researchers to study the mechanisms of insomnia disorder in recent years. Nofzinger et alCitation7 found that the brain structures regulating the sleep-wake cycle, such as the brainstem, hypothalamus, and basal forebrain, are abnormally overactive in insomnia patients during sleep. Changes in electroencephalogram (EEG) signals during the process of sleep-wake cycle may reflect sleep quality. In-depth investigation of the quantitative characteristics of sleep EEG is of great significance for the study of electrophysiological mechanisms of insomnia disorder and may also provide objective quantitative EEG parameters for the diagnosis and assessment of insomnia disorder.
Entropy is a physics concept of describing the degree of disorder in a thermodynamic system and direction of heat flow. It has been applied to the field of information, thus introducing the concept of information entropy. The brain is a highly complex nonlinear system. The use of entropy to characterize EEG signal complexity can provide insights into the dynamical mechanisms behind brain activity. There are many types of entropy, such as sample entropy, approximate entropy, and permutation entropy. In recent years, entropy has been applied in many medical fields such as disease diagnosis, assessment of pathophysiological mechanisms, intraoperative monitoring, and pharmacokinetics. Previous studies performed multi-scale entropy analysis of EEG signals from Alzheimer’s disease patients, and found reduced multi-scale entropy in these patients.Citation8,Citation9 The application of permutation min-entropy showed that the low-frequency band of EEG signals drove the complexity change during the sleep-wake state.Citation10 Some scholars found that entropy can reflect the change of consciousness state, and the response to anesthetics during anesthesia, which can be used as one of the indicators for monitoring intraoperative anesthesia.Citation11 Guo et alCitation12 found that the multi-scale permutation entropy values of EEG signals decreased significantly in patients with insomnia during the night they received sleep medication compared with the night they received placebo. Zhou et alCitation13 discovered significant differences in brain entropy between patients with chronic insomnia and healthy control groups.This disparity reflects changes in the intrinsic temporal regularity of brain activity in chronic insomnia patients, which may be associated with decreased sleep quality in patients with chronic primary insomnia. The entropy of different algorithms describes the complexity of the system from different perspectives.
The frequency, amplitude, and connectivity pattern of EEG activity evolve continuously through different stages of sleep, so analysis of EEG data has become an objective and convenient method to measure brain function and is an important basis for sleep staging. The sleep cycle is divided into two main stages: non-rapid eye movement (NREM) and rapid eye movement (REM). NREM sleep contains three substages: stage N1, stage N2, and stage N3.
Wavelet entropy is based on wavelet analysis, a method that decomposes non-stationary, non-linear EEG signals at each scale, thereby obtaining the probability of occurrence of EEG signals at each scale, known as individual-scale wavelet entropy (En(a)). The sum of the probabilities of EEG signals occurring at all scales is the integral wavelet entropy (En), reflecting the complexity of EEG signals.
In this study, we used the method of wavelet entropy to measure the complexity of EEG signals from patients with insomnia disorder and normal controls during wake and different sleep stages, compared the differences of En and En(a) between the two groups, investigated the nonlinear dynamic characteristics of EEG signals across wake and sleep in patients with insomnia disorder, and explored new EEG parameters that could be of potential usefulness in diagnosing and evaluating insomnia disorder.
Methods
Participants
A total of 16 patients with insomnia disorder who were admitted to the neurology outpatient clinics and neurology ward of Tianjin Union Medical Center were included. All patients were diagnosed with insomnia disorder, and met the following inclusion and exclusion criteria.
The inclusion criteria: (1) patients who met the diagnostic criteria for insomnia disorder in the Diagnostic and Statistical Manual for Mental Disorders, 5th edition published by the American Psychiatric Association,Citation14 with a disease duration ≥3 months, time of falling asleep lasting longer than 30 minutes at least 3 times per week or a subjective total sleep time ≤6 hours in night in the past month prior to admission; (2) patients who had an Insomnia Severity Index (ISI) score ≥10; (3) patients who had normal cognitive level, and were able to cooperate with the researcher to complete scale assessment and PSG examination; (4) patients who did not take sleep medications during the past month.
The exclusion criteria: (1) working across time zones or working night shifts during the past month; (2) severe internal medicine diseases, such as chronic heart, brain, lung, liver, kidney, and endocrine diseases; (3) previous history of epilepsy, schizophrenia, bipolar disorder, neurodevelopmental delay, and cognitive impairment; (4) smoking ≥10 cigarettes per day, drinking ≥14 units of alcohol per week (1 alcohol unit is equivalent to about 350 mL of beer with 5% alcohol content or 40 mL of hard liquor with 40% alcohol content or 150 mL of wine with 12% alcohol content), or history of toxic exposure; (5) previous history of sleep apnea, or history of restless leg syndrome and periodic leg movements; (6) a Hamilton Anxiety Rating (HAMA) Scale score >14, and a Hamilton Depression Rating (HAMD) Scale score ≥18.
A total of 16 healthy volunteers who had no complaints of insomnia, had an ISI score <7 and did not take medications that can affect sleep were enrolled as normal control group. The exclusion criteria for the normal control group were the same as for the patient group. The complete inclusion and exclusion criteria for the insomnia disorder patient group have been added to the Supplementary Material.
The study was approved by the Ethical Committee of Tianjin Union Medical Center (Approval number: 2023-B76). Written informed consent was obtained from all participants.
PSG Monitoring
All participants underwent PSG using a 36-channel PSG system (XLTEK, Natus Medical Inc, USA). The PSG system consisted of 6 scalp electrodes (F3, F4, C3, C4, O1, and O2), 2 electro-oculography electrodes, 2 chin electromyography electrodes, and 2 electromyography electrodes attached to the bilateral tibialis anterior muscles. A1 and A2 were used as standard reference electrodes. Thermal airflow, electrocardiograph, thoracic and abdominal movement, nasal pressure, and oxygen saturation were recorded simultaneously. EEG signals were, respectively, acquired from six channels including F3-A2, F4-A1, C3-A2, C4-A1, O1-A2, O2-A1, with the sampling rate being 200 Hz and the electrode impedance kept below 5 kΩ. All participants were monitored for more than 8 hours in a clean, tidy, quiet, and sound-proof EEG room using PSG. The intake of products with centrally excitatory effect such as tea, coffee, and alcohol was not allowed before and on the monitoring day. During the monitoring period, participants were not allowed to use their personal electronic devices. History-taking and installation of PSG equipment were performed by experienced EEG physicians. Patients with insomnia disorder and normal controls were both monitored by PSG for two consecutive nights. In order to avoid the first night effect, data only from the second night were used for analysis.
EEG Signals Analysis
Two EEG physicians analyzed the PSG data from participants of the two groups to identify the sleep stage according to the 2007 American Academy of Sleep Medicine criteria.Citation15 The 20-second epochs of stable, artifact-free EEG signals during the wake, N1, N2, N3, and REM stages were chosen, respectively. The chosen epochs of EEG signals were analyzed as data module with a window width of 1 second. The program to analyze the EEG signals was programmed by Microsoft Visual C++6.0. GraphPad Prism 8.0 software was used to form the graphs.
Wavelet Analysis
Gauss continuous wavelet transform (CWT) was used to process the EEG data. CWT is a method used for local analysis of non-stationary signals, which can extract local information at different scales from nonstationary signals by analyzing the correlation between the solitary wave at a certain scale and signals at the local position, thus allowing accurate representation of the EEG signals at each scale. CWT can be defined by the following formula:
where represents the family of wavelet functions, which is defined by translation and dilation (scale) of the mother wavelet by “b” and “a”, respectively, as:
In this study, the EEG signals were analyzed at multiple scales by CWT with minimum scale being 0.00075 s and scale magnification being 1.5. A total of 30 wavelet scales were analyzed. The correspondence between different wavelet scales and their central frequencies is shown in . In order to cover all the frequencies of the EEG signals, unfiltered raw EEG signals were used in this study with a wide range of frequencies being analyzed.
Table 1 The Correspondence Between Different Wavelet Scales and Their Central Frequencies
Power Spectrum Analysis
According to the wavelet coefficient, , the power P(a) of EEG signals f(t) at each individual scale was calculated to describe the strength of EEG signals at an individual scale. The total power P of EEG signals at all scales and the power
of EEG signals at an individual scale were calculated according to following formulas:
Wavelet Entropy Analysis
The En(a) and En were used as dimensionless parameters in this study and were calculated according to following formulas:
where En represents integral wavelet entropy of EEG signals from 6 channels and En(a) represents individual-scale wavelet entropy of EEG signals from 6 channels, without distinguishing EEG signals between the channels.
Statistical Analysis
SPSS version 25.0 software was used to perform statistical analysis. Non-normally distributed continuous variable was presented as median (M) and quartile range (QR). Categorical data were expressed as numbers. Comparison of normally distributed continuous variable between groups was performed by the Mann–Whitney test. Comparisons between multiple groups were performed using the Kruskal–Wallis test, and the results were corrected by Bonferroni. Categorical variable was compared by the chi-square (χ2) test. P < 0.05 indicated statistical significance.
Results
Demographic and Clinical Data of Participants in the Two Groups
As shown in , there was no statistically significant difference between the insomnia disorder and normal control groups in terms of gender and age (P > 0.05). All patients had being suffering from insomnia for 2 to 40 years (median, 15 years). The insomnia disorder group showed a significantly higher ISI score compared with the normal control group (P < 0.001).
Table 2 Demographic and Clinical Characteristics of Participants in the Two Groups
Comparison of Integral Wavelet Entropy During Wake and Different Sleep Stages in Normal Control Group
Wavelet entropy analysis of EEG signals during wake and different sleep stages revealed a higher En in the wake stage compared with other sleep stages in normal control group. The En was lowest in the N3 stage. The dynamic change trend of integral wavelet entropy in normal control group was shown in .
Figure 1 The change trend of integral wavelet entropy during wake and different sleep stages in normal control group.
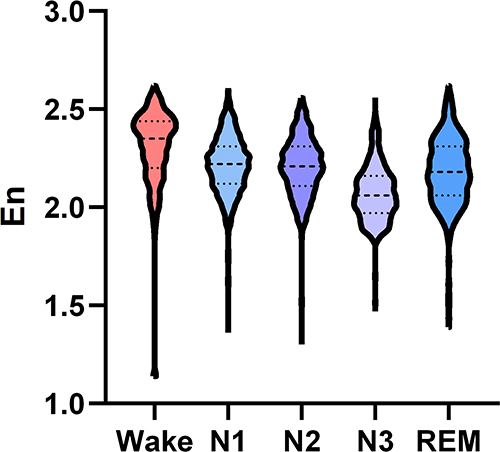
As shown in , the En differed significantly during wake and different sleep stages in normal control group (P < 0.001). The En was significantly higher in the wake stage compared with the N1, N2, N3, and REM stages (all P < 0.001). And higher En was also observed during the N1, N2, and REM stages compared with the N3 stage (all P < 0.001). There were significant differences between the N1 and REM stages (P < 0.001), as well as between the N2 and REM stages (P < 0.01), while no significant difference was noted between the N1 and N2 stages (P > 0.05).
Table 3 Comparison of Integral Wavelet Entropy During Wake and Different Sleep Stages in Normal Control Group
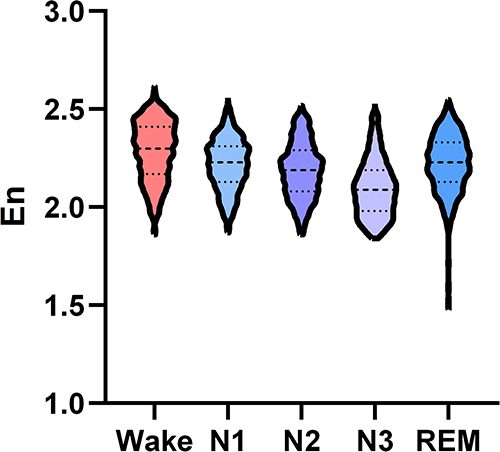
Comparison of Integral Wavelet Entropy During Wake and Different Sleep Stages in Insomnia Disorder Group
In insomnia disorder group, the En was highest in the wake stage, and lowest in the N3 stage (). As shown in , the En differed significantly during wake and different sleep stages in insomnia disorder group. The En was significantly higher in the wake stage compared with the N1, N2, N3, and REM stages (all P < 0.001), which was also higher during the N1, N2, and REM stages compared with the N3 stage (all P < 0.001). There were significant differences between the N1 and N2 stages, as well as between the REM and N2 stages (all P < 0.001), while no significant difference was noted between the N1 and REM stages (P > 0.05).
Table 4 Comparison of Integral Wavelet Entropy During Wake and Different Sleep Stages in Insomnia Disorder Group
Figure 2 The change trend of integral wavelet entropy during wake and different sleep stages in insomnia disorder group.
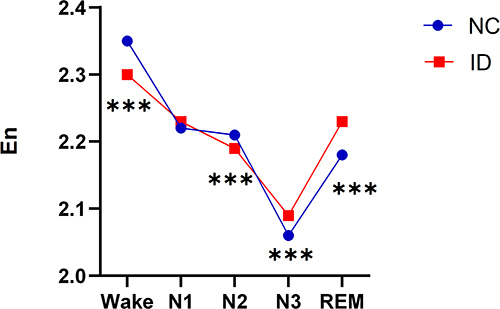
Differences in the Integral Wavelet Entropy During Wake and Different Sleep Stages Between the Insomnia Disorder and Normal Control Groups
The En during wake and different sleep stages between the insomnia disorder and normal control groups were further compared. The results showed that the insomnia disorder group exhibited lower En in the wake stage and higher En in the N3 stage compared with the normal control group (all P < 0.001, , ).
Table 5 The Comparison of Integral Wavelet Entropy During Wake and Different Sleep Stages Between the Insomnia Disorder and Normal Control Groups
Figure 3 Differences in the integral wavelet entropy during wake and different sleep stages between the insomnia disorder and normal control groups.
Differences in the Individual-Scale Wavelet Entropy During Wake and Different Sleep Stages Between the Two Groups
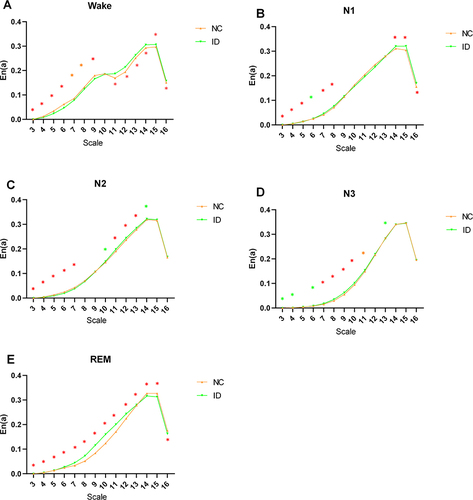
Wavelet entropy analysis of EEG signals at each individual scale was performed in order to explore the change in wavelet entropy at individual scale during wake and different sleep stages in the insomnia disorder and normal control groups. The results showed that in the wake stage, () the wavelet entropy of EEG signals at scales 3–9 was lower in the insomnia disorder group than the normal control group, whereas the wavelet entropy at scales 11–16 was higher in the insomnia disorder group than the normal control group. During N1 stage, () the wavelet entropy of scales 3–6 was higher in the normal control group compared to the insomnia disorder group, while the wavelet entropy of scales 7–8 and 14–16 was higher in the insomnia disorder group than in the normal control group. During N2 stage, () the wavelet entropy of scales 3–7 was higher in the normal control group compared to the insomnia disorder group, whereas the wavelet entropy of scales 10–14 was higher in the insomnia disorder group than in the normal control group. During the N3 stage, () the wavelet entropy at scales 6–11 was higher in the insomnia disorder group than the normal control group. During REM stage, () the wavelet entropy of scales 3–13 was higher in the insomnia disorder group compared to the normal control group, while the wavelet entropy of scales 14–16 was higher in the normal control group than in the insomnia disorder group.
Figure 4 (A-E) The differences at the individual-scale wavelet entropy during wake and different sleep stages between the insomnia disorder and normal control groups.
Comparison of Individual-Scale Wavelet Entropy in Different EEG Frequency Bands During Wake and Different Sleep Stages Between the Two Groups
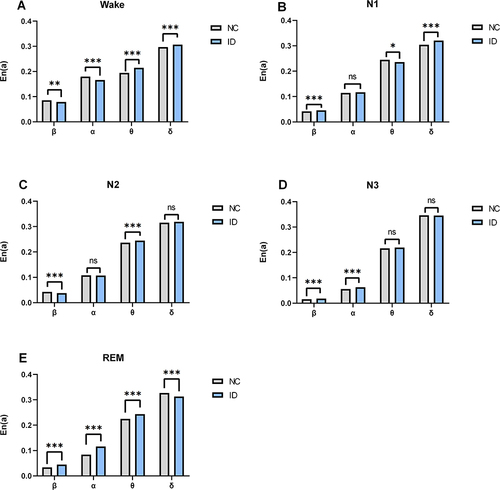
The En(a) was evaluated in the typical EEG frequency bands, including beta (β), alpha (α), theta (θ), and delta (δ). Different scales were corresponded with different frequency bands in EEG signals, ie the scales 7, 9, 12, and 15 correspond to β, α, θ, and δ frequency bands, respectively. In the wake stage, () the insomnia disorder group exhibited lower En(a) in the β and α bands than the normal control group (β band, P < 0.01; α band, P < 0.001), whereas in the θ and δ bands, the insomnia disorder group showed higher En(a) than the normal control group (θ band, P < 0.001; δ band, P < 0.001). In the N3 stage, () the insomnia disorder group showed higher En(a) in the β and α frequency bands than the normal control group (β band, P < 0.001; α band, P < 0.001). In the remaining stages, the En(a) on different frequency bands between the insomnia disorder group and the normal control group showed different performances, as shown in the , C and .
Figure 5 (A-E) The differences in the individual-scale wavelet entropy in different frequency bands during wake and different sleep stages between the normal control and insomnia disorder groups.
Discussion
In recent years, entropy has been applied to the study of sleep-wake state.Citation16–18 In the wake state, the brain contains an abundance of information, and the entropy increases with high-level interaction within the brain. To the contrary, the entropy decreases with low-level interaction within the brain in the sleep state. A previous study investigated the changes in sample entropy across wake to sleep state in adult and children and demonstrated that the change trends of the sample entropy across wake to sleep state were similar for both age groups and followed a pattern of Wake>REM>N2>N3.Citation19 The entropy of EEG signals in healthy adults increased during wake and REM sleep and decreased during slow wave sleep.Citation20–22 The results of this study showed that the En was highest in the wake stage and lowest in the N3 stage in normal control group. This is related to high brain complexity during wakefulness and low brain complexity during deep sleep.
Hyperarousal is a unifying element in many aetiological and pathophysiological models of insomnia,Citation23 which is recognized as a state of relatively increased arousal in physiological, cortical, cognitive and emotional domains.Citation24 A previous study had found that patients with insomnia had increased high-frequency EEG activation, abnormal hormone secretion, increased whole body and brain metabolic activation, elevated heart rate, and sympathetic nervous system activation during sleep.Citation25 In the present study, the results showed when compared with the normal control group, the En was lower in the wake stage and higher in the N3 stage in insomnia disorder group, suggesting that patients with insomnia disorder had low arousal level in the wake stage and insufficient sleep depth during deep sleep.
EEG power spectrum analysis has been most widely used in the study of quantitative EEG characteristics of patients with insomnia.Citation26,Citation27 It has been found that patients with insomnia exhibited elevated β spectral power during NREM sleep.Citation28–30 Riedner et alCitation31 performed power spectral analysis on high-density EEG data from normal controls and insomnia patients and demonstrated an increase in the overall high-frequency EEG activity (>16 Hz) in the insomnia group when compared with the normal control group. In contrast to power spectrum analysis, entropy, as a nonlinear analysis method, has greater advantages in distinguishing sleep stages. For quantitative analysis of EEG signals, entropy is more sensitive, and provides a new approach to explore the underlying mechanisms of insomnia disorder. Kirsch et alCitation32 reported that entropy-based algorithm provides a method that can quantify sleep structure through other attributes of sleep structure (eg, sleep-stage transition dynamics). In this study, the results showed that patients with insomnia disorder exhibited higher En in the N3 stage, implying that these patients had higher arousal level in neuronal activity during deep sleep, they were unable to maintain sleep homeostasis as normal individuals, and were more easily awakened. This information cannot be captured by traditional sleep structure parameters. Wavelet entropy describes the level of arousal and the quality of sleep from a different perspective.
The individual-scale wavelet entropy of EEG signals measures the complexity of the information contained in the components of EEG signals at an individual scale.Citation33 The sum of the individual-scale wavelet entropy is the integral wavelet entropy.Citation34 There are certain patterns in the way that wavelet entropy at different scales during different sleep stage changes. The results of this study showed that when compared with normal controls, patients with insomnia disorder exhibited lower wavelet entropy in the high-frequency bands (β and α bands) but higher wavelet entropy in the low-frequency bands (θ and δ bands) in the wake stage, they also showed higher wavelet entropy in the high-frequency bands (β and α bands) in the N3 stage. The individual-scale wavelet entropy reflects the extent to which different frequency bands contribute to the total amount of information. During other sleep stages, there were also some differences in the individual-scale wavelet entropy between patients with insomnia disorder and normal controls, the underlying mechanisms need to be further investigated.
In conclusion, our findings suggest that wavelet entropy can reflect the changes in the complexity of EEG signals during wake and different sleep stages. Patients with insomnia disorder showed lower En during wake stage than the normal control group, indicating low arousal level in these patients in the wake stage. Patients with insomnia disorder showed higher En in the N3 stage than the normal control group, reflecting insufficient depth of sleep during deep sleep. The use of wavelet entropy for the study of EEG signals in patients with insomnia disorder provides new method and insights about understanding of pathophysiological mechanisms of insomnia disorder.
Due to limitations associated with costs, equipment and location availability, and the subjective perception, PSG is not typically the first choice for diagnosing insomnia disorder. It is primarily utilized for assessing the severity of insomnia and for the differential diagnosis of insomnia disorder. Currently, the diagnosis of insomnia disorder relies heavily on patients’ subjective experiences, lacking an objective metric. Wavelet entropy shows significant changes during the sleep process in patients with insomnia disorder, offering a more objective assessment of sleep quality. Therefore, it could potentially serve as a marker for diagnosing insomnia disorder.
Limitation
This study still has several limitations. Firstly, the sample size included in this study is small, and future studies would benefit from a larger sample size to bolster support. Due to technical constraints, the analysis of sleep stages was conducted in fragments. In future work, it is hoped that the dynamic changes in the wavelet entropy of EEG signals can be analyzed over longer periods. Additionally, this study solely analyzed the wavelet entropy. Future studies could attempt to calculate multiple entropy algorithms and compare several entropy algorithms to broaden the understanding and applicability of the findings.
Informed Consent Statement
Informed consent was obtained from all subjects involved in the study. Written informed consent has been obtained from the patient(s) to publish this paper.
Institutional Review Board Statement
The study was conducted according to the guidelines of the Declaration of Helsinki and approved by the Ethics Committee of Tianjin Union Medical Center (Approval number:2023-B76).
Disclosure
The authors declare no conflicts of interest in this work.
Additional information
Funding
References
- Ohayon MM. Epidemiology of insomnia: what we know and what we still need to learn. Sleep Med Rev. 2002;6(2):97–111. doi:10.1053/smrv.2002.0186
- Ohayon MM, Ohayon MM. Observation of the natural evolution of insomnia in the American general population cohort. Sleep Med Clin. 2009;4:87–92. doi:10.1016/j.jsmc.2008.12.002
- Palagini L, Hertenstein E, Riemann D, Nissen C. Sleep, insomnia and mental health. J Sleep Res. 2022;31(4):e13628. doi:10.1111/jsr.13628
- Xu G, Li X, Xu C, Xie G, Liang J. Effect of insomnia in the major depressive disorder. BMC Neurol. 2022;22:341. doi:10.1186/s12883-022-02869-x
- Chellappa SL, Aeschbach D. Sleep and anxiety: from mechanisms to interventions. Sleep Med Rev. 2022;61:101583. doi:10.1016/j.smrv.2021.101583
- Chinese Medical Association, Neurology Branch, Sleep Disorders Group of the Chinese Medical Association, Neurology Branch. Guideline for the diagnosis and treatment of insomnia in adults in China (2017 edition). Chin J Neurol. 2018;51:324–335.
- Nofzinger EA, Buysse DJ, Germain A, et al. Alterations in regional cerebral glucose metabolism across waking and non-rapid eye movement sleep in depression. Arch Gen Psychiatry. 2005;62:387–396. doi:10.1001/archpsyc.62.4.387
- Li X, Zhu Z, Zhao W, et al. Decreased resting-state brain signal complexity in patients with mild cognitive impairment and Alzheimer’s disease: a multiscale entropy analysis. Biomed Opt Express. 2018;9:1916–1929. doi:10.1364/BOE.9.001916
- Yang AC, Wang SJ, Lai KL, et al. Cognitive and neuropsychiatric correlates of EEG dynamic complexity in patients with Alzheimer’s disease. Prog Neuropsychopharmacol Biol Psychiatry. 2013;47:52–61. doi:10.1016/j.pnpbp.2013.07.022
- Gonzalez J, Mateos D, Cavelli M, et al. Low frequency oscillations drive EEG’s complexity changes during wakefulness and sleep. Neuroscience. 2022;494:1–11. doi:10.1016/j.neuroscience.2022.04.025
- Liang Z, Wang Y, Sun X, et al. EEG entropy measures in anesthesia. Front Comput Neurosci. 2015;9:16. doi:10.3389/fncom.2015.00016
- Guo Y, Chen Y, Yang Q, Hou F, Liu X, Ma Y. Multi-scale permutation entropy: a potential measure for the impact of sleep medication on brain dynamics of patients with insomnia. Entropy. 2021;23(9):1101. doi:10.3390/e23091101
- Zhou F, Huang S, Gao L, Zhuang Y, Ding S, Gong H. Temporal regularity of intrinsic cerebral activity in patients with chronic primary insomnia: a brain entropy study using resting-state fMRI. Brain Behav. 2016;6:e529. doi:10.1002/brb3.529
- Association AP. Diagnostic and statistical manual of mental disorders: DSM-5™ (5th ed.). Codas. 2013;25:191. doi:10.1590/s2317-17822013000200017
- Iber C, Ancoli-Israel S, Chesson AL, Quan SF. The AASM manual for the scoring of sleep and associated events. Rules Terminol Tech Specifications. 2007;176(2012):7.
- Liang X, Xiong J, Cao Z, Wang X, Li J, Liu C. Decreased sample entropy during sleep-to-wake transition in sleep apnea patients. Physiol Meas. 2021;42. doi:10.1088/1361-6579/abf1b2
- Hou F, Zhang L, Qin B, Gaggioni G, Liu X, Vandewalle G. Changes in EEG permutation entropy in the evening and in the transition from wake to sleep. Sleep. 2021;44. doi:10.1093/sleep/zsaa226
- Gonzalez J, Cavelli M, Mondino A, et al. Decreased electrocortical temporal complexity distinguishes sleep from wakefulness. Sci Rep. 2019;9:18457. doi:10.1038/s41598-019-54788-6
- Lee GM, Fattinger S, Mouthon AL, Noirhomme Q, Huber R. Electroencephalogram approximate entropy influenced by both age and sleep. Front Neuroinf. 2013;7:33. doi:10.3389/fninf.2013.00033
- He W-X, Yan X-G, Chen X-P, Liu H. Nonlinear feature extraction of sleeping EEG signals. Conf Proc IEEE Eng Med Biol Soc. 2005;2005:4614–4617. doi:10.1109/IEMBS.2005.1615498
- Chouvarda I, Rosso V, Mendez MO, et al. Assessment of the EEG complexity during activations from sleep. Comput Methods Programs Biomed. 2011;104:e16–e28. doi:10.1016/j.cmpb.2010.11.005
- Ma Y, Shi W, Peng CK, Yang AC. Nonlinear dynamical analysis of sleep electroencephalography using fractal and entropy approaches. Sleep Med Rev. 2018;37:85–93. doi:10.1016/j.smrv.2017.01.003
- Khassawneh BY, Bathgate CJ, Tsai SC, Edinger JD. Neurocognitive performance in insomnia disorder: the impact of hyperarousal and short sleep duration. J Sleep Res. 2018;27(6):e12747. doi:10.1111/jsr.12747
- Dressle RJ, Riemann D. Hyperarousal in insomnia disorder: current evidence and potential mechanisms. J Sleep Res. 2023;32(6):e13928. doi:10.1111/jsr.13928
- Riemann D. Hyperarousal and insomnia: state of the science. Sleep Med Rev. 2010;14:17. doi:10.1016/j.smrv.2009.09.002
- Kao CH, D’Rozario AL, Lovato N, et al. Insomnia subtypes characterised by objective sleep duration and NREM spectral power and the effect of acute sleep restriction: an exploratory analysis. Sci Rep. 2021;11:24331. doi:10.1038/s41598-021-03564-6
- Kang JM, Cho SE, Moon JY, Kim SI, Kim JW, Kang SG. Difference in spectral power density of sleep electroencephalography between individuals without insomnia and frequent hypnotic users with insomnia complaints. Sci Rep. 2022;12:2117. doi:10.1038/s41598-022-05378-6
- Spiegelhalder K, Regen W, Feige B, et al. Increased EEG sigma and beta power during NREM sleep in primary insomnia. Biol Psychol. 2012;91:329–333. doi:10.1016/j.biopsycho.2012.08.009
- Israel B, Buysse DJ, Krafty RT, Begley A, Miewald J, Hall M. Short-term stability of sleep and heart rate variability in good sleepers and patients with insomnia: for some measures, one night is enough. Sleep. 2012;35:1285–1291. doi:10.5665/sleep.2088
- Maes J, Verbraecken J, Willemen M, et al. Sleep misperception, EEG characteristics and autonomic nervous system activity in primary insomnia: a retrospective study on polysomnographic data. Int J Psychophysiol. 2014;91(3):163–171. doi:10.1590/s2317-17822013000200017
- Riedner BA, Goldstein MR, Plante DT, et al. Regional patterns of elevated alpha and high-frequency electroencephalographic activity during nonrapid eye movement sleep in chronic insomnia: a Pilot Study. Sleep. 2016;39(4):801–812. doi:10.5665/sleep.5632
- Kirsch MR, Monahan K, Weng J, Redline S, Loparo KA. Entropy-based measures for quantifying sleep-stage transition dynamics: relationship to sleep fragmentation and daytime sleepiness. IEEE Trans Biomed Eng. 2012;59:787–796. doi:10.1109/TBME.2011.2179032
- Zhang MY, Wang C, Zhang Y, et al. Wavelet entropy analysis for ictal electroencephalogram signals of child absence epilepsy. Sheng Wu Yi Xue Gong Cheng Xue Za Zhi. 2018;35:530–538. doi:10.7507/1001-5515.201701002
- Wang YL, Zhang BB, Wang J, Zhang MY, Chen Y, Wang FL. A wavelet entropy analysis of ictal electroencephalogram signals of juvenile myoclonic epilepsy. Guo Ji Shen Jing Bing Xue Shen Jing Wai Ke Xue Za Zhi. 2020;47:343–352.