
Abstract
Background
Sleep quality and disturbances have gained heightened scholarly attention due to their well-established association with both mental and physical health. This study aims to assess sleep-wake habits and disturbances in Tunisian adults.
Methodology
This cross-sectional study employed an online questionnaire to assess 3074 adults ≥ 18 years. Primary outcomes, including sleep quality, daytime vigilance, mood, and subjective well-being, were measured using validated questionnaires [the Pittsburgh Sleep Quality Index (PSQI), the Insomnia Severity Index (ISI), the Epworth Sleepiness Scale (ESS), the Patient Health Questionnaire (PHQ)-9, and the World Health Organisation-Five Well-Being Index (WHO-5)].
Results
Less than two-thirds (n= 1941; 63.1%) of participants were females and the mean age was 36.25±13.56. The prevalence of poor sleep quality was 53.8% when defined as a PSQI > 5. The prevalence of insomnia, short sleep duration, long sleep duration, EDS, severe depression, and poor well-being were 14.5%, 34.7%, 12.3%, 32.4%, 7.4%, and 40.2%, respectively. Some factors were associated with an increased likelihood of poor sleep quality, including female gender, chronic hypnotics use, internet use close to bedtime, daily time spent on the internet >3 hours, smoking, university- level education, nocturnal work, severe depression, impaired well-being status, insomnia, and EDS.
Conclusion
The high prevalence of sleep-wake disturbances among Tunisian adults emphasizes the need for an appropriate screening strategy for high-risk groups. Individuals with unhealthy habits and routines were significantly more likely to experience these kinds of disturbances. Consequently, there is a pressing need for educational programs on sleep to foster healthier sleep patterns.
Background
Research on sleep disturbances in both general and clinical populations is gaining prominence due to the well-established connection between sleep and mental and physical well-being. Sleep disturbances can manifest in various clinical features, including poor sleep quality, insomnia, hypersomnia, and breathing related-sleep disorders (BRSD). The prevalence of sleep disturbances varies globally, with estimates ranging from 1.6% to 56.0% in various countries.Citation1,Citation2 The majority of these data originate from high-income countries (HIC), and may not be necessarily representative of middle and low-income countries (MLIC) due to the demographic, geographic, cultural, and health disparities.
Tunisia is the northernmost country in Africa and has a varied climate. The south is hot, dry, and semi-arid, and the north has a Mediterranean climate. The population is around 12 million with a median age of 32.7 years and a sex ratio of 0.99. A study of 5343 Tunisian adults found that 51.7% of men and 71.1% of women were overweight or obese.Citation3 Over two-thirds of people live in cities, and the majority speak Arabic as their native language. The illiteracy rate is 19.1%, and unemployment is high at around 15.3%, impacting women more. Tunisia has faced political instability over the last decade, marked by the Arab Spring revolution, and exacerbated by the COVID-19 pandemic, leading to a severe socioeconomic crisis.
Due to the combination of low socioeconomic status and high prevalence of excess weight/obesity, Tunisians are at an increased likelihood of experiencing emotional disturbances, poor sleep quality, and SDB. Despite these factors, to the best of our knowledge, no study to date investigated sleep habits and disturbances among Tunisian adults. The current study sought to assess sleep habits and the prevalence of sleep disturbances, as well as associated factors, in a sample of Tunisian adults aged ≥ 18 years, using validated screening questionnaires.
Methodology
Study Design and Setting
A population-based cross-sectional study was conducted by the Department of Respiratory and Sleep Medicine at Hedi Chaker University Hospital of Sfax Tunisia. Data collection was performed from the end of October 2022 through to the beginning of April 2023. Our study was conducted in compliance with the Declaration of Helsinki. Ethical approval was obtained from the local ethics committee (Comité de Protection des Personnes Sud), and informed consent was obtained from all study participants.
Population
All Tunisian adults aged ≥ 18 years, residing regularly in any of the 24 provinces of Tunisia, were eligible for the study. Based on data from a pre-survey conducted on 30 volunteers which showed a prevalence of poor sleep quality of 51%, the minimum number of participants required for our study was 2400 with a 95% confidence level and 5% margin of error.
Data Collection
A 20-minute survey questionnaire was used to collect data. The questionnaire contained both open-ended and forced-choice questions and was administered in literary Arabic.
The survey introduction provided details on the study’s purpose, author identifications, confidentiality and anonymity assurances, and specific instructions for each question where needed. It was emphasized that the study was limited to Tunisian adults who are regular residents of any of the 24 provinces of Tunisia. Each participant was required to indicate the province of their current residence.
To ensure the reliability and validity of the questionnaire, as well as to address any potential data entry issues, a pilot study involving 30 volunteers was conducted before the full survey implementation.
An electronic survey through the free-of-charge Google Forms tool was used for data collection. The survey was extensively promoted on diverse social media platforms, including, but not limited to, Facebook, Twitter, and LinkedIn. Additionally, outreach efforts targeted social media influencers who were contacted via Email and phone. These influencers actively shared the survey link across their websites, newsletters, and social media channels, contributing to a broad and diverse participant pool.
Measures
Socio-Demographic Data
The study encompassed the collection of socio-demographic data, including age, gender, marital status, educational level, employment status, family size, number of children aged 6 years or less, nature of communities (urban or rural), and anthropometric characteristics.
Health Factors
Lifestyle habit data were collected, including smoking and alcohol consumption habits, energy drink consumption, eating behaviours, use of analgesics/anxiolytics/hypnotics, internet daily use, physical activity patterns, sleep-wake habits, and sleep duration.
A 4-point scale (never, occasionally, often, almost every day) was used to evaluate the frequency of each habit excluding smoking and alcohol consumption, time spent on the internet, sleep-wake habits, and sleep duration. Due to conceptual overlap, the categories “often” and “almost every day” were merged for the analyses, as well as for the categories “never” and “occasionally”.
To transform data on sleep-wake habits, minutes were converted by dividing by 60 and multiplying by 100. The metric variable was established by counting hours from 0 to 24, with hours beyond 12:00 am expressed as 25 for 1:00 am, 26 for 2:00 am, etc.Citation4 Considering Tunisian social traditions and time conventions, early-to-bed and late-to-bed were defined as a bedtime before or after 10:00 pm, respectively. Similarly, “early-to-rise” and “late-to-rise” were defined as rising before or after 07:00 am, respectively. Participants were categorized into four groups: “early to bed and early to rise” (EE), “early to bed and late to rise” (EL), “late to bed and early to rise” (LE), and “late to bed and late to rise” (LL).
Sleep duration was assessed by asking participants about their average nightly sleep over the month preceding the survey.Citation4 In line with guidelines from the Centers for Disease Control and Prevention,Citation5 an optimal sleep duration falls between 7 and 8 hours per night. We defined short sleep duration as an average of 6 hours or less and long sleep duration as an average of 9 hours or more.Citation6,Citation7
Data on daytime naps were collected using ESS.Citation8 A regular daytime nap was operationally defined as a high likelihood of dozing when sitting quietly after lunch without alcohol or when lying down to rest in the afternoon when circumstances permit.
The study also collected data on prevalent morbidities. The severity of comorbidity was assessed using the Charlson Comorbidity Index (CCI) and categorized as low (0–1) or high (≥2).Citation9,Citation10
Subjective Sleep Quality
The study assessed subjective sleep quality using the Arabic-validated version of the Pittsburgh Sleep Quality Index (PSQI) which has demonstrated acceptable reliabilityCitation11 (Cronbach’s alpha coefficient = 0.77).
The PSQI is a standardized self-report questionnaire widely utilized for assessing sleep quality and disturbances over a one-month period. It comprises two parts: 19 self-rated questions, utilized to rate the scale, and 5 open-ended questions rated by the bed partner or roommate, if available. The latter five questions serve clinical purposes and are not scored. The 19 self-reported questions are categorized into seven clinically derived component scores: sleep onset duration, sleep disturbances, sleep onset latency, daytime dysfunction due to sleepiness, habitual sleep efficiency, overall sleep quality, and need for sleep medications. Each component is assigned a score ranging from 0 to 3 where 0 indicates no difficulty, and 3 indicates severe difficulty. The sum of the seven component scores forms the global PSQI score that ranges from 0 to 21, with higher scores indicative of poorer sleep quality. A global PSQI cut-off score > 5 provides a diagnostic sensitivity of 89.6% and specificity of 86.5% (kappa. = 0.75, p < 0.001) in identifying individuals with poor sleep.Citation12
Sleep Breathing Disorders
The main symptoms of obstructive sleep apnea (OSA), such as snoring, excessive daytime sleepiness (EDS), abrupt awakening with gasping or choking, and witnessed apnea during sleep were collected. The presence of both loud snoring (occurring three times or more per week) and EDS was considered as indicator of probable OSA.
Insomnia
Insomnia was assessed using a validated Arabic version of the Insomnia Severity index (ISI), with a Cronbach’s alpha coefficient of 0.84, indicating good reliability.Citation13
The ISI is a reliable and valid self-report questionnaire designed to measure the nature, severity, and impact of insomnia over the preceding month. Seven self-report items of closed-ended questions are used to assess the following dimensions of insomnia: severity of sleep onset, maintenance, and early morning awakening problems; sleep dissatisfaction; interference of sleep difficulties with daytime functioning; noticeability of sleep problems by others; and distress caused by the sleep difficulties. Each item is rated on a 5-point Likert scale (eg, 0 = no problem; 4 = very severe problem) yielding a total score ranging from 0–28. Higher scores denote more severe insomnia: absence of insomnia (0–7); sub-threshold insomnia (8–14); moderate insomnia (15–21); and severe insomnia (22–28). Participants were classified with a high risk of insomnia if ISI ≥ 15.
Daytime Sleepiness
Daytime sleepiness was assessed using a validated Arabic version of the Epworth Sleepiness Scale (ESS) (Cronbach’s alpha = 0.86).Citation14
The ESS is an 8-item-self-administered questionnaire that measures the severity of daytime sleepiness over the past 3 months. A 4-point Likert scale is employed, where “0” indicates “would never nod off”, while “3” indicates “a strong chance of nodding off”. Participants rate their likelihood of dozing off or falling asleep in eight different situations encountered in everyday life (such as sitting and reading or watching TV). The total ESS score calculated by summing the all individual 8 item scores ranged from 0 to 24, with higher scores indicating a greater sleep disturbance propensity. In the present study, EDS was defined as ESS score ≥11, while severe EDS was defined as ESS score ≥16.
Depression
To assess depression, we used a validated Arabic version of the Patient Health Questionnaire-9 (PHQ9)Citation15 which has shown a high internal consistency reliability (Cronbach’s alpha = 0.857).
The PHQ-9 is the 9-item depression module of the original PHQ.Citation16 Each item is evaluated on a 3-point Likert scale (0-not at all; 1-several days; 2-more than half of the days or 3-nearly every day) where respondents are asked to recall how often they have experienced symptoms of depression within the last two weeks. The total PHQ9 score, obtained by summing the scores of the nine items, ranges from 0 to 27, with corresponding categories: 0 to 4 points indicate no depression, 5 to 9 points represent mild depression, 10 to 14 points signify moderate depression, 15 to 19 indicate moderately severe depression, and 20 to 27 denote severe depression.Citation16
Well-Being
Quality of life was assessed using a validated Arabic version of the World Health Organization-Five Well-Being Index (WHO-5) which has shown strong validity and reliability (Cronbach’s alpha = 0.878).Citation17
WHO-5 is a concise self-report questionnaire designed to assess subjective well-being over the last two weeks.Citation18 It consists of five simple, non-invasive and positively phrased items which identify positive mood (good spirits, relaxation), vitality (being active and waking up fresh and rested), and general interest (being interested in things). Each item is rated on a 6-point Likert scale (0= at no time; 1= some of the time; 2= less than half of the time; 3= more than half of the time; 4= most of the time; 5= all the time). The total raw score is generated by adding the 5 individual items and ranges from 0 to 5. The final score is obtained by multiplying the total raw score by 4 yielding a total score ranging from 0–100 with higher scores indicating better well-being. A final score ≤ 50 or a raw score of 0 or 1 on any individual item suggests poor well-being.
Statistical Analysis
The data analysis was performed with SPSS Statistics for Windows, Version 23.0 (IBM SPSS Statistics for Windows, Version 23.0. Armonk, NY: IBM). The normal distribution of data was assessed by the Kolmogorov–Smirnov test. Continuous variables with normal distribution were reported as mean and standard deviation (SD), while non-normally distributed variables were reported as median and interquartile range (IQR). Means of 2 and 3 or more groups of continuous variables normally distributed were compared by Independent Samples t-test and ANOVA test, respectively. The median of non normal continuous variables was compared using non-parametric tests (Mann–Whitney U-test and Kruskal–Wallis). Categorical variables were presented as counts and frequencies. The frequencies of categorical variables were compared using Pearson χ2 or Fisher’s exact test, when appropriate. The Association of PSQI, ESS and ISI scores with various factors were assessed using univariate logistic analyses. Significative variables as well as those previously reported in the literature were fitted into a multivariable model regression in order to delineate independent factors. A value of p < 0.05 was considered significant.
Results
Univariate Analysis
Socio-Demographic and Health Factors
The mean age of participants was 36.25±13.56 years, with over two-thirds of females and around one-half married. Most lived in urban areas, had University-level education, and were employed. Rates of smoking and alcohol consumption were 14.3% and 10.3% respectively, and around half of the participants reported regular consumption of energy drinks and copious dinner close to bedtime. Most participants used the internet close to bedtime, while less than one-quarter of them reported regular physical activity ().
Table 1 Socio-Demographic and Health Factors of the Study Sample
The overall prevalence of comorbidities in our sample was 25.9. More than two-fifths of participants had poor well-being as assessed by the WHO-5, and 137 (7.4%) had a PHQ-9 score ≥ 20, indicating severe depression.
Sleep-Wake Habits
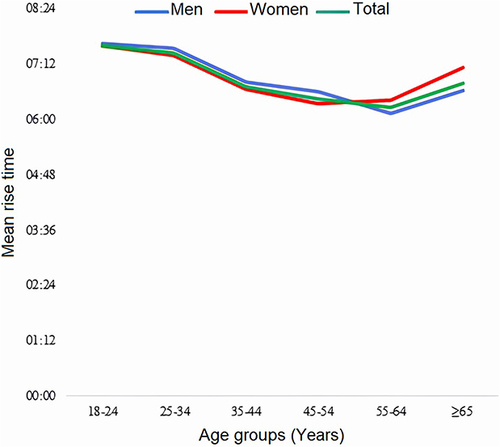
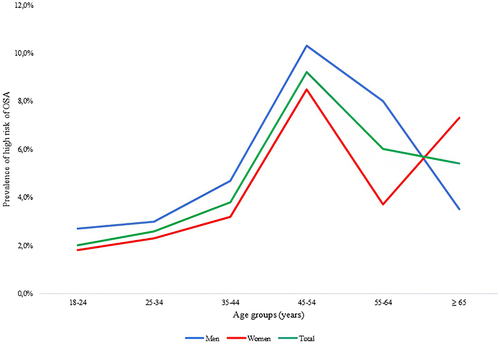
and outline the differences in sleep timing by age and gender. The mean sleep-onset time and wake-up time were 23:07±1:31 and 07:03±1:33 respectively. Sleep onset time decreased significantly across age groups (p <0.001), with the youngest participants (18–24 years) going to bed 98 minutes later than the oldest ones (≥ 65 years). Women had significantly earlier sleep-onset time than men (23:02±1:23 versus 23:17±1:42; p <0.001) and both genders tended significantly to go to bed earlier with increasing age (p <0.001). Mean waking time showed a strong significant U-shaped association with age groups and reached the minimum about age 55–64 years before starting to increase again (p < 0.001). Both genders had comparable waking times (7:01±1:35 versus 7:04±1:32; p=0.35).
Figure 1 Mean sleep onset time by age groups in men (p <0.001), women (p <0.001), and the total sample study (p <0.001). Women had significantly earlier sleep-onset time than men (23:02±1:23 versus 23:17±1:42; p <0.001) and both genders tended significantly to go to bed earlier with increasing age (p <0.001).
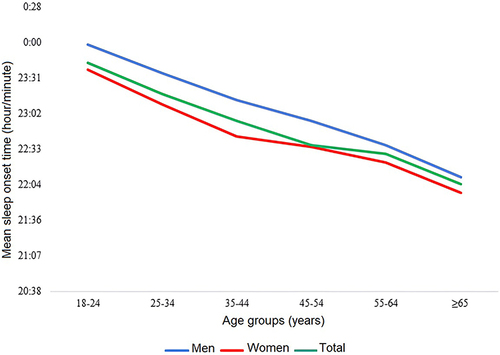
Figure 2 Mean rise time by age groups in men, women, and total sample (p <0.001 each). Overall, the mean rise time showed a strong significant U-shaped association with age groups, reached the minimum about age 55–64 years then started to increase again (p < 0.001).
Participants who were LE, LL and EE made up two-fifths (n=1218; 39.6%), one-third (n=972; 31.61%) and one-quarter (n=739; 24%) of participants, respectively, while only a minority (n=145; 4.7%) of them were EL. Socio-demographic characteristics and lifestyle habits did not differ between the four sleep-wake habits groups except for age (p=0.038) and marital status (p=0.045). The mean age was significantly higher in LE participants (37.2 ±13.87 years) as compared to 36.4±13.98 years for EE, 35.27±12.89 years for LL and 35.22 ±2.72 years for EL (p=0.015). There was no significant difference in the overall prevalence of chronic diseases between the four groups (p=0.1). Although, the mean CCI (p <0.001) and the prevalence rates of systemic hypertension (p=0.013), OSA (p=0.017), hyperthyroidism (p=0.01) and physical handicap (p=0.011) were found to be significantly increased in LE group. Our results showed that the mean PSQI, PHQ9, ESS, ISI, and WHO-5 scores did not differ significantly across sleep-wake habits groups.
More than two-thirds of participants (n=2130; 69.3%) indicated they took daytime naps. Nappers, as compared to non-nappers, were more likely to have big families (51.2% versus 43.5%; p <0.001), to be active smokers (15.1% versus 12.4% respectively; p=0.047), to be regular users of energy drinks close to bedtime (52.2% versus 46.8% respectively; p=0.006), to be regular eaters of copious meals (45.1% versus 39.7% respectively; p=0.006), to report a lack of physical activity (77.6% versus 72.7% respectively; p=0.003), and to have previous SARS-CoV2 infection (14.4% versus 9.5% respectively; p <0.001). They also showed significantly higher prevalence rates of EDS (45% versus 4% respectively; p <0.001), insomnia (16.2% versus 10.8% respectively; p <0.001), poor sleep quality (56.5% versus 47.6%; p < 0.001), and impaired well-being (42.3% versus 35.4% respectively; p <0.001). Participants from southern provinces were more often nappers than those from northern provinces (p=0.012).
Sleep Duration
More than one-third of participants (n=1068; 34.7%) reported short sleep duration, with similar proportions in men and women (34.9% versus 34.7% respectively; p=0.915). The prevalence of short sleep duration varied significantly across age groups (p=0.001), peaked in middle-aged participants (35–54 years) before reaching its lowest rate in the participants aged 65 years or above (39.81% versus 28.4% respectively). Slightly more than one in ten participants (n=377; 12.3%) were long sleepers. Long sleep duration was more often reported by women than men (13.9% versus 9.5% respectively; p<0.001). Here too, the prevalence of long sleep duration was significantly associated with age groups and was twice as high in the youngest participants aged 18–24 years as in the middle-aged group (35–53 years) (17.6% versus 8.3% respectively; p <0.001).
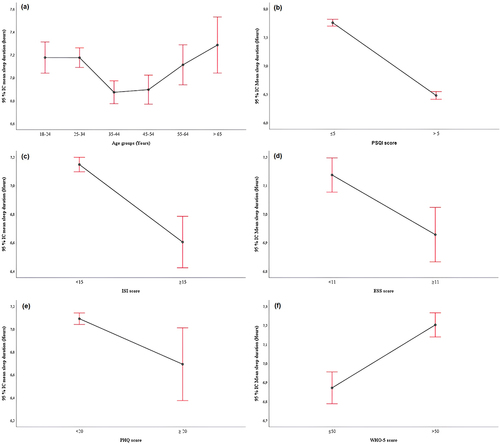
The mean sleep duration in the total sample study was 7.05±1.48 hours and was significantly increased in women as compared to men (7.09±1.55 versus 6.89±1.35; p=0.044). As illustrated in , mean sleep duration varied significantly across the lifespan (p < 0.001) and showed a U-shaped association with age groups. The age group 35–54 years and the oldest participants aged 65 years or more had the lowest and the highest mean sleep duration, respectively.
Figure 3 (a–f) Distribution of sleep duration by age groups (a) A U-shaped association was found between mean sleep duration and age groups (p < 0.001). Sleep duration by PSQI (b), ISI (c), ESS (d), PHQ-9 (e) and WHO-5 (f) scores. Participants with poor sleep quality (<0.001), insomnia (p<0.001) EDS (0.001), severe depression (p=0.022) or impaired well-being (<0.001) slept for a much shorter duration. PHQ-9: Patient Health Questionnaire. PSQI: Pittsburgh Sleep Quality Index. ISI: Insomnia Severity Index. ESS: Epworth Sleepiness Scale. World Health Organisation- Five Well-Being Index.
Married participants were found to sleep less than unmarried participants (6.96±1.41 hours versus 7.14±1.54 hours respectively; p=0.001). Similarly, participants with a steady bed partner showed significantly shorter sleep duration when compared to those without a steady bed partner (6.97±1.33 hours versus 7.11±1.58 respectively; p=0.01). Family size did not affect sleep duration. However, participants living with children under 6 years of age tended to sleep significantly less than those who did not have children under 6 years in the household (6.88±1.35 hours versus 7.1±1.51 hours respectively; p<0.001). Curiously, it was noted that sleep duration decreased significantly with higher education levels (p=0.001). In addition, employed participants showed the lowest sleep duration when compared to students and unemployed participants (6.96±1.33 hours, 7.12±1.69 hours, and 7.36±1.74 hours respectively; p < 0.001). Among employed participants, blue-collar and white-collar workers had comparable sleep duration (6.98±1.45 hours versus 6.84±1.29 hours respectively; p=0.62); however, night shift workers were found to sleep significantly less than non-shift workers (6.85±1.41 hours versus 7.10±1.49 hours respectively; p <0.001).
Our results showed that active smokers slept less than non-smokers (6.83±1.54 hours versus 7.09±1.47 hours respectively; p=0.001). Chronic hypnotics users showed significantly reduced sleep duration when compared to those who never or rarely use hypnotic drugs (6.8±1.62 hours vers 7.08±1.46 hours respectively; p=0.005). Internet users spending less than an average of one hour online daily tended to sleep for a longer duration (7.35±1.70 hours) than those who spent 1 to 3 hours or 3 hours or more online (6.98±1.29, 7.08±1.60 hours respectively; p=0.011). Participants with previous SARCoV2 infection reported significantly reduced sleep duration as compared to those who were not previously infected (6.87±1.35 hours versus 7.08±1.5 hours respectively; p=0.009). We also found that participants with impaired well-being, severe depression, poor sleep quality, insomnia, or EDS slept for a much shorter duration, as shown in .
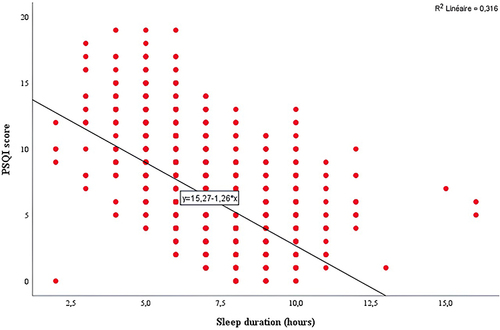
A moderate negative linear correlation (r=−0.523; p <0.001) was observed between sleep duration and PSQI score, which suggests that with shorter sleep duration comes more impaired sleep quality ().
Figure 4 A scatter plot showing a moderate negative correlation between sleep duration and PSQI score. PSQI: Pittsburgh Sleep Quality Index (r=−0.523; p <0.001).
Sleep Quality
The mean total PSQI score was 6.35 ±3.2 and was significantly higher in women than men (6.64±3.32 versus 5.84±3.03 respectively; p <0.001). It also decreased highly significantly with increasing age (p <0.001).
Slightly more than one-half of subjects (n=1653; 53.8%) had PSQI scores > 5, indicating poor sleep quality, while only one-quarter (n= 852; 27.7%) of them self-rated their sleep quality as fairly bad or very bad. Almost all of the very bad and fairly bad self-ratings for overall sleep quality (802/852; 94.2%) scored in the “bad” range of PSQI scores (> 5).
Women showed a significantly higher prevalence of poor sleep quality than men (57.4% versus 47.6% respectively < 0.001). For both genders, the prevalence of poor sleep quality tended to decrease significantly across age groups (p <0.001) and reached the minimum around the age of 45–54 in men, and 55–64 years in women, then started to increase again (Supplementary data 1).
Participants who were unmarried were found to be more commonly poor sleepers when compared with married ones (58% versus 49.5% respectively; p < 0.001). Similarly, sleeping without a steady bed partner was significantly associated with increased poor sleep quality than sleeping with a steady bed partner (57.2% versus 49.3% respectively; p <0.001). Participants with a university-level education showed the highest prevalence rate of poor sleep quality compared with those with less education (60.4% versus 47.9% in participants with secondary school level, 33.3% in participants with primary school level and 48.4% in illiterate participants; p <0.001). Nearly two-thirds of students (n=372; 63.7%) suffered from poor sleep, whereas for employed and unemployed participants the prevalence rates of poor sleep quality were 52.8% and 45.3% respectively (p <0.001). Among employed participants, a significantly higher prevalence rate of poor sleepers was observed in white-collar workers compared with blue-collar workers (54.3% versus 46.7% respectively; p=0.012), and in night shift workers compared to day workers (60.9% versus 52.1% respectively; p <0.001) (). Subjects engaged in regular physical activity appeared to sleep better compared to those who never or rarely exercise (47.2% versus 55.8% respectively; p < 0.001). Several other factors were also found to be significantly associated with increased prevalence of poor sleep quality, including high BMI groups, active smoking, chronic alcohol use, copious dinner, consumption of energy drinks close to bedtime, internet use close to bedtime, longer daily time spent online, chronic analgesic use, chronic hypnotic use, psychiatric diseases, EDS, insomnia, severe depression, and impaired well-being ().
Table 2 Prevalence Rates of Poor Sleep Quality, Insomnia and Excessive Daytime Sleepiness by Sociodemographic Factors
Table 3 Prevalence Rates of Poor Sleep Quality, Insomnia and Excessive Daytime Sleepiness by Health Factors
Sleep Disturbances
Among the 3074 participants, 420 (13.7%) reported they snored over the last month, while habitual snoring was reported by 265 (8.6%) participants. Moreover, 158 (5.1%) participants answered they had experienced long pauses in breathing while asleep over the last month, and in 29 (0.9%) participants these episodes occurred 3 times or more per week. A high risk of OSA was identified in 114 (3.7%) participants and was significantly greater in men than women (5.1% versus 3.4% respectively; p=0.025). Overall, we found that the risk of OSA increased in early adulthood, peaked around middle age (45–54 years), and then declined again (). It also increased as BMI increased, to reach a peak of 15.6% in obese participants with a BMI ≥35-39.9 kg/m2.
Figure 5 Prevalence rates of high risk of OSA by age groups in men (p=0.008), women (p <0.001) and the total sample study (p<0.001). Overall, the risk of OSA increased in early adulthood, peaked around middle age (45–54 years), and then declined again. OSA: obstructive sleep apnea.
Insomnia
The mean ISI was 8.16±5.65 and decreased significantly with increasing age (p <0.001). Women showed significantly higher mean ISI as compared with men (8.55±5.65 versus 7.47±5.6 respectively; p <0.001). Among the 3074 participants, 446 (14.5%) were classified as subjects with a high risk of insomnia, while 71 (2.3%) showed symptoms of severe insomnia. The percentage of participants with a high risk of insomnia decreased significantly with increasing age, from 19.7% (n=122) among adults aged 18–24 to 7.9% (n=19) among those aged 55–64 (p<0.001) as shown in Supplementary data 2. Only 15.5% (n=69) of the participants suffering from insomnia received sleeping pills once or several times per week over the last month.
Patients with insomnia symptoms were more likely to be females, younger in age, morbidly obese, unmarried, without a steady bed partner, active smokers, chronic alcohol drinkers, regular users of energy drinks close to bed, chronic users of analgesics, chronic users of hypnotics, and students. They were also more likely to have a secondary education level, blue-collar job, copious dinners, frequent internet use close to bed, daily time spent online > 3 hours, lack of regular physical activity, previous SAR-CoV2 infection, and a history of psychiatric disorders. In addition, they tended to have increased prevalence rates of poor sleep quality, EDS, severe depression, and impaired well-being ( and ).
Excessive Daytime Sleepiness
The mean ESS score was 8.52±4.79, tended to decline with age (p <0.001), and was significantly increased in women as compared to men (8.98±4.88 vs 7.73±4.54 respectively; p < 0.001). EDS was reported by almost one-third of participants and was significantly more prevalent in women than men. As shown in Supplementary data 3, the prevalence of EDS was highest among the youngest participants (43.7%) aged 18–24 years, then decreased significantly with increasing age in women (p <0.001), but not in men (p=0.41). Severe EDS was present in 8.3% (n=254) of participants and was around twice as prevalent in women as in men (9.9% versus 5.4% respectively; p <0.001).
Several factors were significantly associated with increased prevalence of EDS, such as unmarried status, big family, University-level education, being a student, white collar work, copious dinner, internet use close to bed, longer daily time spent online, lack of regular of physical activity, chronic analgesic use, previous SARS-CoV2 infection, psychiatric diseases, EL pattern, sleeping without a steady bed partner, poor sleep quality, severe depression, severe insomnia, and impaired well-being ( and ).
Multivariable Analysis ()
Sleep Quality
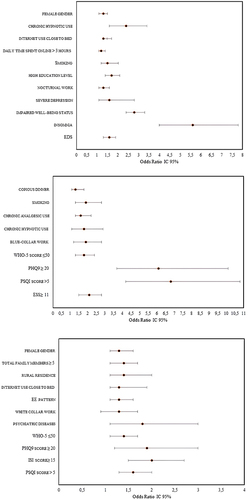
In multivariable binary logistic regression analysis, poor sleep quality was independently associated with female gender (OR=1.3, 95% CI=1.1–1.5; p= 0.005), chronic hypnotic use (OR=2.4, 95% CI=1.6–3.4; p <0.001), internet use close to bed (OR=1.3, 95% CI=1.1–1.7; p= 0.02), daily time spent online > 3 hours (OR=1.2, 95% CI=1.1–1.4; p=0.03), smoking (OR=1.5, 95% CI=1.2–2.02; p=0.001), University-level education (OR=1.7, 95% CI=1.4–2.1; p <0.001), nocturnal work (OR=1.3, 95% CI=1.1–1.6; p=0.013), severe depression (OR=1.6, 95% CI=1.1–2.8; p=0.04), impaired well-being status (OR=2.8, 95% CI=2.4–3.3; p <0.001), insomnia (OR=5.6, 95% CI=4-7.8; p <0.001), and EDS (OR=1.6, 95% CI=1.3–1.9; p <0.001).
Figure 6 Multivariable binary logistic regression analysis on the association between poor sleep quality, insomnia and EDS with predictors. EDS: excessive daytime sleepiness. World Health Organisation- Five Well-Being Index. PHQ-9: Patient Health Questionnaire. PSQI: Pittsburgh Sleep Quality Index. ISI: Insomnia Severity Index. ESS: Epworth Sleepiness Scale.
Insomnia
The following factors were independently associated with insomnia in multivariable binary logistic regression analysis: copious dinner (OR=1.3, 95% CI =1.1–1.8; p=0.04), smoking (OR=1.9, 95% CI =1.3–2.8; p<0.001), chronic analgesic use (OR=1.6, 95% CI =1.1–2.2; p=0.005), chronic hypnotic use (OR=1.8, 95% CI =1.1–2.9; p=0.007), blue-collar work (OR=1.9, 95% CI =1.2–2.8; p=0.01), WHO-5 score ≤50 (OR=1.8, 95% CI =1.3–2.4; p<0.01), PHQ9 ≥ 20 (OR=6.1, 95% CI =3.7–10.1; p <0.001), PSQI score >5 (OR=6.8, 95% CI =4.2–10.8; p <0.001), and ESS≥ 11 (OR=2.1, 95% CI =1.5–2.8; p <0.001).
Excessive Daytime Sleepiness
The multivariable binary logistic regression analysis identified 12 factors that were independently related to EDS: female gender (OR =1.3, 95% CI =1.1–1.6; p=0.01), total family members ≥ 5 (OR=1.4, 95% CI =1.1–1.7; p=0.001), rural residence (OR=1.4, 95% CI=1.1–2; p=0.03), internet use close to bedtime (OR=1.3, 95% CI =1.1–1.9; p=0.04), EE pattern (OR=1.3, 95% CI =1.1–1.6; p=0.029), white collar work (OR=1.3, 95% CI =0.9–1.7; p=0.06), psychiatric diseases (OR=1.8, 95% CI =1.1–3; p=0.027), WHO-5 ≤50 (OR=1.4, 95% CI =1.1–1.7; p=0.002), PHQ9 score ≥ 20 (OR=1.9, 95% CI =1.2–3; p=0.006), ISI score≥ 15 (OR=2, 95% CI =0.5–2.7; p <0.001), and PSQI score > 5 (OR=1.6, 95% CI =1.3–2; p <0.001).
Discussion
Main Findings
To the best of our knowledge, this is the first scale population-based study (using the validated PSQI scale) to investigate sleep disturbance, depression and well-being among adult Tunisian people. It is also the first of its kind in North Africa, and data was collected after the SAS-CoV2 pandemic. Our results suggest that a substantial proportion of Tunisian adults are suffering from sleep disturbances including poor sleep quality (53.8%), insomnia (14.5%), short sleep duration (34.7%), long sleep duration (12.3%) and EDS (32.4%). We also found that 7.4% of participants suffered from depression, while 40.2% were “unsatisfied” with their well-being. Some factors were associated with an increased OR of poor sleep quality, including female gender, chronic hypnotic use, internet use close to bedtime, daily time spent online > 3 hours, smoking, university-level education, nocturnal work, severe depression, impaired well-being status, insomnia, and EDS.
Prevalence of Sleep Disturbance
A high prevalence of poor sleep quality was observed in this study (53.8%). Previously reported research on sleep epidemiology has derived predominantly from HIC, whereas very little is known about LMIC such as Tunisia. In a cross-sectional study including 422 randomly selected adults in Ethiopia, about two-thirds of subjects (65.4%) showed a global PSQI score > 5, indicating poor sleep quality.Citation19 Based on a recent meta-analysis of sleep health epidemiology in 9 LMIC,Citation20 the pooled prevalence of poor sleep quality in the adult population was 33.2% and varied from 6% to 94%. The highest prevalence rates of poor sleep quality were found in South and Central America (pooled prevalence 37%) and Eastern Mediterranean (62%), then in Africa (15%). In the INDEPTH WHO-SAGE Study that included more than 40,000 older adults from 8 developing African and Asian countries, the prevalence of severe/extreme nocturnal sleep problems was recorded to range from 3.9% (Purworejo, Indonesia, Nairobi and Kenya) to more than 40% (Matlab, Bangladesh), with an average of 16.6%.Citation2 A lower prevalence of poor sleep quality was reported in HIC. In a recent meta-analysis including 409,617 people from the Netherlands, United Kingdom (UK), and United States (USA),Citation21 only 13.3% of adults ≥ 18 years were identified as poor sleepers. In a Chinese population-based cross-sectional survey of 26,851 adults, nearly one-quarter (26.6%) had an impaired PSQI > 5.Citation22 A similar prevalence rate (27.6%) was reported in another cross-sectional survey performed on a random sample of 6126 adults from Singapore.Citation23 Reported data on the prevalence of poor sleep quality and sleep problems varies greatly depending on the population (sex distribution, socioeconomic demands, cultural habits, and local attitudes towards sleep) and the research methodology. Regarding the latter, it was suggested that studies with small samples have reported worse sleep quality. Likewise, the use of the PSQI with a standard cut-point, as was the case in our study, may provide a higher prevalence rate than when using a single item.Citation20
This study found the overall prevalence of insomnia to be 14.5%, while the prevalence of severe insomnia was 2.3%. Epidemiological studies from countries across the world have yielded inconsistent information about insomnia prevalence. Alarming prevalence rates of insomnia were reported in two cross-sectional studies from Saudi ArabiaCitation24 and LebanonCitation25 (77% and 47.1% respectively). Insomnia was found to be less prevalent in another study from Egypt where only one-fifth (20.5%) of the 3141 Egyptian public officials sampled had chronic insomnia as assessed by the Jenkins Sleep Evaluation Questionnaire (JSEQ).Citation26 Similar results were reported by a metanalysis of 115,988 participants from China which identified a prevalence of 15% (95% CI: 12.1–18.5%),Citation27 while in a more recent metanalysis that evaluated 409,617 adults from 3 occidental countries (Netherlands, UK and USA), prevalence rates ranged from 9.6% to 19.4%.Citation21 Data from the World Health Survey (WHS) 2002–2004Citation28 reported a substantially lower prevalence of insomnia (7%) among 237,023 adults aged ≥18 years in 46 LMIC.
In the current study, around one-third (32.4%) of subjects scored 11 points or more on the ESS, thus they qualified as excessively sleepy. Previous studies have reported conflicting results regarding the prevalence rates of EDS across countries. In a cross-sectional study of 2095 adults from Saudi Arabia,Citation24 EDS, defined by an ESS > 10, was present in 20.5% of participants, whilst another Japanese cross-sectional community-based study of 4185 adults identified a prevalence of 7%.Citation29 Data from the National Health Interview Survey showed that the prevalence of EDS among US adults increased from 9.8% in 2002 to 12.7% in 2012.Citation29 However, it remains much less than what was recently reported (43.6%) in a cross-sectional study of 1436 adults from the Gaza Strip.Citation30
Sleep Habits
Despite clear instructions in Muslim culture which emphasize the importance of maintaining a pattern of light and darkness,Citation31 an increased prevalence of LL pattern was observed in our study (31.61%). Slightly less than three-quarters of participants went to bed late. This result could be attributed to the high rates of unhealthy lifestyle behaviours in the current sample, such as late afternoon consumption of energy drinks, copious dinner, low physical activity and bedtime internet use. The unexpected outbreak of SAS-CoV-2 and its related consequences for people’s lifestyles and mental health may also be involved. In accordance with our results, late bedtime (averagely after midnight) was found to be predominant among Egyptians,Citation32 as well as Ghazzawi adults.Citation30 Among 52 Japanese college students (mean age 19.4 ± 0.7), most were morning-types (9.6%) or intermediate-types (71.2%), while nearly one-fifth (19.2%) were evening-types.Citation33 In another cohort study of 36,601 retired employees in China, more than half (51.3%) were “late to bed”.Citation34
Studies on the association between sleep-wake habits and morbimortality showed disparate but insightful results. In a study of 1229 British subjects aged 65 and over,Citation35 the LL pattern showed no significant association with health disadvantages. Similarly, among 949 Canadian men admitted to the hospital with acute myocardial infarction,Citation36 the long-term mortality (for a mean of 3.7 years) of EE patients did not differ significantly from other sleep-wake habits groups. In another recent cohort study of 36,601 middle-aged and elderly Chinese subjects, sleep-wake habits were not associated with the number of hospitalizations. However, compared with EE subjects, the “late to bed” (including LE and LL) were more likely to visit the doctors with an OR increased by 13% and 27% respectively.Citation34 The causal nature of this cannot presently be confirmed owning to the cross-sectional design of the study.Citation37 We did not find any significant difference in the overall prevalence of chronic diseases between sleep-wake groups. However, LE participants showed significantly higher CCI, with higher prevalence rates of systemic hypertension, OSA, hyperthyroidism and physical handicap, when compared to other sleep-wake groups.
In the present study, the mean reported sleep duration was 7.05±1.48 hours and the prevalence rates of short sleepers and long sleepers were 34.7% and 12.3% respectively. Reported data on sleep duration not only varied across countries but also changed within the same reporting source over time. In a self-administered cross-sectional online survey of 805 Saudi adults, almost half (49.6%) reported getting 7 hours of sleep or less daily, while more than one in ten (11%) used to sleep for 10 hours or more.Citation38 Similar results were reported with a phone survey that included 2500 adults from Qatar. In this study, participants exhibited a low prevalence of normal sleep duration (54%) and a high prevalence of short sleep duration < 7 hours (42%), while only 4% reported sleeping > 8 hours.Citation39 According to another study using data from the National Health and Nutrition Examination Survey (2017–2020) among 9004 American adults ≥ 20 years, nearly a quarter (23.1%) were short sleepers, and just under one-fifth (19.7%) were long sleepers.Citation40 Using data from repeated cross-sectional surveys around the world (the Multinational Time Use Survey), the change in the prevalence of short and long sleep duration in 10 industrialized countries (n=328,018 adults) during the period 1970–2000 was investigated. Short sleep was most prevalent in Canada (11.2–11.5%) and least prevalent in the Netherlands (consistently <1%). Regarding long sleep duration, Italy had the highest prevalence rates (35.1–40.5%), while Germany had the lowest rates (22.7–24.0%). Over the periods covered by data, limited increases in short sleep duration prevalence were observed (in two countries only), while rising prevalence rates of long sleep were found in 6 of the 10 countries surveyed.Citation6 These results suggest that long sleep duration is more widespread than short sleep duration in industrialized societies, in contrast with Arab societies, in which individuals are more prone to be short sleepers than long sleepers.
More than two-thirds of participants (69.3%) in our study reported regular daytime napping immediately after lunchtime and/or in the late afternoon (between 12:00 and 08:00 p.m.). This indicates that a substantial proportion of Tunisian adults tend to prefer a bimodal sleep pattern, including a major night-time sleep episode, and then a minor daytime nap.Citation41 While the prevalence of bimodal sleep patterns is still undetermined, anecdotal reports suggest that this practice is commonly observed among Arabic individuals, probably in an attempt to catch up their sleep debt resulting from short sleep duration.Citation42 It was also suggested that taking an afternoon nap could be helpful in combating hot weather, as is the case for most Arab countries. In our study, the highest prevalence rates of daytime naps were found in participants living in the hottest areas (Southern governorates). In a study involving 78 Egyptian adults, nearly 2-hour mid-late afternoon naps occurred on 31% of days, the bedtime averaged after midnight and the rise time was 8:30 am, with an average sleep duration of 7.6 hours. The authors concluded that late bedtime and relatively short sleep duration were counterbalanced by later rise time and long mid-late afternoon naps.Citation32 Napping is less common in HIC. In a recent metanalysis including 409,617 people from the Netherlands, the UK, and the USA, 13.7% of people between 26 and 64 years, and 27% of people aged > 65 years reported napping regularly.Citation21
Factors Associated with Sleep Quality, Insomnia, and EDS
This study showed that poor sleep quality, insomnia and EDS were not independently associated with age. Data on changes in sleep quality with age are very disparate. Studies conducted in the USACitation43 and Gaza StripCitation30 found that age did not affect sleep quality. In contrast, an epidemiological investigation of self-reported sleep (using PSQI) in 2406 healthy adults (age 18–98) from the UKCitation44 observed that some aspects of sleep quality deteriorated with ageing, while other aspects remain stable or even improved. Younger adults in this study were more likely than older adults to experience poor sleep quality and longer sleep latency, whereas older adults were more likely to display sleep efficiency. In addition, the probability of being a “good” sleeper, unaffected by any adverse sleep disturbance, decreased strongly after age 50. Another study conducted with a large sample group (N= 223,334) obtained from the Community Health Survey of KoreaCitation45 showed that the average PSQI score increased with age groups. Moreover, subjects aged ≥ 65 years scored higher in most components of PSQI, while daytime dysfunction scored higher in subjects aged < 65 years. Taken together, these findings suggest that age-related changes in sleep quality are complex, multifaceted, and not captured well by summary measures such as the PSQI.
In the present study, women were consistently more likely than men to report poor sleep quality and EDS, with each OR increased by 30% compared to men. These findings are in line with previous studies that have identified female gender as a strong risk factor for sleep problems. In a study of 3141 public officials from Egypt, a country that shares some cultural and sociodemographic similarities with Tunisia, the prevalence of sleep disorders as assessed by The Jenkins Sleep Evaluation (JSEQ) questionnaire was substantially higher among women than men (26.2% and 14.5% respectively).Citation26 Findings from the above-mentioned INDEPTH WHO-SAGE Study also showed a consistent pattern of increased prevalence of sleep problems in women compared to men across all the 8 LMIC included (overall, 19.8% in women vs 12.8% in men).Citation2 Similar results were observed in HIC. In a cross-sectional study where 2144 adults from Spain were assessed through the PSQI, women were almost two times more likely than men to have poor quality sleep.Citation46 Likewise, women from the Netherlands, UK and USA reported more insomnia problems, slightly lower sleep efficiency, and more frequent use of sleep medication than men.Citation21 These commonly reported gender disparities in sleep quality emerge during puberty, suggesting sex hormones, among other psychosocial factors such as lifestyle, parenting, or mood disturbances, might make women more prone to sleep problems. In this respect, anxiety, depression, and a history of psychiatric diseases were identified as strong predictors of sleep difficulties for young Australian women,Citation47 as well as for Ghazzawi adult women.Citation30 In our study, moderate to severe depression was significantly more prevalent in women than men which may partially explain their higher rates of poor sleep quality.
In our study, poor sleep quality, insomnia and EDS were associated with neither marital status nor number of children aged < 6 years. However, EDS was found to be independently associated with big family size. Several researches have linked sleep quality with marital status, yet mechanisms of this interaction have rarely been investigated. According to a British nationally representative cross-sectional survey (the 2000 Psychiatric Morbidity Survey),Citation48 which interviewed 8578 men and women aged 16–74, divorced and widowed respondents reported significantly more sleep problems compared with married respondents. More recent data from 2872 participants 50–74 years old from the ORANJ BOWLSM, a longitudinal panel study in New Jersey,Citation49 also identified marital status and marital transition as important predictors for at least some indices of sleep quality. However, the authors emphasized that transitions into and out of marriage were more detrimental for sleep quality than marital status continuity. These findings were consistent with an earlier study (n = 2230 adults aged 54–93 years in the Multi-Ethnic Study of Atherosclerosis Sleep Cohort)Citation50 that also showed no significant differences in self-reported sleep quality between individuals who were married and those who were in any of the unmarried groups. Taken together, these results suggest that not all marriages promote good sleep quality, and it depends on the underlying relationship processes associated with marriage. Thus, for married couples, happy relationships are associated with better sleep, whereas unhappy relationships are tied to poorer sleep. Moreover, sharing a bed may affect sleep quality if the partner has different sleep habits, snores regularly/loudly, or suffers from health issues that need overnight care.Citation51
The relationship between sleep problems and household demographics remains unclear. Data from an actigraphy-derived sleep analysis (318 nights) including 49 adult villagers from Congo Basin indicated that parents sleeping close to their infants had better sleep quality than those who put their infant in a separate room at night.Citation52 These findings diverge from previous research in Euro-American populations. According to the 2008 Behavioral Risk Factor Surveillance System (BRFSS) survey, a population-based telephone survey of 395,407 American adults, those living with a higher number of children in the household were more likely to experience insufficient sleepCitation53 These divergent results suggest that the impact of household demographics on sleep quality differs according to local socio-ecological conditions.
In our study, participants with university- level education were 70% more likely to experience poor sleep quality compared to less educated adults. These findings contrast with previous reportsCitation54 which have suggested that increasing education confers appropriate sleep duration and healthier sleep quality. Curiously, more recent studies highlighted the complexity of the association between education and sleep. Using the 2004–2018 National Health Interview Survey of 356,048 adults from the USA,Citation55 it was found that greater education was significantly associated with better sleep quality and duration but only for white respondents. In contrast, this association was reversed or muted in black and Hispanic respondents, with the worst sleep outcomes reported by those with college-level education. These patterns remained after adjusting for confounding covariates. Therefore, it was suggested that the protective effect of education for sleep is not uniform and may vary across racial/ethnic groups.
In the current study, nocturnal-shift workers had a significantly higher prevalence of poor sleep quality, and they were 30% more likely to sleep badly than non-shift-workers. White-collar workers were more prone to experience EDS than blue-collar workers. In line with our findings, a recent meta-analysisCitation56 reported substantially high prevalence rates of sleep disorders, including shift work disorder (SWD) (31%), OSA (30%), insomnia (28%), and EDS (28%), among 101,080 first responders for medical emergencies. Significant moderator variables for sleep disorder prevalence in this study were age, gender, being first responders, continent, study quality, study design, and assessment tool. Moreover, insomnia and OSA were found to be associated with an increased likelihood of anxiety, depression, cardiovascular disease, diabetes mellitus, gastroesophageal reflux disease, and post-traumatic stress syndrome. These results highlight the importance of early sleep disorder screening and management among shift workers as it can help promote healthy sleep and prevent mental and physical health problems.
Data about the relationship between sleep and types of occupation are both rare and divergent as most of the past studies did not exclude the effect of shift work. In a representative sample of 18,316 Chinese workers aged 18–65,Citation57 blue-collar work was found to have an increased likelihood of shortened sleep duration (OR:1.22, 95% CI 1.01–1.48) and poor sleep quality (OR:1.24, 95% CI: 1.11–1.40) as compared to other occupations types. More recent findings from 17,519 Japanese workers without night shiftsCitation58 demonstrated that occupation type was an independent factor affecting sleep duration in both genders. In men, the longest and shortest sleep durations were observed in white-collar and blue-collar workers, respectively. As for women, the longest and shortest sleep durations were observed in the pink-collar and blue-collar workers, respectively.
We found that active smoking was associated with nearly twice the risk of insomnia and a 50% increased risk of poor sleep quality. These results are consistent with findings from prior studies in other populations. In a population-based study of 26,282 Chinese participants (12 years of age or older),Citation59 smokers were significantly more affected in almost all PSQI domains in comparison with nonsmokers (p<0.001). They also exhibited a significantly higher prevalence of poor sleep quality (32.7% vs 24.5% respectively; p <0.001). These differences in sleep quality by smoking status remained significant even after statistical adjustment for educational level, marital status and living area. A mice study demonstrated that both chronic and acute smoking can impair the expression of clock genes, and that biological clocks were disrupted with increased cigarette exposure.Citation60
Our results showed that internet use close to bedtime was an independent predictive factor for both poor sleep quality and EDS. These findings support the hypothesis that bedtime digital connection can adversely affect sleep quality. Data from the German Time Use Survey (TUS) German Socioeconomic Panel (SOEP)Citation61 showed that time spent playing computer games or watching TV and videos/DVDs in the evening (between 9 pm and midnight) was significantly associated with a higher likelihood of reporting insufficient sleep among teenagers (aged 13–19) and young adults (aged ≤ 30). It was also found that the use of computers and Smartphones at night was significantly correlated with shorter sleep duration among older adults (aged 31–59). Taking into account the critical impact of sleep on human health and well-being, these findings highlight the importance of increased public awareness and education about the risks associated with technology use in the evening, in order to promote healthier sleep.
In our study, more than one quarter of subjects had at least one comorbidity. The pooled estimates indicated that participants with severe depression, compared to those free of it, experienced nearly a two-fold risk and six-fold risk of developing EDS and insomnia, respectively, while the risk of poor sleep quality was increased by 60%. Associations between sleep-wake disorders and the presence of chronic diseases and health problems have been highlighted in several previous studies. A cross-sectional study in a representative sample of 1998 Brazilian adultsCitation62 found that the presence of health problems may double the risk of poor sleep quality as assessed by the PSQI. In a 36-year follow-up study of Finnish working-aged adults (n = 4847),Citation63 sleeping poorly or fairly poorly was reported 15 times more frequently by those rating their health as fairly poor than by those rating their health as very good, which suggested a strong association between sleep quality and self-rated health. According to the same study, depression symptoms as well as anti-depressant medication use were strongly associated with a substantially increased likelihood of poor sleep quality. In line with these findings, a nationwide cross-sectional survey of 2762 Korean adultsCitation64 showed that the group with both depression and anxiety (group 1) had worse scores on sleep-related scales (PSQI, ISI, ESS) when compared with the other groups (group 2: anxiety only, group 3: depression only, group 4: neither depression nor anxiety). Moreover, after adjusting for potential confounding factors, insomniac individuals were found to be almost 10 times more likely to experience anxiety, and 20 times more likely to experience depression. These results indicate that sleep quality is strongly linked to physical morbidity and mood disorders, but the reasons for this link are not well understood. Earlier papers suggested that poor sleep quality or insomnia is not only comorbid with several disorders, but may also be an independent risk factor, as shown in, for example, type 2 diabetes, and cardiovascular disease.Citation65 Furthermore, many longitudinal studies revealed a causative role of disordered sleep in the development of emerging or recurrent depression among young, middle-aged and older adults.Citation66–68 Conversely, data on 42,116 individuals 50 years or older from nine countries showed that many common chronic conditions are associated with an increased prevalence of sleep problems, even after adjustment for confounders.Citation69 Taken together, these studies suggest a complex bidirectional rather than a unidirectional relationship between sleep quality and comorbidities.
In the present study, we did not find any independent association between previous SAS-CoV2 infection and sleep-wake disorders. Our results are in marked contrast to those of 10 recent studies published between 1 January 2020 and 25 November 2022. All these studies point towards the high prevalence of sleep disturbance among Long Covid patients, with prevalence rates ranging from 10% to 70% depending on which subjective method was used.Citation70 CircsCOVIDCitation70 is the largest multi-centric prospective study to date investigating the burden of sleep disturbance following hospital admission for SARS-CoV2 infection in the UK. In this study, slightly under two thirds of subjects (62%) reported poor sleep quality in response to PSQI, while more than one half (53%) felt their sleep quality had declined following discharge after SARS-CoV2 admission, as assessed by the numerical rating scale (n=638). According to the same study, sleep disturbance following hospital admission for SAR-CoV2 infection was associated with dyspnoea, anxiety, and muscle weakness. This association, though the underlying mechanisms remain unknown, suggests that sleep disturbance could be an important trigger of Long Covid.
Limitations
Our study is subject to several limitations that might affect the accuracy of results and conclusions provided. First, the cross-sectional design of the study is a major limitation which causes a problem in establishing causality, despite a moderately large sample. Second, our study sample could not be fully representative of the general adult population in Tunisia. In fact, owing to our survey recruitment methods, some groups were more likely to respond than others, such as highly educated subjects, those who have access to the Internet, and those who are sufficiently biased to be interested in the subject. Third, all variables in our study were assessed with self-report instruments through a non-face-to-face survey, and no further explanation could be provided for participants, which may lead them to respond falsely or inaccurately to questions. Therefore, social desirability is almost inevitable Information about apneas was collected but not used to identify probable OSA and only participants with both loud snoring and EDS were considered at high risk for OSA. Finally, some important variables were not mentioned in this study such as weekday-to-weekend sleep differences, circadian rhythm sleep disorder, the presence of any pain, and afternoon nap duration.
Conclusion
This cross-sectional study showed that Tunisian adults often have a tendency to stay up late and prefer a bimodal sleep pattern. It also highlighted the high prevalence rates of poor sleep quality, insomnia, EDS, and sleep debt, which emphasize the need for an appropriate screening strategy for high-risk groups. Individuals with unhealthy lifestyles and those with depressive symptoms were significantly more likely to experience these kinds of disturbances. Consequently, there is a pressing need for sleep education and awareness and optimal management of significant mood symptoms in order to enhance knowledge and foster healthier sleep patterns.
Disclosure
We have no conflicts of interest to disclose.
References
- Koyanagi A, Stickley A. The association between sleep problems and psychotic symptoms in the general population: a global perspective. Sleep. 2004;38(12):1875–1885.
- Stranges S, Tigbe W, Gómez-Olivé FX, Thorogood M, Kandala NB. Sleep problems: an emerging global epidemic? Findings from the INDEPTH WHO-SAGE study among more than 40,000 older adults from 8 countries across Africa and Asia. Sleep. 2012;35(8):1173–1181. doi:10.5665/sleep.2012
- Atek M, Traissac P, El Ati J, et al. Obesity and association with area of residence, gender and socio-economic factors in Algerian and tunisian adults. PLoS One. 2013;8(10):1–10. doi:10.1371/journal.pone.0075640
- Exelmans L, Van den Bulck J. Bedtime mobile phone use and sleep in adults. Soc Sci Med. 2016;148:93–101. doi:10.1016/j.socscimed.2015.11.037
- CDC Sleep. How Much Sleep Do I Need? Available from: https://www.cdc.gov/sleep/about/index.html.
- Bin YS, Marshall NS, Glozier N. Sleeping at the limits: the changing prevalence of short and long sleep durations in 10 countries. Am J Epidemiol. 2013;177(8):826–833. doi:10.1093/aje/kws308
- Wang S, Rossheim ME, Nandy RR. Trends in prevalence of short sleep duration and trouble sleeping among US adults, 2005–2018. Sleep. 2023;46(1). doi:10.1093/sleep/zsac231
- Alami YZ, Ghanim BT, Zyoud SH. Epworth sleepiness scale in medical residents: quality of sleep and its relationship to quality of life. J Occup Med Toxicol. 2018;13:1–9.
- Huang YQ, Gou R, Diao YS, et al. Charlson comorbidity index helps predict the risk of mortality for patients with type 2 diabetic nephropathy. J Zhejiang Univ Sci B. 2014;15(1):58–66. doi:10.1631/jzus.B1300109
- Liu H, Wu X, Cao J, et al. Effect of comorbidity assessed by the Charlson comorbidity index on the length of stay and mortality among immobile hemorrhagic stroke patients younger than 50 years. Front Neurol. 2020;11:1–6. doi:10.3389/fneur.2020.00487
- Al Maqbali M, Hughes C, Gracey J, Rankin J, Dunwoody L, Hacker E. Validation of the Pittsburgh sleep quality index (PSQI) with Arabic cancer patients. Sleep Biol Rhythms. 2020;18(3):217–223. doi:10.1007/s41105-020-00258-w
- Buysse DJ, Reynolds CF, Monk TH, Berman SR, Kupfer DJ. The Pittsburgh sleep quality index: a new instrument for psychiatric practice and research. Psychiatry Res. 1989;28(2):193–213. doi:10.1016/0165-1781(89)90047-4
- Suleiman KH, Yates BC. Translating the insomnia severity index into Arabic. J Nurs Scholarsh. 2011;43(1):49–53. doi:10.1111/j.1547-5069.2010.01374.x
- Ahmed AE, Fatani A, Al-Harbi A, et al. Validation of the Arabic version of the Epworth Sleepiness Scale. J Epidemiol Glob Health. 2014;4(4):297–302. doi:10.1016/j.jegh.2014.04.004
- AlHadi AN, AlAteeq DA, Al-Sharif E, et al. An Arabic translation, reliability, and validation of patient health questionnaire in a Saudi sample. Ann Gen Psychiatry. 2017;16(1):1–9. doi:10.1186/s12991-017-0155-1
- Kroenke K, Spitzer RL, Williams JBW. The PHQ-9: validity of a brief depression severity measure. J Gen Intern Med. 2001;16(9):606–613. doi:10.1046/j.1525-1497.2001.016009606.x
- Abdulameer SA, Al-Jewari WM, Sahib MN. Psychological health status and salivary IgA among pharmacy students in Iraq: validation of PSS-4 and WHO-5 well-being (Arabic version). Pharm Educ. 2019;19(1):10–18.
- World Health Organisation. The World Health Organisation- Five Well-Being Index (WHO-5); 2020.
- Berhanu H, Mossie A, Tadesse S, Geleta D. Prevalence and associated factors of sleep quality among adults in Jimma Town, Southwest Ethiopia: a community-based cross-sectional study. Sleep Disord. 2018;2018:1–10. doi:10.1155/2018/8342328
- Simonelli G, Marshall NS, Grillakis A, Miller CB, Hoyos CM, Glozier N. Sleep health epidemiology in low and middle-income countries: a systematic review and meta-analysis of the prevalence of poor sleep quality and sleep duration. Sleep Health. 2018;4(3):239–250. doi:10.1016/j.sleh.2018.03.001
- Kocevska D, Lysen TS, Dotinga A, et al. Sleep characteristics across the lifespan in 1.1 million people from the Netherlands, United Kingdom and United States: a systematic review and meta-analysis. Nat Hum Behav. 2021;5(1):113–122. doi:10.1038/s41562-020-00965-x
- Tang J, Liao Y, Kelly BC, et al. Gender and regional differences in sleep quality and insomnia: a general population-based study in Hunan Province of China. Sci Rep. 2017;7(January):1–9. doi:10.1038/srep43690
- Lee YY, Lau JH, Vaingankar JA, et al. Sleep quality of Singapore residents: findings from the 2016 Singapore mental health study. Sleep Med X. 2022:4. doi:10.1016/j.sleepx.2022.100043
- Fatani A, Al-Rouqi K, Al Towairky J, et al. Effect of age and gender in the prevalence of excessive daytime sleepiness among a sample of the Saudi population. J Epidemiol Glob Health. 2015;5(4):S59–S66. doi:10.1016/j.jegh.2015.05.005
- Al Karaki G, Hallit S, Malaeb D, et al. Prevalence and factors associated with insomnia among a representative sample of the Lebanese population: results of a cross-sectional study. J Epidemiol Glob Health. 2020;10(2):124–130. doi:10.2991/jegh.k.200117.001
- Eshak ES. The prevalence and determining factors of sleep disorders vary by gender in the Egyptian public officials: a large cross-sectional study. Bull Natl Res Cent. 2022;46(1). doi:10.1186/s42269-022-00927-5
- Cao XL, Bin WS, Zhong BL, et al. The prevalence of insomnia in the general population in China: a meta-analysis. PLoS One. 2017;12(2):1–11. doi:10.1371/journal.pone.0170772
- Stickley A, Leinsalu M, DeVylder JE, Inoue Y, Koyanagi A. Sleep problems and depression among 237 023 community-dwelling adults in 46 low- and middle-income countries. Sci Rep. 2019;9(1):1–10. doi:10.1038/s41598-019-48334-7
- Okamura T, Ura C, Miyamae F, et al. Excessive daytime sleepiness is related to subjective memory impairment in late life: a cross-sectional community-based study. Psychogeriatrics. 2016;16(3):196–201. doi:10.1111/psyg.12139
- Msaad S, Ketata N, Fidha S, et al. Sleep habits and quality among war and conflict-affected Palestinian adults in the Gaza strip. Sleep Med. 2023;102:90–104. doi:10.1016/j.sleep.2022.12.025
- Bahammam AS. Sleep from an Islamic perspective. Ann Thorac Med. 2011;6(4):187–192. doi:10.4103/1817-1737.84771
- Worthman CM, Brown RA. sleeping in Egyptian families. J Family Psychol. 2007;21(1):124–135. doi:10.1037/0893-3200.21.1.124.Companionable
- Sukegawa M, Noda A, Morishita Y, et al. Sleep and lifestyle habits in morning and evening types of human circadian rhythm. Biol Rhythm Res. 2009;40(2):121–127. doi:10.1080/09291010701794404
- Ye B, Zhu Y, Wang X, Wei S, Liang Y. Association between sleep-wake habits and use of health care services of middle-aged and elderly adults in China. Aging. 2020;12(4):3926–3935. doi:10.18632/aging.102860
- Gale C, Martyn C. Larks and owls and health, wealth, and wisdom. Br Med J. 1998;317(7174):1675–1677. doi:10.1136/bmj.317.7174.1675
- Mukamal KJ, Wellenius GA, Mittleman MA. Early to bed and early to rise: does it matter? CMAJ. 2006;175(12):1560–1562. doi:10.1503/cmaj.060745
- Parida S, Kaufmann SHE. Tuberculosis Ac Ce p te d Us Cr Ip t Ac Ce p te d Us Cr t. 2018:1–39. doi:10.1093/asj/sjy179/5059000
- Althakafi KA, Alrashed AA, Aljammaz KI, Abdulwahab IJ, Hamza R, Asalah F Hamad KSA. Prevalence of short sleep duration and effect of co-morbid medical conditions – a cross-sectional study in Saudi Arabia. J Family Med Prim Care. 2019;8(10):3334–3339. doi:10.4103/jfmpc.jfmpc
- Al-Thani MA, Khaled SM. The relationship between sleep duration and health status in Qatar’s population. Public Health Pract. 2020;1(May):100056. doi:10.1016/j.puhip.2020.100056
- Di H, Guo Y, Daghlas I, et al. Evaluation of Sleep Habits and Disturbances Among US Adults, 2017–2020. JAMA Network Open. 2022;5(11):e2240788. doi:10.1001/jamanetworkopen.2022.40788
- Weaver MD, Sletten TL, Foster RG, et al. Adverse impact of polyphasic sleep patterns in humans: report of the National Sleep Foundation sleep timing and variability consensus panel. Sleep Health. 2021;7(3):293–302. doi:10.1016/j.sleh.2021.02.009
- Basner M. Arousal threshold determination in 1862: kohlschütter’s Measurements on the Firmness of Sleep. Sleep Med. 2010;11(4):417–422. doi:10.1016/j.sleep.2009.10.002
- Yong LC, Li J, Calvert GM. Sleep-related problems in the US working population: prevalence and association with shiftwork status. Occup Environ Med. 2017;74(2):93–104. doi:10.1136/oemed-2016-103638
- Gadie A, Shafto M, Leng Y, Kievit RA, Cam-CAN. How are age-related differences in sleep quality associated with health outcomes? An epidemiological investigation in a UK cohort of 2406 adults. BMJ Open. 2017;7(7). doi:10.1136/bmjopen-2016-014920
- Kim M, Um YH, Kim TW, et al. Association Between Age and Sleep Quality: findings From a Community Health Survey. Sleep Med Res. 2021;12(2):155–160. doi:10.17241/SMR.2021.01158
- Madrid-Valero JJ, Martínez-Selva JM, Ribeiro Do Couto B, Sánchez-Romera JF, Ordoñana JR. Age and gender effects on the prevalence of poor sleep quality in the adult population. Gac Sanit. 2017;31(1):18–22. doi:10.1016/j.gaceta.2016.05.013
- Bruck D, Astbury J. Population Study on the Predictors of Sleeping Difficulties in Young Australian Women. Behav Sleep Med. 2012;10(2):84–95. doi:10.1080/15402002.2011.592888
- Arber S, Bote M, Meadows R. Gender and socio-economic patterning of self-reported sleep problems in Britain. Soc Sci Med. 2009;68(2):281–289. doi:10.1016/j.socscimed.2008.10.016
- August KJ. Marital Status, Marital Transitions, and Sleep Quality in Mid to Late Life. Res Aging. 2022;44(3–4):301–311. doi:10.1177/01640275211027281
- Chen X, Wang R, Zee P, et al. Racial/ethnic differences in sleep disturbances: the Multi-Ethnic Study of Atherosclerosis (Mesa). Sleep. 2015;38(6):877–888. doi:10.5665/sleep.4732
- AARP and National Alliance for Caregiving. Caregiving in the United States 2020. AARP. 2020;2020:1–79.
- Links between household and family social dynamics with sleep profiles among BaYaka foragers of the Congo Basin - ScienceDirect.
- Adults AUS, Chapman DP, Wheaton AG, et al. Household demographics and perceived insufficient sleep. J Community Health. 2012;37(2):344–349. doi:10.1007/s10900-011-9451-x
- Stamatakis KA, Kaplan GA, Roberts RE. Short Sleep Duration Across Income, Education, and Race/Ethnic Groups: population Prevalence and Growing Disparities During 34 Years of Follow-Up. Ann Epidemiol. 2007;17(12):948–955. doi:10.1016/j.annepidem.2007.07.096
- Sheehan CM, Walsemann KM, Ailshire JA. Race/ethnic differences in educational gradients in sleep duration and quality among U.S. adults. SSM Popul Health. 2020;12. doi:10.1016/j.ssmph.2020.100685
- Huang G, Lee TY, Banda KJ, et al. Prevalence of sleep disorders among first responders for medical emergencies: a meta-analysis. J Glob Health. 2022;12:04092. doi:10.7189/jogh.12.04092
- Sun W, Yu Y, Yuan J, et al. Sleep duration and quality among different occupations-China national study. PLoS One. 2015;10(3). doi:10.1371/journal.pone.0117700
- Kakamu T, Hidaka T, Masuishi Y, et al. Effect of occupation on sleep duration among daytime Japanese workers: a cross-sectional study. Medicine. 2021;100(49). doi:10.1097/MD.0000000000028123
- Liao Y, Xie L, Chen X, et al. Sleep quality in cigarette smokers and nonsmokers: findings from the general population in central China. BMC Public Health. 2019;19(1). doi:10.1186/s12889-019-6929-4
- Hwang JW, Sundar IK, Yao H, Sellix MT, Rahman I. Circadian clock function is disrupted by environmental tobacco/cigarette smoke, leading to lung inflammation and injury via a SIRT1-BMAL1 pathway. FASEB J. 2014;28(1):176–194. doi:10.1096/fj.13-232629
- Billari FC, Stella L, Billari FC. DISCUSSION PAPER SERIES Broadband Internet, Digital Temptations, and Sleep Broadband Internet, Digital Temptations, and Sleep. IZA DP. 2017; 153(11050):58–76.
- Barros MB de A, Lima MG, Ceolim MF, Zancanella E, Cardoso TAM de O. Quality of sleep, health and well-being in a population-based study. Rev Saude Publica. 2019;53:82. doi:10.11606/s1518-8787.2019053001067
- Hublin C, Lehtovirta M, Partinen M, Koskenvuo M, Kaprio J. Changes in sleep quality with age–a 36-year follow-up study of Finnish working-aged adults. J Sleep Res. 2018;27(4). doi:10.1111/jsr.12623
- Oh CM, Kim HY, Na HK, Cho KH, Chu MK. The effect of anxiety and depression on sleep quality of individuals with high risk for insomnia: a population-based study. Front Neurol. 2019;10:1–8. doi:10.3389/fneur.2019.00849
- Luyster FS, Strollo PJ, Zee PC, Walsh JK. Sleep: a health imperative. Sleep. 2012;35(6):727–734. doi:10.5665/sleep.1846
- Ohayon MM, Roth T. Place of chronic insomnia in the course of depressive and anxiety disorders. J Psychiatr Res. 2003;37(1):9–15. doi:10.1016/S0022-3956(02)00052-3
- Fang H, Tu S, Sheng J, Shao A. Depression in sleep disturbance: a review on a bidirectional relationship, mechanisms and treatment. J Cell Mol Med. 2019;23(4):2324–2332. doi:10.1111/jcmm.14170
- O’Leary K, Bylsma LMRJ. Why might poor sleep quality lead to depression: a role for emotion regulation. Cogn Emot. 2017;31(8):1698–1706. doi:10.1037/emo0000703
- Koyanagi A, Garin N, Olaya B, et al. Chronic conditions and sleep problems among adults aged 50 years or over in nine countries: a multi-country study. PLoS One. 2014;9(12):1–17. doi:10.1371/journal.pone.0114742
- Jackson C, Stewart ID, Plekhanova T, et al. Effects of sleep disturbance on dyspnoea and impaired lung function following hospital admission due to COVID-19 in the UK: a prospective multicentre cohort study. Lancet Respir Med. 2023. doi:10.1016/S2213-2600(23)00124-8