
Abstract
Purpose
The reciprocal comorbidity of obstructive sleep apnea (OSA) and body mass index (BMI) has been observed, yet the shared genetic architecture between them remains unclear. This study aimed to explore the genetic overlaps between them.
Methods
Summary statistics were acquired from the genome-wide association studies (GWASs) on OSA (Ncase = 41,704; Ncontrol = 335,573) and BMI (Noverall = 461,460). A comprehensive genome-wide cross-trait analysis was performed to quantify global and local genetic correlation, infer the bidirectional causal relationships, detect independent pleiotropic loci, and investigate potential comorbid genes.
Results
A positive significant global genetic correlation between OSA and BMI was observed (rg = 0.52, P = 2.85e-122), which was supported by three local signal. The Mendelian randomization analysis confirmed bidirectional causal associations. In the meta-analysis of cross-traits GWAS, a total of 151 single-nucleotide polymorphisms were found to be pleiotropic between OSA and BMI. Additionally, we discovered that the genetic association between OSA and BMI is concentrated in 12 brain regions. Finally, a total 134 expression-tissue pairs were observed to have a significant impact on both OSA and BMI within the specified brain regions.
Conclusion
Our comprehensive genome-wide cross-trait analysis indicates a shared genetic architecture between OSA and BMI, offering new perspectives on the possible mechanisms involved.
Introduction
Obstructive sleep apnea (OSA), which is characterized by recurrent blockages of the upper respiratory tract while sleeping, is a globally increasingly prevalent health issue impacting around 936 million adults in the general population.Citation1,Citation2 Body mass index (BMI) is the most frequently employed method to evaluate obesity, a condition characterized by the excessive accumulation of fat that detrimentally affects one’s health.Citation3 Numerous clinical studies have implied that OSA is comorbid with BMI.Citation4–7 Approximately 50% of individuals diagnosed with OSA exhibit obesity, and OSA affects 40–90% people with moderate to severe obesity.Citation7 The heritability of BMI, estimated at 40–70%,Citation8,Citation9 highlights a significant genetic basis for obesity. Similarly, OSA shows genetic predisposition, with heritability estimates of 0.06 to 0.17 in population-based studiesCitation10,Citation11 and 0.33–0.37 in family-based studies,Citation12 emphasizing the genetic intersection between these conditions. Potential shared mechanistic factors, including oxidative stress,Citation13 inflammation,Citation14 metabolic dysregulation,Citation15,Citation16 gut microbiota,Citation17 have been implicated in both OSA and obesity. The identification of shared genetic variants associated with both OSA and obesity has the potential to yield valuable insights into the underlying pathogenic mechanisms, and facilitate the development of novel targeted drugs and therapies.
Strausz et al have quantified a strong genetic correlation (rg = 0.72) and proposed a potential causal relationship between OSA and BMI.Citation10 However, these results should be interpreted cautiously because of the relatively limited sample sizes and potential sample overlap. Additionally, no studies have uncovered the risk loci exhibiting pleiotropic effects that are shared between OSA and BMI.
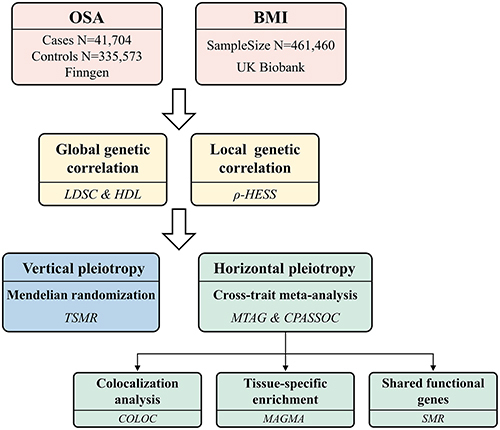
In this study, we extended previous findings by conducting a comprehensive genome-wide cross-trait analysis, utilizing summary data from the largest available genome-wide association studies (GWASs) on both OSA and BMI. Firstly, we calculated the global and local genetic correlations between OSA and BMI, and subsequently accessed the causal relationship between them. Then, we utilized a genome-wide cross-trait meta-analysis to investigate the pleiotropic loci. Finally, we employed the Genotype-Tissue Expression (GTEx v8) database to identify SNP (single nucleotide polymorphism) -enriched tissues and potential functional genes associated with both OSA and BMI. This study design is illustrated in .
Figure 1 Overall study design of genome-wide cross-trait analysis.
Methods
Datasets
GWAS summary statistics for OSA were provided by the FinnGen Consortium (https://www.r9.finngen.fi/),Citation18 which contain 41,704 cases and 335,573 controls. Analysis adjusted for covariates such as sex, age, genotyping batch, and ten principal components (PCs) to account for population stratification. The diagnosis of OSA in FinnGen was defined according to ICD-10: G47.3. Diagnosis required patients to exhibit subjective symptoms, undergo clinical examinations, and have sleep registration findings of an apnea-hypopnea index (AHI) or respiratory event index (REI) >5/hour, thus confirming OSA. The GWAS data for BMI, comprising 461,460 individuals, was acquired from a meta-analysis of GWASs in the UK Biobank conducted by MRCIEU (ID: ukb-b-19953). The model used covariates such as genotype array, sex, and the first 10 out of 40 PCs.
The IEU Open GWAS Project (https://gwas.mrcieu.ac.uk/) made the statistical data available for public download. The study’s analyses relied on publicly accessible summary-level GWAS datasets, which have obtained ethical approval from their respective institutional review boards and informed consent from participants. Considering our study’s exclusive reliance on pre-approved, publicly accessible datasets and the absence of any further data collection or human participant analysis, it was deemed exempt from separate ethical approval requirements.
Statistical Analysis
Overall and Local Genetic Correlation Analysis
The genetic correlations between OSA and BMI were estimated through linkage disequilibrium score regression (LDSC, https://github.com/bulik/ldsc) and the high-definition likelihood (HDL, https://github.com/zhenin/HDL) methods, utilizing GWAS summary statistics.Citation19,Citation20 The LDSC method enables the quantification of the impact of polygenicity and confounding biases (cryptic relatedness and population stratification) through the analysis of the association between test statistics and linkage disequilibrium (LD). We excluded the SNP with a minor allele frequency (MAF) lower than 0.01 and estimated the single-trait SNP heritability for OSA and BMI using LDSC with the baseline-LD model. Next, we conducted bivariate LDSC analysis without imposing constraints on the intercept to estimate the rg coefficient, which quantifies the genetic correlations between OSA and BMI. Since there was no sample overlap, we also performed a sensitivity analysis by constraining the single-trait heritability intercept. Compared with LDSC, the precision of genetic correlation estimation is enhanced by the HDL method by considering genome-wide LD. Thus, we performed HDL analysis to guarantee reliable results of the genetic association between OSA and BMI.
To evaluate the local genetic correlation between OSA and BMI, we employed the rho-heritability estimation from summary statistics (ρ-HESS; https://github.com/huwenboshi/hess) technique.Citation21 The algorithm’s analysis of 1703 independent LD regions, each averaging around 1.6 Mb, not only facilitates the identification of genomic areas with a disproportionate influence on genetic sharing across traits but also significantly enhances the precision of genetic association analyses. Utilizing the 1000 Genomes Project as the reference, we calculated the local SNP heritability for the two aforementioned traits across 1703 independent genomic blocks, as well as the local (at each LD-independent region in the genome) and genome-wide genetic correlation existing between them. For multiple testing, the Bonferroni correction (0.05/1703) was applied.
Bidirectional Mendelian Randomization
Based on the findings of genetic correlations, a two-sample Mendelian randomization (MR) analysis was employed to investigate the bidirectional causal association between OSA and BMI using the “TwoSampleMR” R package.Citation22 The analysis was undertaken in both directions, (i) using OSA as exposure and BMI as outcome, and (ii) using BMI as exposure and OSA as outcome. We used SNPs as instrumental variables that were associated with exposure at a genome-wide significance level (P < 5e-8) and were not in LD with other SNPs (r2 < 0.001 within a clumping window of 10,000 kb). When the instrumental variable SNPs were absent from the outcome GWAS, we selected proxy SNPs (r2 > 0.8 with the original SNP) using the “LDLinkR” package.Citation23 For harmonizing the SNP effects on the exposure and the outcome, we corrected the strand for non-palindromic SNPs and dropped all palindromic SNPs.
The inverse variance weighted (IVW) regression under random or fixed effects was employed for the primary MR analysis. For sensitivity analyses, other methods such as MR-Egger, weighted median, and maximum likelihood were also used as supplements to IVW.Citation24–26 To detect the horizontal pleiotropy, the MR-Egger regression intercept was employed. Furthermore, MR pleiotropy residual sum and outlier (MR-PRESSO) analysis was performed to identify any potential horizontal pleiotropy and outliers. In the case of outliers, we removed the outlier SNPs and repeated the MR analysis. Finally, a leave-one-out analysis was performed in order to examine the robustness of MR results for any outlier SNP.
Cross-Trait Meta-Analysis
Utilizing the genetic correlation and estimation error correlation across traits, Multi-Trait Analysis of GWAS (MTAG; https://github.com/JonJala/mtag) conducts multivariate analysis on genetically correlated traits to enhance the detection power for each input trait, offering trait-specific effect estimates and P values.Citation27 MTAG was employed to identify novel candidate SNPs associated to joint phenotypes of OSA and BMI. The “maxFDR”, an upper bound on the false discovery rate (FDR) for the GWAS, was computed according to the recommended methodology. Leveraging MTAG to generate trait-specific SNP effect estimates, we utilized MTAG summary statistics (MTAGOSA and MTAGBMI) in subsequent analyses. This approach capitalizes on MTAG’s ability to serve as an effective substitute for individual trait GWAS summary data.
The Cross Phenotype Association (CPASSOC) is a method devised to incorporate multiple traits’ association evidence from numerous GWASs, thereby facilitating the detection of cross-phenotype associations.Citation28 We executed CPASSOC analysis to identify shared loci between GWASOSA and GWASBMI, thus substantiating the findings derived from MTAG. Two statistics, SHet (heterogeneous effects between GWASs) and Shom (homogeneous effects between GWASs), were calculated by CPASSOC. While SHom serves as the foundation for SHet, the latter’s power can be strengthened when the genetic effect sizes demonstrate variations across different traits. The SNPs with PShet < 5e-8 and PMTAG <5e-8 were considered as candidate SNPs exhibiting effects on both traits. The PLINK “clumping” function was then utilized to identify the independent SNPs that exhibited the most significant association with both traits, which was achieved by applying the following parameters: –clump-p1 5e-8 –clump-p2 1e-5 –clump-r2 0.2 –clump-kb 500. Novel loci were defined as independent SNPs that were not genome-wide significant (P < 5e-8) or in LD (r2 > 0.01 within a clumping window 1000 kb) with any genome-wide significant SNPs in the GWASOSA and GWASBMI.
Colocalization Analysis and SNP Annotation
We utilized the “coloc” R package for colocalization analysis to estimate the probability that the independent SNPs associated with OSA and BMI represented shared genetic causal variants between the two traits.Citation29 We procured summary data from MTAG (MTAGOSA and MTAGBMI) for variants located within 1-Mb regions centered on each independent SNP. Subsequently, we calculated the PPH4, which stands for the posterior probability of H4, which represents the likelihood that both traits share a single causal variant. PPH4 > 0.95 was considered colocalized. The colocalizing pleiotropic SNPs identified through colocalization analysis were mapped to genes using the Ensembl Variant Effect Predictor (VEP).Citation30
Tissue-Specific Enrichment Analysis
Multi-marker Analysis of GenoMic Annotation (MAGMA) was utilized to conduct a gene-based association and tissue-specific enrichment analysis.Citation31 The estimation of the association between a specific gene and the trait was conducted by averaging P-values of the SNPs located near the target gene, utilizing the MTAG summary statistics (MTAGOSA and MTAGBMI). To determine which tissues are most strongly associated with the shared genes, we calculated the correlation between tissue-specific gene expression profiles and trait-gene associations using data from GTEx, which contains information from 54 different tissues. The Bonferroni correction (0.05/54) was applied for multiple testing.
Summary-Data-Based Mendelian Randomization
Summary-data-based Mendelian Randomization (SMR) utilizes Mendelian randomization for testing pleiotropic connections between gene expression and complex traits by utilizing expression quantitative trait loci (eQTL) and trait GWAS data.Citation32 We performed SMR analysis using MTAG summary statistics (MTAGOSA and MTAGBMI) in conjunction with cis-eQTL summary data from 49 human tissues provided by the GTEx project, to identify potentially causal genes for OSA and BMI. A heterogeneity in dependent instruments (HEIDI) test was also conducted to examine the presence of heterogeneity. Genes that met the criteria of passing the Bonferroni correction for multiple comparisons test (P < 0.05/ number of genes) and the HEIDI outlier test (PHEIDI > 0.05) in each tissue were considered to be significant causal genes. The causal genes that co-occurred in the same tissue in both traits and overlapped with colocalizing SNP-associated genes were considered as shared functional genes.
Results
Genetic Corrections
Single-trait LDSC shows SNP heritability estimates of 0.0439 (SE = 0.0026) for GWASOSA and 0.2532 (SE = 0.0087) for GWASBMI. The LD Score regression intercept for GWASOSA and GWASBMI were 1.1116 (SE =0.0104) and 1.0999 (SE = 0.022) respectively. The genetic correlation between OSA and BMI was estimated using bivariate LDSC. The genetic correlation between OSA and BMI (rg = 0.52, P = 2.85e-122) was significant positive. By assuming no sample overlap, we constrained the LDSC intercept, resulting in a slightly weaker but still significant genetic correlation (Supplementary Table S1). HDL also shows a positive genome-wide correlation of OSA and BMI (rg = 0.486, SE = 0.050, PHDL = 4.73E-22) (Supplementary Table S2).
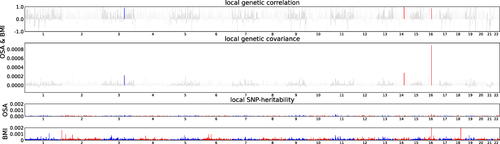
To ascertain local genetic correlations between OSA and BMI, the ρ-HESS approach was utilized. Following the application of the Bonferroni correction, significant regional associations were observed in chromosome 3 (130244735–131836516), chromosome 14 (78561945–80186579) and chromosome 16 (53382572–55903774) (; Supplementary Tables S3–S5). Following this analysis, the genes located within the regions exhibiting significant local correlations were annotated. A total of 22 genes, such as FTO, MMP2, and NRXN3, were identified. Detailed information on these genes can be found in Supplementary Table S6. We calculated the local single-trait SNP heritability across 1703 independent genomic blocks for OSA (h2 = 0.0801, SE = 0.00322) and BMI (h2 = 0.317, SE = 0.00233). The genome-wide genetic correlation, calculated using ρ-HESS, between OSA and BMI (rg = 0.303) showed substantial consistency when compared to bivariate LDSC.
Figure 2 Local genetic correlation between OSA and BMI. Manhattan plot displayed the calculations of the local genetic correlation and local genetic covariance between OSA and BMI, along with their respective local SNP heritability. The presence of red and blue bars in “local genetic correlation” and “local genetic covariance” indicate significant regions sharing SNP heritability. These regions meet the criteria (P < 5e-08 in local SNP heritability test, and P < 0.05/1703 in local genetic covariance test).
Bidirectional Mendelian Randomization
To investigate the causal relationship between OSA and BMI, we performed a bidirectional two-sample MR analysis. In the forward MR analysis, a total of 10 SNPs from GWASOSA were finally identified as instrumental variables after excluding outliers detected in the MR-PRESSO analysis (Supplementary Table S7). Using IVW method, genetically predicted OSA was associated with a 0.160 (kg/m2) increase in BMI (P = 7.25e-24), which was further supported by MR-Egger, weighted median, and maximum likelihood methods (). There was no detected pleiotropy in MR-Egger analyses (P = 0.395, Egger_intercept = −0.00629) (Supplementary Table S8).
Figure 3 Forest plots of bidirectional MR analysis between OSA and BMI. (A) forward MR analysis; (B) reverse MR analysis.
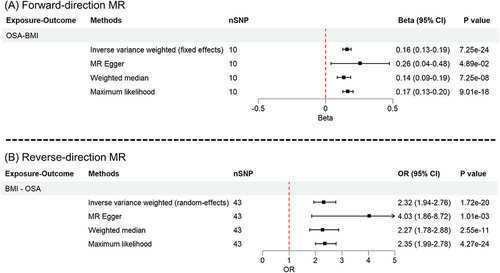
The reverse MR analysis identified 43 SNPs as the final instrumental variables referring to BMI from GWASBMI after excluding outlying SNPs from the MR-PRESSO analysis (Supplementary Table S9). With every 1-SD kg/m2 increase in genetically predicted BMI, the MR IVW estimate revealed a higher likelihood of OSA (OR = 2.32, P = 1.72e-20). Sensitivity analyses (MR-Egger, weighted median, and maximum likelihood) yielded consistent findings (). No evidence of imbalanced horizontal pleiotropy was found in the MR-Egger test (P = 0.156, Egger_intercept = −0.00923) (Supplementary Table S8). In both forward and reverse MR analyses, the results were robust to leave-one-out sensitivity analyses (Supplementary Figure S1).
Cross-Trait GWAS Meta-Analysis
The cross-trait GWAS meta-analyses were conducted to discover risk SNPs that underlie the joint phenotypes OSA-BMI, considering the substantial genetic correlations between OSA and BMI. We employed two different approaches, MTAG and CPASSOC, that complemented each other. MTAG identified a collective sum of 5539 genome-wide significant SNPs (P <5e-8), all of which exhibited overlap with the 58,716 genome-wide significant SNPs revealed in CPASSOC (Supplementary Table S10), indicating the reliability of MTAG results. No inflation problems were indicated by the maxFDR values of 0.020 and 4.98e-06 for OSA and BMI in the MTAG analyses, respectively. The MTAGOSA and MTAGBMI were then used for subsequent analysis. By LD analyses for the 5539 SNPs present in both MTAG and CPASSOC, a total of 151 shared independent SNPs were identified (Supplementary Table S11). After excluding independent SNPs that exhibited genome-wide significance (P < 5e−8) or were in LD with previously significant SNPs in the GWASOSA and GWASBMI, we discovered 3 novel pleiotropic SNP (rs11782826, rs6730157, rs7701723) linked to the joint phenotype of OSA-BMI (Supplementary Table S11).
Colocalization and Annotation
To ascertain whether the genetic variants responsible for the association in both traits were identical or distinct, a colocalization analysis was then conducted. The majority of shared loci between MTAGOSA and MTAGBMI exhibited colocalization at identical candidate SNPs (PPH4 > 0.95) (117/151) (Supplementary Table S12). Two of the three novel pleiotropic loci (rs11782826 and rs7701723) displayed evidence of colocalization (PPH4 > 0.95). The most significant novel shared SNP, rs11782826 (PCPASSOC=1.51e-10), is at an intron region of ERI1. SNP rs7701723 is located in an intron of COMMD10 (Supplementary Table S13).
Tissue Specific Enrichment Analysis
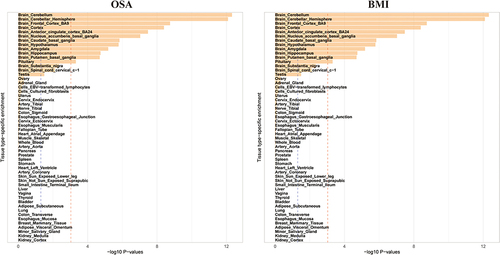
Utilizing MTAGOSA and MTAGBMI summary data, we employed MAGMA for tissue expression analysis to identify tissues enriched with SNPs associated with OSA and BMI. This analysis aimed to examine the associations between genes linked to OSA and BMI and tissue-specific gene expression profiles across 54 tissue types sourced from GTEx. SNPs associated with OSA and BMI were specifically enriched in the same 12 central nervous system (CNS) related tissues, leading by brain cerebellum, cerebellar hemisphere, frontal cortex Brodmann area 9 and cortex. ().
Figure 4 Tissue specific enrichment of SNP heritability for OSA and BMI. A total of 12 tissues were shared in enrichment of SNP heritability for OSA and BMI after adjustment (P < 0.005/54). Blue line indicates threshold 0.05 for P value, and red line indicates 0.05/54.
Summary-Data-Based Mendelian Randomization
Utilizing GTEx eQTL summary data, SMR was adopted to identify functional genes implicated in both OSA and BMI. At the tissue-specific Bonferroni-corrected threshold, a total of 602 expression-tissue pairs were shared between OSA and BMI, covering all tissues except for the cervical C-1 region of the brain and spinal cord (Supplementary Table S14). Within these pairs, 98 are coincident with colocalizing pleiotropic SNP-associated genes, implicating 15 genes (C18orf8, PMS2P11, UPK3BP1, DTX2P1, ERI1, CPNE4, NPC1, SOX7, TRAF3, POC5, GRID1, MSRA, BDNF-AS, XKR6, MACF1) across 38 tissues. Among these genes, six (C18orf8, NPC1, PMS2P11, POC5, SOX7, TRAF3) were present in seven of the twelve central nervous system (CNS)-related tissues identified by the MAGMA analysis, suggesting their role as shared functional genes between OSA and BMI, as shown in
Table 1 Six Genes Obtained from the Intersection of Genes Identified by SMR and Those Associated with Colocalized SNPs
Discussion
The objective of this research was to examine the shared genetic architecture between OSA and BMI by conducting a comprehensive genome-wide cross-trait analysis. Significant positive genetic correlations between OSA and BMI were observed at both the global and local levels, indicating an inherent association between these complex traits. The genetic correlation could be categorized as vertical and horizontal pleiotropy, supported by validated bidirectional causal associations through MR analysis, the identification of shared independent pleiotropic loci in cross-trait meta-analysis, and the recognition of shared expression-trait pairs using MAGMA and SMR.
The significant result of global genome-wide genetic correlation between OSA and BMI calculated by LDSC (rg = 0.52, P = 2.85E-122) and HDL (rg = 0.486, PHDL = 4.73E-22) was in line with the estimate of 0.72 reported by Strausz et al.Citation10 In contrast to the study conducted by Strausz utilizing FinnGen dataset for both OSA (16,761 cases/ 201,194 controls) and BMI (159,731 individuals), we enhanced the reliability and accuracy of our findings by increasing the sample sizes and avoiding sample overlap. We achieved this by utilizing summary statistics of OSA (41,704 cases and 335,573 controls) from the latest FinnGen dataset (R9) and summary statistics of BMI (461,460 individuals) from the UK Biobank. The global correlation between OSA and BMI was supported by the local genetic correlation analysis, which identified three genomic regions at chr3: 130244735–131836516, chr14: 78561945–80186579, and chr16: 53382572–55903774, indicating significant local genetic correlations between the two traits. Within these genomic regions, a total of 22 genes were annotated. Notably, FTOCitation10,Citation33 and MMP2Citation34,Citation35 have been reported to have a strong association with both OSA and obesity. The majority of the remaining genes, such as AKTIP,Citation36 IRX3,Citation37 RBL2,Citation38 RPGRIP1L,Citation39 and SLC6A2,Citation40 are closely related to the pathogenesis of obesity. This genetic evidence highlights the intricate relationship between genetic factors and the development of obesity and OSA.
Our MR analysis not only supported previous findings but also extended them. Strausz reported that an elevated BMI correlated with a greater incidence of OSA (β = 0.67, OR = 1.95), aligning with our own findings, which demonstrated a BMI-related rise in OSA incidence (OR = 2.32).Citation10 Furthermore, we identified a reverse causal relationship, namely, OSA was associated with a 0.160 (kg/m2) increase in BMI. The above results substantiated the tight relationship between OSA and BMI as indicated by previous observational studies.Citation41–43
Notably, existing research underscores a significant association between OSA and dyslipidemia. Evidence from twin studies indicates that the co-occurrence of OSA and hypertriglyceridemia is influenced by genetic factors.Citation44 Furthermore, a study conducted by Tang et al reveals that genetically increased triglyceride levels contributes to the risk of sleep apnea.Citation45 Additional research suggests that obesity leads to insulin resistance through the impaired production of adipokines and chronic low-grade inflammation in adipose tissue, which serves as the main driving force in the development of metabolic dyslipidemia.Citation46 These findings indicate a multifaceted relationship among OSA, BMI, and dyslipidemia. BMI may influence the development of OSA through dyslipidemic pathways, while OSA, in turn, might affect dyslipidemia through mechanisms related to BMI. Elucidating the precise mechanisms underpinning these associations necessitates comprehensive future research.
Through our cross-trait meta-analyses, we have identified multiple pleiotropic loci, suggesting a shared genetic basis between OSA and BMI. Notably, two of the three novel pleiotropic loci (rs11782826 and rs7701723) were co-localized for both traits. SNP rs12951387 is located within ERI1, which encodes an evolutionary conserved 3`-to-5` exoribonuclease that plays a crucial role in various RNA metabolic pathways, such as the processing of 5.8S rRNA and the degradation of histone mRNAs.Citation47–49 The ERI1 gene might affect OSA and BMI through effects on growth and development, as well as cardiac functioning and disease.Citation50–52 A homozygous nonsense variant in ERI1 has been linked with developmental delay and distal limb abnormalities.Citation50 Choucair found that the homozygous microdeletion of ERI1 was correlated with the presence of intellectual disability, limb abnormalities, and cardiac malformation.Citation51 Chai et al discovered that SNPs in ERI1 were both associated with blood pressure and spontaneous coronary artery dissection.Citation52 SNP rs7701723 is located within COMMD10, which encodes a protein (COMMD10) belonging to the copper metabolism MURR1 domain (COMMD) protein family.Citation53 COMMD10 has been reported to be important in immune cells function.Citation54–56 The presence of COMMD10 plays a critical role in Kupffer cell survivalCitation54 and phagolysosomal biogenesis and maturation,Citation55 as well as regulates the differentiation of monocytes in liver.Citation54 Yang discovered that COMMD10 exerts a suppressive effect on cell proliferation and facilitates apoptosis through the inhibition of NF-κB signaling in hepatocellular carcinoma. Inflammation has been found to promote the development of OSA,Citation57,Citation58 and also lead to obesity and obesity-related metabolic diseases.Citation59,Citation60
Tissue specific enrichment analysis revealed that central nervous system (CNS)-related tissues might play a pivotal role in the pathogenesis of both OSA and BMI, which was consistent with existing studies. Multiple neural mechanisms, including a lowered respiratory arousal threshold,Citation61,Citation62 heightened loop gain,Citation63,Citation64 and impaired sympathetic neural activity,Citation65,Citation66 have been linked to the pathogenesis of OSA. Variability in the structure and function of the frontal cortex across individuals influences variations in appetite and food preferences, thereby contributing to the diverse risk of obesity.Citation67 Inflammation and gliosis in the hypothalamic could impact the regulation of neuroendocrine circuits and contribute to the onset and persistence of obesity.Citation68,Citation69 And further research is warranted to investigate the shared neuropathogenesis underlying OSA and BMI. It is noteworthy that adipose tissue did not show significant enrichment in OSA or BMI. The constraints inherent in the GTEx eQTL reference data could potentially explain this outcome. The sample size for adipose tissue is around 500 samples, which may not adequately capture the complexity and variability inherent to this tissue. Additionally, the eQTL data for adipose tissue may lack specific gene expression information, further contributing to the non-significant findings. Larger-scale eQTL datasets in the future might provide new insights into tissue enrichment for shared SNPs between BMI and OSA.
Through SMR analysis across various tissues, a total of 602 expression-tissue pairs were identified, excluding the cervical C-1 region of the brain and spinal cord. Among these, 134 pairs were found within the 12 CNS-related brain tissues identified through the MAGMA analysis. Within this subset of 134 pairs, six genes (TRAF3, RMC1, NPC1, PMS2P11, POC5, SOX7) were overlapped with the colocalizing pleiotropic SNP-associated genes. These genes are implicated in diverse biological processes. TRAF3 has been reported as a regulator of neuroinflammation.Citation70–72 RMC1 is a subunit of the CCZ1-MON1 RAB7A guanine exchange factor (GEF), and is essential for the proper functioning of endosomal/autophagic flux.Citation73 The NCP1 protein mediates intracellular cholesterol trafficking, and defects in NCP1 result in a neurodegenerative disorder known as Niemann-Pick type C disease.Citation74 The POC5 protein, a crucial centriolar protein involved in both cell cycle progression and centriole elongation, has been identified as a potential causative gene for adolescent idiopathic scoliosis.Citation75 SOX7 has been recognized as a member of the SOX (SRY-related HMG-box) family of transcription factors, mainly involving in tumorigenesis and development,Citation76,Citation77 as well as muscle satellite cell development.Citation78 The PMS2P11 gene is a pseudogene with unknown functions. Further investigation is necessary to determine the influence of these genes’ expression in brain tissues on the occurrence and development of OSA and BMI.
Notably, in tissues associated with OSA and BMI—including adipose, heart, and lung tissues, which were not highlighted in MAGMA analysis—numerous expression-tissue pairs exhibited concurrent significance for both conditions. Among these genes, examples like SULT1A1,Citation79 LIN7C,Citation80 SH2B1,Citation81 and C1QTNF4Citation82 have established associations with obesity, yet their roles in OSA remain underexplored. The genes identified within these tissues may unveil potential shared pathophysiological mechanisms between OSA and BMI, meriting further detailed research.
It is necessary to acknowledge several study limitations. First, the GWAS summary statistics for both OSA and BMI in this study were derived from individuals of European ancestry, limiting the generalizability of our results to populations of non-European ancestry. Second, OSA prevalence in women is significantly lower than in men.Citation83 However, sex-specific analysis was precluded due to the unavailability of data. Third, the potential pleiotropic SNPs, genes and tissues identified in our study were based on computer algorithms, which should be interpreted with caution. Therefore, more animal and clinical studies are needed to investigate the potential mechanisms underlying OSA and BMI.
Conclusion
In summary, our study has uncovered an inherent genetic link underlying OSA and BMI, as evidenced by genetic correlation, causal relationship, and pleiotropic SNPs-associated gene and tissues. The results of our study enhance comprehension regarding the shared genetic basis between OSA and BMI. Future investigation is necessary to authenticate our discoveries and explore innovative pharmacological interventions targeting on the central nervous system for managing OSA and obesity.
Abbreviations
OSA, obstructive sleep apnea; BMI, body mass index; GWAS, genome-wide association study; GTEx, Genotype-Tissue Expression database; LDSC, linkage disequilibrium score regression; HDL, high-definition likelihood; LD, linkage disequilibrium; MAF, minor allele frequency; ρ-HESS, rho-heritability estimation from summary statistics; MR, Mendelian randomization; SNP, single nucleotide polymorphism; IVW, inverse variance weighted; MR-PRESSO, MR pleiotropy residual sum and outlier analysis; MTAG, Multi-Trait Analysis of GWAS; FDR, false discovery rate; CPASSOC, Cross Phenotype Association; VEP, Ensembl Variant Effect Predictor; MAGMA, Multi-marker Analysis of GenoMic Annotation; SMR, Summary-data-based Mendelian Randomization; eQTL, expression quantitative trait loci; HEIDI, heterogeneity in dependent instruments.
Author Contributions
All authors made a significant contribution to the work reported, whether that is in the conception, study design, execution, acquisition of data, analysis and interpretation, or in all these areas; took part in drafting, revising or critically reviewing the article; gave final approval of the version to be published; have agreed on the journal to which the article has been submitted; and agree to be accountable for all aspects of the work.
Disclosure
The authors report no conflicts of interest in this work.
Acknowledgments
Peng Zhou, Ling Li, and Zehua Lin are co-first authors for this study. The authors express their gratitude to the UK Biobank study and the FinnGen consortium for their efforts in making the GWAS data utilized in this research openly accessible.
Data Sharing Statement
The GWAS summary statistics for OSA and BMI are publicly available from https://r9.finngen.fi/, and https://gwas.mrcieu.ac.uk/, respectively.
Additional information
Funding
References
- Veasey SC, Rosen IM. Obstructive sleep apnea in adults. N Engl J Med. 2019;380(15):1442–1449. doi:10.1056/NEJMcp1816152
- Carneiro-Barrera A, Amaro-Gahete FJ, Guillén-Riquelme A, et al. Effect of an interdisciplinary weight loss and lifestyle intervention on obstructive sleep apnea severity. JAMA Network Open. 2022;5(4):e228212. doi:10.1001/jamanetworkopen.2022.8212
- GBD 2015 Obesity Collaborators. Health effects of overweight and obesity in 195 countries over 25 years. N Engl J Med. 2017;377(1):13–27. doi:10.1056/NEJMoa1614362
- Shah N, Roux F. The relationship of obesity and obstructive sleep apnea. Clinics Chest Med. 2009;30(3):455–465. doi:10.1016/j.ccm.2009.05.012
- Schwartz AR, Patil SP, Laffan AM, Polotsky V, Schneider H, Smith PL. Obesity and obstructive sleep apnea: pathogenic mechanisms and therapeutic approaches. Proc Am Thorac Soc. 2008;5(2):185–192. doi:10.1513/pats.200708-137MG
- Gami AS, Caples SM, Somers VK. Obesity and obstructive sleep apnea. Endocrinol Metab Clinics North Am. 2003;32(4):869–894. doi:10.1016/s0889-8529(03)00069-0
- Kuvat N, Tanriverdi H, Armutcu F. The relationship between obstructive sleep apnea syndrome and obesity: a new perspective on the pathogenesis in terms of organ crosstalk. Clin Respir J. 2020;14(7):595–604. doi:10.1111/crj.13175
- Börjeson M. The aetiology of obesity in children. A study of 101 twin pairs. Acta Paediatrica Scand. 1976;65(3):279–287. doi:10.1111/j.1651-2227.1976.tb04887.x
- Stunkard AJ, Harris JR, Pedersen NL, McClearn GE. The body-mass index of twins who have been reared apart. N Engl J Med. 1990;322(21):1483–1487. doi:10.1056/NEJM199005243222102
- Strausz S, Ruotsalainen S, Ollila HM, et al. Genetic analysis of obstructive sleep apnoea discovers a strong association with cardiometabolic health. Eur Respir J. 2021;57(5):2003091. doi:10.1183/13993003.03091-2020
- Wang H, Cade BE, Sofer T, et al. Admixture mapping identifies novel loci for obstructive sleep apnea in Hispanic/Latino Americans. Hum Mol Genet. 2019;28(4):675–687. doi:10.1093/hmg/ddy387
- Patel SR, Larkin EK, Redline S. Shared genetic basis for obstructive sleep apnea and adiposity measures. Int J Obes Lond. 2008;32(5):795–800. doi:10.1038/sj.ijo.0803803
- Bonsignore MR, McNicholas WT, Montserrat JM, Eckel J. Adipose tissue in obesity and obstructive sleep apnoea. Eur Respir J. 2012;39(3):746–767. doi:10.1183/09031936.00047010
- Htoo AK, Greenberg H, Tongia S, et al. Activation of nuclear factor κB in obstructive sleep apnea: a pathway leading to systemic inflammation. Sleep Breath. 2006;10(1):43–50. doi:10.1007/s11325-005-0046-6
- Rasche K, Keller T, Hader C, Leidag M, Prinz C. Impact of obstructive sleep apnoea on type 2 diabetes and vice versa. Eur Endocrinol. 2010;9(2):107. doi:10.17925/EE.2013.09.02.107
- Doumit J, Prasad B. Sleep apnea in type 2 diabetes. Diabetes Spectr. 2016;29(1):14–19. doi:10.2337/diaspect.29.1.14
- Cai Y, Juszczak HM, Cope EK, Goldberg AN. The microbiome in obstructive sleep apnea. Sleep. 2021;44(8):zsab061. doi:10.1093/sleep/zsab061
- Kurki MI, Karjalainen J, Palta P, et al. FinnGen provides genetic insights from a well-phenotyped isolated population. Nature. 2023;613(7944):508–518. doi:10.1038/s41586-022-05473-8
- Bulik-Sullivan BK, Loh PR, Finucane HK, et al. LD Score regression distinguishes confounding from polygenicity in genome-wide association studies. Nat Genet. 2015;47(3):291–295. doi:10.1038/ng.3211
- Ning Z, Pawitan Y, Shen X. High-definition likelihood inference of genetic correlations across human complex traits. Nat Genet. 2020;52(8):859–864. doi:10.1038/s41588-020-0653-y
- Shi H, Mancuso N, Spendlove S, Pasaniuc B. Local genetic correlation gives insights into the shared genetic architecture of complex traits. Am J Hum Genet. 2017;101(5):737–751. doi:10.1016/j.ajhg.2017.09.022
- Hemani G, Zheng J, Elsworth B, et al. The MR-Base platform supports systematic causal inference across the human phenome. Elife. 2018;7:e34408. doi:10.7554/eLife.34408
- Myers TA, Chanock SJ, Machiela MJ. LDlinkR: an R package for rapidly calculating linkage disequilibrium statistics in diverse populations. Front Genet. 2020;11. doi:10.3389/fgene.2020.00157
- Bowden J, Davey Smith G, Burgess S. Mendelian randomization with invalid instruments: effect estimation and bias detection through Egger regression. Int J Epidemiol. 2015;44(2):512–525. doi:10.1093/ije/dyv080
- Bowden J, Davey Smith G, Haycock PC, Burgess S. Consistent estimation in Mendelian randomization with some invalid instruments using a weighted median estimator. Gene Epidemiol. 2016;40(4):304–314. doi:10.1002/gepi.21965
- Burgess S, Butterworth A, Thompson SG. Mendelian randomization analysis with multiple genetic variants using summarized data. Gene Epidemiol. 2013;37(7):658–665. doi:10.1002/gepi.21758
- Turley P, Walters RK, Maghzian O, et al. Multi-trait analysis of genome-wide association summary statistics using MTAG. Nat Genet. 2018;50(2):229–237. doi:10.1038/s41588-017-0009-4
- Zhu X, Feng T, Tayo BO, et al. Meta-analysis of correlated traits via summary statistics from GWASs with an application in hypertension. Am J Hum Genet. 2015;96(1):21–36. doi:10.1016/j.ajhg.2014.11.011
- Giambartolomei C, Vukcevic D, Schadt EE, et al. Bayesian test for colocalisation between pairs of genetic association studies using summary statistics. PLoS Genet. 2014;10(5):e1004383. doi:10.1371/journal.pgen.1004383
- McLaren W, Gil L, Hunt SE, et al. The ensembl variant effect predictor. Genome Biol. 2016;17(1):122. doi:10.1186/s13059-016-0974-4
- de Leeuw CA, Mooij JM, Heskes T, Posthuma D. MAGMA: generalized gene-set analysis of GWAS data. PLoS Comput Biol. 2015;11(4):e1004219. doi:10.1371/journal.pcbi.1004219
- Zhu Z, Zhang F, Hu H, et al. Integration of summary data from GWAS and eQTL studies predicts complex trait gene targets. Nat Genet. 2016;48(5):481–487. doi:10.1038/ng.3538
- Tung YCL, Yeo GSH, O’Rahilly S, Coll AP. Obesity and FTO: changing focus at a complex locus. Cell Metab. 2014;20(5):710–718. doi:10.1016/j.cmet.2014.09.010
- Cao C, Wu B, Wu Y, et al. Functional polymorphisms in the promoter region of MMP-2 and MMP-9 and susceptibility to obstructive sleep apnea. Sci Rep. 2015;5(1):8966. doi:10.1038/srep08966
- Miksztowicz V, Fernandez Machulsky N, Lucero D, Fassio E, Schreier L, Berg G. Adiponectin predicts MMP-2 activity independently of obesity. Eur J Clin Invest. 2014;44(10):951–957. doi:10.1111/eci.12328
- Zhou Y, Hambly BD, McLachlan CS. FTO associations with obesity and telomere length. J Biomed Sci. 2017;24(1):65. doi:10.1186/s12929-017-0372-6
- Schneeberger M. Irx3, a new leader on obesity genetics. EBioMedicine. 2018;39:19–20. doi:10.1016/j.ebiom.2018.12.005
- Jowett JBM, Curran JE, Johnson MP, et al. Genetic variation at the FTO locus influences RBL2 gene expression. Diabetes. 2009;59(3):726–732. doi:10.2337/db09-1277
- Murray S, Tulloch A, Gold MS, Avena NM. Hormonal and neural mechanisms of food reward, eating behaviour and obesity. Nat Rev Endocrinol. 2014;10(9):540–552. doi:10.1038/nrendo.2014.91
- Pirzgalska RM, Seixas E, Seidman JS, et al. Sympathetic neuron–associated macrophages contribute to obesity by importing and metabolizing norepinephrine. Nat Med. 2017;23(11):1309–1318. doi:10.1038/nm.4422
- Romero-Corral A, Caples SM, Lopez-Jimenez F, Somers VK. Interactions between obesity and obstructive sleep apnea. Chest. 2010;137(3):711–719. doi:10.1378/chest.09-0360
- Wong SJ, Luitje ME, Karelsky S. Patterns of obstruction on DISE in adults with obstructive sleep apnea change with BMI. Laryngoscope. 2021;131(1):224–229. doi:10.1002/lary.28777
- Edwards BA, Bristow C, O’Driscoll DM, et al. Assessing the impact of diet, exercise and the combination of the two as a treatment for OSA: a systematic review and meta-analysis. Respirology. 2019;24(8):740–751. doi:10.1111/resp.13580
- Meszaros M, Tarnoki AD, Tarnoki DL, et al. Obstructive sleep apnea and hypertriglyceridaemia share common genetic background: results of a twin study. J Sleep Res. 2020;29(4):e12979. doi:10.1111/jsr.12979
- Tang H, Zhou Q, Zheng F, Wu T, Tang YD, Jiang J. The causal effects of lipid profiles on sleep apnea. Front Nutr. 2022;9:910690. doi:10.3389/fnut.2022.910690
- Vekic J, Zeljkovic A, Stefanovic A, Jelic-Ivanovic Z, Spasojevic-Kalimanovska V. Obesity and dyslipidemia. Metabolism. 2019;92:71–81. doi:10.1016/j.metabol.2018.11.005
- Thomas MF, Abdul-Wajid S, Panduro M, et al. Eri1 regulates microRNA homeostasis and mouse lymphocyte development and antiviral function. Blood. 2012;120(1):130–142. doi:10.1182/blood-2011-11-394072
- Ansel KM, Pastor WA, Rath N, et al. Mouse Eri1 interacts with the ribosome and catalyzes 5.8S rRNA processing. Nat Struct Mol Biol. 2008;15(5):523–530. doi:10.1038/nsmb.1417
- Hoefig KP, Rath N, Heinz GA, et al. Eri1 degrades the stem-loop of oligouridylated histone mRNAs to induce replication-dependent decay. Nat Struct Mol Biol. 2013;20(1):73–81. doi:10.1038/nsmb.2450
- Hoxha V, Aliu E. ERI1: a case report of an autosomal recessive syndrome associated with developmental delay and distal limb abnormalities. Am J Med Genetics Pt A. 2023;191(1):64–69. doi:10.1002/ajmg.a.62987
- Choucair N, Rajab M, Mégarbané A, Chouery E. Homozygous microdeletion of the ERI1 and MFHAS1 genes in a patient with intellectual disability, limb abnormalities, and cardiac malformation. Am J Med Genetics Pt A. 2017;173(7):1955–1960. doi:10.1002/ajmg.a.38271
- Chai T, Tian M, Yang X, Qiu Z, Lin X, Chen L. Association of circulating cathepsin b levels with blood pressure and aortic dilation. Front Cardiovasc Med. 2022;9. doi:10.3389/fcvm.2022.762468
- Riera-Romo M. COMMD1: a multifunctional regulatory protein. J Cell Biochem. 2018;119(1):34–51. doi:10.1002/jcb.26151
- Cohen K, Mouhadeb O, Ben Shlomo S, et al. COMMD10 is critical for Kupffer cell survival and controls Ly6Chi monocyte differentiation and inflammation in the injured liver. Cell Rep. 2021;37(7):110026. doi:10.1016/j.celrep.2021.110026
- Ben Shlomo S, Mouhadeb O, Cohen K, Varol C, Gluck N. COMMD10-guided phagolysosomal maturation promotes clearance of staphylococcus aureus in macrophages. iScience. 2019;14:147–163. doi:10.1016/j.isci.2019.03.024
- Yang M, Wu X, Li L, et al. COMMD10 inhibits tumor progression and induces apoptosis by blocking NF-κB signal and values up BCLC staging in predicting overall survival in hepatocellular carcinoma. Clin Translat Med. 2021;11(5). doi:10.1002/ctm2.403
- Gaines J, Vgontzas AN, Fernandez-Mendoza J, et al. Increased inflammation from childhood to adolescence predicts sleep apnea in boys: a preliminary study. Brain Behav Immun. 2017;64:259–265. doi:10.1016/j.bbi.2017.04.011
- Gaines J, Vgontzas AN, Fernandez-Mendoza J, et al. Inflammation mediates the association between visceral adiposity and obstructive sleep apnea in adolescents. Am J Physiol Endocrinol Metab. 2016;311(5):E851–E858. doi:10.1152/ajpendo.00249.2016
- Lumeng CN, Saltiel AR. Inflammatory links between obesity and metabolic disease. J Clin Invest. 2011;121(6):2111–2117. doi:10.1172/JCI57132
- Donath MY, Shoelson SE. Type 2 diabetes as an inflammatory disease. Nat Rev Immunol. 2011;11(2):98–107. doi:10.1038/nri2925
- Altree TJ, Chung F, Chan MTV, Eckert DJ. Vulnerability to postoperative complications in obstructive sleep apnea: importance of phenotypes. Anesth Analg. 2021;132(5):1328–1337. doi:10.1213/ANE.0000000000005390
- Younes M. Role of arousals in the pathogenesis of obstructive sleep apnea. Am J Respir Crit Care Med. 2004;169(5):623–633. doi:10.1164/rccm.200307-1023OC
- Deacon-Diaz N, Malhotra A. Inherent vs. induced loop gain abnormalities in obstructive sleep apnea. Front Neurol. 2018;9:896. doi:10.3389/fneur.2018.00896
- Panza GS, Alex RM, Yokhana SS, Lee Pioszak DS, Badr MS, Mateika JH. Increased oxidative stress, loop gain and the arousal threshold are clinical predictors of increased apnea severity following exposure to intermittent hypoxia. NSS. 2019;11:265–279. doi:10.2147/NSS.S228100
- Campana L, Eckert DJ, Patel SR, Malhotra A. Pathophysiology & genetics of obstructive sleep apnoea. Indian J Med Res. 2010;131:176–187.
- Azagra-Calero E, Espinar-Escalona E, Barrera-Mora JM, Llamas-Carreras JM, Solano-Reina E. Obstructive sleep apnea syndrome (OSAS). Review of the literature. Med Oral. 2012;17(6):e925–e929. doi:10.4317/medoral.17706
- Lowe CJ, Reichelt AC, Hall PA. The Prefrontal Cortex and Obesity: a Health Neuroscience Perspective. Trend Cognit Sci. 2019;23(4):349–361. doi:10.1016/j.tics.2019.01.005
- Sewaybricker LE, Huang A, Chandrasekaran S, Melhorn SJ, Schur EA. The Significance of Hypothalamic Inflammation and Gliosis for the Pathogenesis of Obesity in Humans. Endocr Rev. 2023;44(2):281–296. doi:10.1210/endrev/bnac023
- Sonnefeld L, Rohmann N, Geisler C, Laudes M. Is human obesity an inflammatory disease of the hypothalamus? Eur J Endocrinol. 2023;188(3):R37–R45. doi:10.1093/ejendo/lvad030
- Zhou Y, Tao T, Liu G, et al. TRAF3 mediates neuronal apoptosis in early brain injury following subarachnoid hemorrhage via targeting TAK1-dependent MAPKs and NF-κB pathways. Cell Death Dis. 2021;12(1):10. doi:10.1038/s41419-020-03278-z
- Li P, Zhao G, Ding Y, et al. Rh-IFN-α attenuates neuroinflammation and improves neurological function by inhibiting NF-κB through JAK1-STAT1/TRAF3 pathway in an experimental GMH rat model. Brain Behav Immun. 2019;79:174–185. doi:10.1016/j.bbi.2019.01.028
- Gong J, Li ZZ, Guo S, et al. Neuron-specific tumor necrosis factor receptor–associated factor 3 is a central regulator of neuronal death in acute ischemic stroke. Hypertension. 2015;66(3):604–616. doi:10.1161/HYPERTENSIONAHA.115.05430
- Vaites LP, Paulo JA, Huttlin EL, Harper JW. Systematic analysis of human cells lacking ATG8 proteins uncovers roles for GABARAPs and the CCZ1/MON1 Regulator C18orf8/RMC1 in Macroautophagic and Selective Autophagic Flux. Mol Cell Biol. 2018;38(1):e00392–17. doi:10.1128/MCB.00392-17
- Yang CC. Six novel NPC1 mutations in Chinese patients with Niemann-Pick disease type C. J Neurol Neurosurg. 2005;76(4):592–595. doi:10.1136/jnnp.2004.046045
- Patten SA, Margaritte-Jeannin P, Bernard JC, et al. Functional variants of POC5 identified in patients with idiopathic scoliosis. J Clin Invest. 2015;125(3):1124–1128. doi:10.1172/JCI77262
- Kim IK, Kim K, Lee E, et al. Sox7 promotes high-grade glioma by increasing VEGFR2-mediated vascular abnormality. J Exp Med. 2018;215(3):963–983. doi:10.1084/jem.20170123
- Hu W, Han Y, Yang W, et al. Novel role of sex-determining region Y-box 7 (SOX7) in tumor biology and cardiovascular developmental biology. Semi Cancer Biol. 2020;67(Pt 1):49–56. doi:10.1016/j.semcancer.2019.08.032
- Rajgara RF, Lala-Tabbert N, Marchildon F, et al. SOX7 is required for muscle satellite cell development and maintenance. Stem Cell Rep. 2017;9(4):1139–1151. doi:10.1016/j.stemcr.2017.08.014
- Tang J, Xu H, Xin Z, et al. Identifying BMI-associated genes via a genome-wide multi-omics integrative approach using summary data. Human Molecular Genetics. 2024;33(8):733–738. doi:10.1093/hmg/ddad212
- Mcy N, Tam CHT, So WY, et al. Implication of Genetic Variants Near NEGR1, SEC16B, TMEM18, ETV5/DGKG, GNPDA2, LIN7C/BDNF, MTCH2, BCDIN3D/FAIM2, SH2B1, FTO, MC4R, and KCTD15 with Obesity and Type 2 Diabetes in 7705 Chinese. J Clin Endocrinol Metab. 2010;95(5):2418–2425. doi:10.1210/jc.2009-2077
- Volckmar AL, Bolze F, Jarick I, et al. Mutation screen in the GWAS derived obesity gene SH2B1including functional analyses of detected variants. BMC Med Genomics. 2012;5(1):65. doi:10.1186/1755-8794-5-65
- Voisin S, Almén MS, Zheleznyakova GY, et al. Many obesity-associated SNPs strongly associate with DNA methylation changes at proximal promoters and enhancers. Genome Med. 2015;7(1):103. doi:10.1186/s13073-015-0225-4
- Banno K, Kryger MH. Sleep apnea: clinical investigations in humans. Sleep Med. 2007;8(4):400–426. doi:10.1016/j.sleep.2007.03.003