
Abstract
Background
Obstructive sleep apnea (OSA) patients commonly experience high rates of depression. This study aims to examine the oral microbiota characteristics of OSA and those with comorbid major depressive disorder (OSA+MDD) patients.
Methods
Participants were enrolled from Aug 2022 to Apr 2023. Polysomnography, psychiatrist interviews, and scales were used to diagnose OSA and MDD. Oral samples were collected from participants by rubbing swabs on buccal mucosa, palate, and gums. Oral microbiota was analyzed via whole-genome metagenomics and bioinformatic analysis followed sequencing. Venous blood was drawn to detect plasma inflammatory factor levels.
Results
The study enrolled 33 OSA patients, 28 OSA+MDD patients, and 28 healthy controls. Significant differences were found in 8 phyla, 229 genera, and 700 species of oral microbiota among the three groups. Prevotellaceae abundance in the OSA and OSA+MDD groups was significantly lower than that in healthy controls. Linear discriminant analysis effect size (LEfSe) analysis showed that Streptococcaceae and Actinobacteria were the characteristic oral microbiota of the OSA and OSA+MDD groups, respectively. KEGG analysis indicates 30 pathways were changed in the OSA and OSA+MDD groups compared with healthy controls, and 23 pathways were changed in the OSA group compared with the OSA+MDD group. Levels of IL-6 in the OSA+MDD group were significantly higher than in the healthy group, correlating positively with the abundance of Schaalia, Campylobacter, Fusobacterium, Alloprevotella, and Candidatus Nanosynbacter in the oral, as well as with Hamilton Anxiety Rating Scale and Hamilton Depression Rating Scale scores.
Conclusion
Significant differences in oral microbiota populations and gene function were observed among the three groups. OSA patients were characterized by a decreased abundance of Prevotellaceae and an increased abundance of Streptococcaceae. OSA+MDD patients had an increased abundance of Actinobacteria. IL-6 might regulate the relationship between depression and the oral microbiota in OSA+MDD patients.
Introduction
Obstructive sleep apnea (OSA) is caused by recurrent partial or complete collapse of the upper airway during sleep, resulting in airflow obstruction, repeated hypoxia, sleep fragmentation, and snoring. Long-term untreated OSA is associated with many chronic diseases.Citation1–3 The prevalence of OSA is high; studies have found that 9–38% of adults have OSA, and the prevalence rate for men is 14%, compared with 5% for women.Citation4
For OSA patients, air flow in the airway is significantly reduced due to changes in airway pressure, which change the moisture and oxygen content of the upper airway.Citation5 In addition, OSA patients often breathe with their mouths open during sleep, leading to oral dryness, which weakens the self-cleaning ability of the oral mucosa and leads to an increase in bacterial colonization.Citation6 These factors may lead to changes in the oral environments of OSA patients, resulting in changes in the oral microbiota. Previous studies have found that the oral microbiota of OSA patients is different from that of patients without OSA.Citation5,Citation7–9 W Yang et al found that middle-aged men with OSA showed less oropharyngeal species diversity and altered abundance.Citation5 The OSA patients have higher relative abundances of Porphyromonas and Aggregatibacter in oral compared with individuals without OSA reported by Chih-Yuan Ko et al.Citation7 In another study analyzed of oral microbiota in OSA patients with whole-genome metagenomic, the results showed that at the species level, the relative abundances of Prevotella, Alloprevotella, Bacteroides, Veillonella_tobetsuensis, Candidatus saccharimonas, and Leptotrichia in the groups with severe OSA were significantly lower than those in the healthy controls.Citation9
In addition to oral diseases, the oral microbiota is also associated with neurological diseases, such as Alzheimer’s disease (AD),Citation10 multiple sclerosis (MD),Citation11 and Parkinson’s disease (PD).Citation12 Previous studies have suggested that oral microbiota may affect central nervous system function in the following ways: a) bacterial translocation; b) damage to the blood vessels in the brain by promoting platelet aggregation; c) promotion of inflammation and immune responses; d) affecting the function of the neuroendocrine system; and 5) affecting the gut microbiota system.Citation13 The prevalence of depression is significantly higher in OSA patients than in the general population, with a meta-analysis showing that the prevalence of OSA with depression is 35%.Citation14 Hence, it is postulated that there exists a potential association between alterations in the oral microbiota and the manifestation of depressive symptoms in individuals with OSA. This study aimed to examine the oral microbiome of people who have OSA and OSA comorbid with major depressive disorder (MDD) compared to healthy controls using whole-genome metagenomics and observed the oral microbiome characteristics of those patients and explore the possible mechanism of comorbid depression in OSA.
Materials and Methods
Study Design and Participants
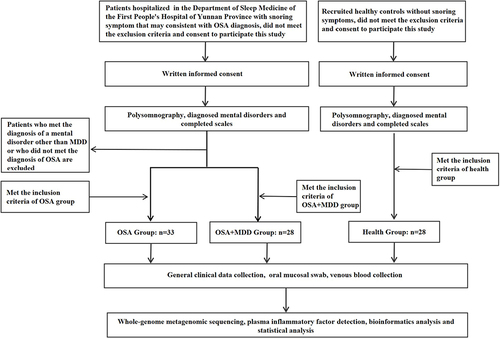
OSA and OSA comorbid with MDD patients were recruited among the patients hospitalized in the Sleep Medicine Center of Yunnan First People’s Hospital between August 2022 and April 2023. Researcher Jing Ye, a psychiatrist, was in charge of diagnosing and assessing MDD of the participants. schematically illustrates the grouping of subjects and the experimental process. The inclusion criteria of the OSA group were as follows: a) 18–60 years old, volunteered to participate in this study; b) conformed to the diagnosis of OSA in International Classification of Sleep Disorders–Third Edition (ICSD-3), and had not received treatment previously (including PAP, snore guard, surgical treatment, etc).; c) did not conform to the diagnosis of MDD and other psychiatric disorders in the Diagnostic and Statistical Manual of Mental Disorders–Fifth Edition (DSM-V). The inclusion criteria of the OSA comorbid with MDD patients (OSA+MDD group) were as follows: a) 18–60 years old, volunteered to participate in this study; b) met the diagnosis of OSA in ICSD-3, and had not received treatment previously (including PAP, snore guard, surgical treatment, etc).; c) met the diagnosis for MDD in DSM-V and a total Hamilton Depression Rating Scale (HAMD) score greater than 17 but did not meet the diagnostic criteria of other psychiatric disorders; and d) did not receive systematic antidepressant therapy. The inclusion criteria of the health group were as follows: a)18–60 years old, volunteered to participate in this study; b)did not meet the diagnosis of OSA or other sleep-related respiratory disorders in ICSD-3; c)did not conform to the diagnosis of MDD and other psychiatric disorders in the DSM-V. Exclusion criteria of this study were: a) age < 18 or > 60 years old; b) pregnancy; c) serious physical diseases, including inflammatory diseases and autoimmune diseases; d) oral disease (ie, periodontal disease, stomatitis, etc)., craniofacial dysplasia; e) use of probiotics, antibiotics, or nonsteroidal anti-inflammatory drugs in the past month. This study was approved by the Medical Ethics Committee of the First People’s Hospital of Yunnan Province (KHLL2022-KY040).
Figure 1 Procedure flowchart. The inclusion criteria of the OSA group were as follows: a) 18–60 years old, volunteered to participate in this study; b) conformed to the diagnosis of OSA in International Classification of Sleep Disorders–Third Edition (ICSD-3), and had not received treatment previously (including PAP, snore guard, surgical treatment, etc.); c) did not conform to the diagnosis of MDD and other psychiatric disorders in the Diagnostic and Statistical Manual of Mental Disorders–Fifth Edition (DSM-V). The inclusion criteria of the OSA comorbid with MDD patients (OSA+MDD group) were as follows: a) 18–60 years old, volunteered to participate in this study; b) met the diagnosis of OSA in ICSD-3, and had not received treatment previously (including PAP, snore guard, surgical treatment, etc.); c) met the diagnosis for MDD in DSM-V and a total Hamilton Depression Rating Scale (HAMD) score greater than 17 but did not meet the diagnostic criteria of other psychiatric disorders; and d) did not receive systematic antidepressant therapy. The inclusion criteria of the health group were as follows: 18–60 years old, volunteered to participate in this study; did not meet the diagnosis of OSA or other sleep-related respiratory disorders in ICSD-3; did not conform to the diagnosis of MDD and other psychiatric disorders in the DSM-V. Exclusion criteria of this study were: a) age < 18 or > 60 years old; b) pregnancy; c) serious physical diseases, including inflammatory diseases and autoimmune diseases; d) oral disease (ie, periodontal disease, stomatitis, etc.), craniofacial dysplasia; e) use of probiotics, antibiotics, or nonsteroidal anti-inflammatory drugs in the past month.
Diagnosis of OSA
Polysomnography (PSG), type 2 unattended sleep monitoring (Mukie Polysomnography PSM-A, Hangzhou Neurotrace Sci-Tech Co., Ltd, China), was used to demonstrate subjects’ sleep characteristics and collect data from participants on electroencephalography (EEG), electrooculography (EOG), electrocardiography (ECG), nasal-oral airflow, chest and abdominal wall movements, oxygen saturation, and body position from 22:00 to 7:00 the following day. Patients in the OSA and OSA+MDD groups slept in the ward, and those in the health group slept at home after wearing the machine. PSG records were manually analyzed by sleep technicians, according to the American Academy of Sleep Medicine criteria. Apnea was defined as a sustained cessation of airflow lasting more than 10s, while hypopnea was defined as a 30% or greater drop in inflow lasting 10s or more, accompanied by ≥ 3% oxygen desaturation. The subjects were diagnosed by a professional sleep medicine physician according to the diagnostic criteria of adult OSA in the ICSD-3.
Diagnosis of MDD
The diagnosis of MDD was based on the DSM-V. The diagnosis and scale assessment (HAMA, HAMD and Epworth) were performed by a psychiatrist.
Biospecimen Collection
All samples were collected within 1h of waking up on the morning after the sleep monitoring. Participants were asked to refrain from eating for 8h and used approximately 50mL of water to gargle. Five sterile swabs were used to brush the patient’s buccal mucosa, palate, and gums, and each swab was rotated clockwise 5 times applying constant pressure at each location for sample collection. After sampling, the swab head was placed in a sterile tube and stored in a −80°C refrigerator. Three milliliters of venous blood was collected using an EDTA tube. The tube was gently reversed to ensure that the anticoagulant was fully mixed and centrifuged immediately (3000rpm for 10min). The plasma was retained and divided into labeled EP tubes and then stored in a −80°C refrigerator.
Whole-Genome Metagenomic Analysis
DNA Extraction and DNA Library Construction
The oral samples of subjects were commissioned for metagenomic sequencing by the Beijing Genomics Institute. The DNA of oral samples was extracted by buffer bead-binding solution, protease K, and RNase. DNA quality check (concentration, integrity, purity) met: DNA concentration≥12.5µg/µL, electrophoretic gel pattern main peak>20kb, and no protein, RNA, or ion salt polluted samples were used for subsequent metagenomic library construction. The DNA was broken with an ultrasonic crusher (Covaris, Woburn, MA, USA), and DNA fragments of 200–400bp were enriched. After terminal repair, base A was added to the 3’ end of the cDNA, and the connector was added. The samples were amplified by PCR, and the amplified products were purified by magnetic beads. The purified PCR products were denatured, and the single-strand DNA was cyclized. After digesting uncyclized single-stranded DNA, the resulting single-stranded DNA ring product was the final DNA library.
Metagenomic Sequencing
Metagenomic sequencing (PE150, DNBSEQ T7) was performed after inspection to ascertain the quality of the library. SOAPnukeCitation15 (V.1.5.0; Parameter:-l20-q0.5-n 0.001-d-Q2-50-adaMis 0.3) was used to filter the original data obtained by sequencing for quality control, and Bowtie2Citation16 (V.2.2.5) software was used to filter the sequences that may have come from the host to obtain high-quality clean data for subsequent bioinformatics analysis. The clean data ratio ranged from 78.87 to 97.81, and the data volume ranged from 9.62G to 10.08G. The contents of Q20, Q30, and GC were 96.72–98.70%, 90.58–96.93% and 40.55–44.59%, respectively.
Bioinformatics Analysis
The resulting quality-filtered reads were assembled de novo using MegahitCitation17 (V.1.2.9; parameter: k-min=93, k-max=133) to generate the metagenome for each sample and remove assembly sequences less than 200bp. The analysis showed that the N50 statistical distribution of contigs ranged from 564–5649bp. MetaGeneMark (V.3.38)Citation18 and CD-HIT (V.4.8.10)Citation19 were used for gene prediction and gene redundancy removal. The number of CDSs in the nonredundant gene (gene catalog) constructed after redundancy removal ranged from 1691–201,731. Salmon software (V.1.6.0)Citation20 was used to quantify and standardize the nonredundant gene set to obtain the abundance values of each gene. The species of nonredundant gene sets of each sample were annotated by Kraken2 softwareCitation21 based on the NCBI NT (Nt 202011) database (https://www.ncbi.nlm.nih.gov/nucleotide/), and the species horizontal abundance of each sample was evaluated by BrackenCitation22 based on the Bayesian algorithm and Kraken classification results. The species function of the nonredundant gene set in each sample was annotated by KEGG using the BLASTP function of Diamond software. The visualization of the data was based on the Dr. Tom platform of the Beijing Genomics Institute.
Plasma Inflammatory Factor Detection
Plasma inflammatory factor levels, including those of C-reactive protein (CRP) (Elabscience E-EL-H0043c), interleukin-6 (IL-6) (Elabscience E-EL-H6156), interleukin-8 (IL-8) (Elabscience E-EL-6008), lipopolysaccharide binding protein (LBP) (Elabscience E-EL-H6108), and tumor necrosis factor-α (TNF-α) (Elabscience E-EL-H0109c), were determined by ELISA using a kit produced by Elabscience (China). ELISA procedures were performed according to the manufacturer’s recommendations.
Statistical Analysis
Statistical analysis of the clinical characteristics of the subjects was based on SPSS (V.26; IBM, Armonk, NY, USA). In short, the chi-square test was used for qualitative data. For quantitative data, T tests, one-way ANOVA, or nonparametric tests were used. P < 0.05 indicates a significant difference. Pearson correlation analysis was used to explore the correlation between clinical indicators, inflammatory factors, and oral microbiota.
Results
Participant Characteristics
We included 89 subjects in this study, 33 OSA patients (OSA group), 28 OSA comorbid with MDD patients (OSA+MDD group), and 28 healthy controls (HC group) (). All subjects signed informed consent documents. We compared the general clinical characteristics of the three groups, and there were no significant differences in age, sex, or smoking status among them (). Body mass index (BMI) and apnea hypopnea index (AHI) in the OSA and OSA+MDD groups were significantly higher than those in the HC group; average blood oxygen saturation in the OSA group was lower than that in the HC group; and HAMD and HAMA scores in the OSA+MDD group were significantly higher than those in the other two groups. There were no significant differences in AHI, mean blood oxygen saturation, or the saturation impair time below 90% (SIT90) between the OSA and OSA+MDD groups, indicating no significant differences in the disease severity of OSA between these two groups.
Table 1 Participant Characteristics
Oral Microbiota Composition and Diversity
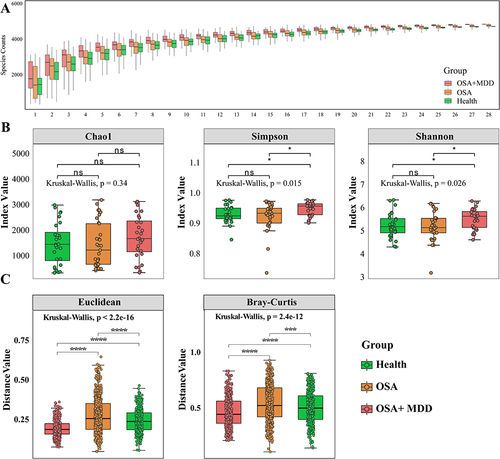
To explore the oral microbiota profiles and differences among the three groups, we performed shotgun metagenomic sequencing on 89 oral samples using the MGISEQ 2000 platform. To determine whether the sample size was sufficient to assess the colony richness of each group, dilution analysis was performed on the sequencing results of each group in this study. The results showed that the number of species in the OSA and OSA+MDD groups was higher than that in the HC group, especially in the OSA+MDD group, and the increase in the number of species in each group tended to plateau after the 25th sample (). This indicates that the sample size of this study was sufficient and reasonable. The diversity and evenness of the oral microbiota in each group were assessed by α-diversity analysis. As shown in , the Chao1 index was not significantly different among the three groups. The Simpson index and Shannon index of the OSA+MDD group were significantly higher than those of the OSA and HC groups, and there was no significant difference between the OSA and HC groups. This showed that the oral microbiota richness, evenness, and diversity of the OSA+MDD group were greater than the other two groups. In addition, β-diversity analysis based on Euclidean and Bray Curtis algorithms evaluated the overall dispersion of oral microbiota between and within the three groups. The results showed that the distance values between the three groups were significantly different, and the oral mucosal samples of the OSA group showed higher distance values than the other groups (). These results indicate that the oral microbiota of the HC, OSA, and OSA+MDD groups significantly differed, and the oral microbiota samples of the OSA group were relatively dispersed within the group.
Figure 2 Oral microbial composition and diversity. (A) Species accumulation curves were used to evaluate the reasonableness of the sample size in this study. The horizontal coordinate represents the number of samples, and the vertical coordinate represents the number of species. (B) For α-diversity analysis, the differences in Chao1, Shannon and Simpson indexes in the HC, OSA and OSA+MDD groups. (C) Euclidean and Bray‒Curtis distance algorithms for β-diversity were used to characterize the dispersion degree of samples between and within groups. *p<0.05, ***p<0.001, ****p<0.0001.
Identification of the Markers of Oral Microbiota
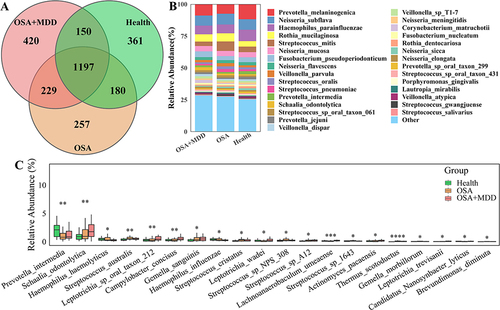
In this study, we tried to identify the differentially abundant oral microbiota to distinguish the patients in the HC, OSA, and OSA+MDD groups and find the characteristic oral microbiota that could represent the three groups. As shown in , 1888, 1863, and 1996 microbial species were identified in oral samples from subjects in the HC, OSA, and OSA+MDD groups, respectively, and 1197 species were shared among them (). Notably, the microbiota composition of patients in the HC, OSA, and OSA+MDD groups was similar, mainly including Prevotella, Neisseria, Haemophilus, Rothia, and Streptococcus. At the species level, Melaninogenica, Subflava, Parainfluenzae, Mucilaginosa, and Mitis were the most abundant species (). The Kruskal–Wallis test showed that there were significant differences among the three groups in 8 phyla (Actinobacteria, Deinococcus-Thermus, Fusobacteria, Bacteroidetes, Candidatus_Saccharibacteria, Cossaviricota, Coprothermobacterot, and Gemmatimonadetes) and 229 genera of oral microbiota. At the species level, there were significant differences in the abundance of 700 microbiota among the three groups; among them, Prevotella intermedia, Schaalia odontolytica, Haemophilus hemolyticus, Streptococcus australis and Leptotrichia sp oral taxon 212 were the top five with the highest abundance (). The results of pairwise comparisons among the three groups are shown in Figure S1.
Figure 3 Comparative analysis of oral microbiota among the three groups. (A) Venn diagram showing the number of shared oral microbiota among the HC, OSA, and OSA+MDD groups. (B) The species abundance histogram shows the relative abundance distribution of the oral microbiota of the three groups. (C) The boxplot shows the differentially abundant oral microbiota of the top 20 differential relative abundances among the three groups at the species level. *p<0.05, **p<0.01, ***p<0.001,****p<0.0001.
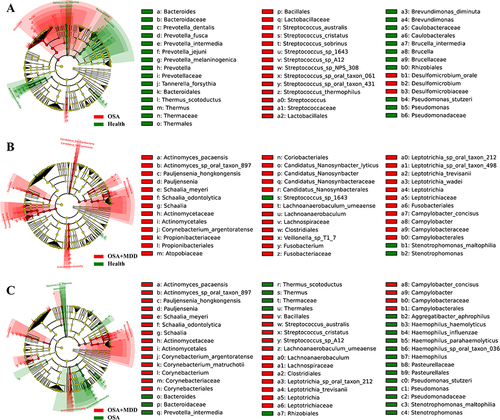
LEfSe analysis was performed to identify the characteristic oral microbiota of subjects in the HC, OSA, and OSA+MDD groups. When the OSA group was compared with the HC group, there were 43 characteristic differentially abundant microbiota between the two groups, including 26 differentially abundant microbiota representing the HC group and 27 differentially abundant microbiota representing the OSA group. Prevotellaceae and Streptococcaceae were the characteristic oral microbiota of the HC group and OSA group, respectively (). Similarly, there were a total of 39 characteristic differentially abundant microbiota between the HC group and the OSA+MDD group, and Gammaproteobacteria and Actinobacteria were the characteristic oral microbiota of the HC and OSA+MDD groups, respectively (). In addition, there were a total of 51 characteristic differentially abundant microbiota in the OSA group compared with the OSA+MDD group, and Streptococcus_sp_1643 and Actinobacteria were the characteristic oral microbiota of the OSA and OSA+MDD groups, respectively ().
Figure 4 Identification of oral characteristic microbiota in the HC, OSA, and OSA+MDD groups. The LEfSe ring branching diagram shows the differentially abundant microbiota of the HC and OSA groups (A), HC and OSA+MDD groups (B), and OSA and OSA+MDD groups (C). The circles radiating from the inside out represent taxonomic levels from phylum to species. Each small circle at a different classification level represents a classification at that level, and the size of the small circle diameter is proportional to the relative abundance size. Color principle: Species with no significant differences are uniformly colored yellow; red nodes represent the microbial groups that play an important role in the red group; and green nodes represent the microbial groups that play an important role in the green group.
Metagenomic Functional Distribution
In this study, we also annotated the functional pathways of the oral microbiota in the three groups. Based on KEGG analysis, the oral microbiota functions of the HC, OSA, and OSA+MDD groups involved 5499, 5503, and 5529 pathways, respectively. Among them, 5463 pathways were common to the three groups (). At KEGG level 1, the microbiota functional pathways were mainly involved in metabolism, genetic information processing, environmental information processing, cellular processes, human diseases, and organismal systems (). After further subdivision, the microbiota functions of the three groups were similar, mainly involving biosynthesis of secondary metabolites, ABC transporters, quorum sensing, oxidative phosphorylation, and amino sugar and nucleotide sugar metabolism (). Furthermore, STAMP software was used for pair-to-pair comparison of functional pathway differences between the three groups, and the results are shown in and Table S1.
Figure 5 Identification of the microbiota functional pathways in the HC, OSA, and OSA+MDD groups. (A) The Venn diagram shows the number of identified microbiota functional pathways and shared microbiota functional pathways of the HC, OSA, and OSA+MDD groups. The functional pathway abundance histogram shows the relative abundance distribution of microbiota functional pathways at KEGG level 1 (B) and level 3 (C) in the three groups.
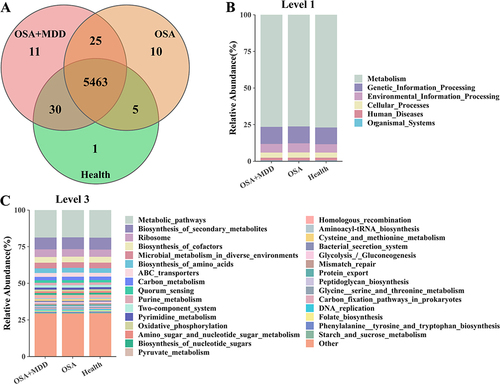
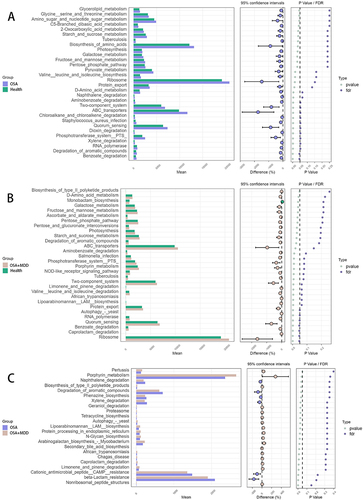
Figure 6 The differentially expressed functional pathways by pair-to-pair comparison between HC (Health), OSA and OSA+MDD groups based on STAMP software. The expanded bar chart shows the differences in functional pathways between groups. (A) The differences in functional pathways between the OSA and HC groups. (B) The differences in functional pathways between the OSA+MDD and HC groups. (C) The differences in functional pathways between the OSA+MDD and OSA groups.
Differences in Inflammatory Factors Among the Three Groups
To explore the inflammation levels among the three groups, levels of plasma inflammatory factors were compared among the three groups. The results showed that CRP, IL-6, and LBP levels in the OSA+MDD group were significantly higher than those in the HC group, and CRP and LBP levels in the OSA group were significantly higher than those in the HC group. There was no significant difference in IL-8 or TNF-α expression among the three groups. This shows that both the OSA and OSA+MDD groups were in a low-grade inflammatory state (Figure S2).
Correlation Analysis Between Differentially Abundant Oral Microbiota, Inflammatory Factors and Clinical Features
To explore the correlation between differentially abundant oral microbiota and the clinical characteristics of subjects, we used Pearson correlation analysis to identify the correlation between clinical characteristics and the top 20 differentially abundant microbiota. The results showed that AHI was positively correlated with the abundance of Streptococcus cristatus, Gemella sanguinis, Thermous Scotodectus, and Brevundimonas diminuta and negatively correlated with the abundance of Prevotella intermedia and Candidatus Nanosynbacterlyticus. The HAMD score of the subjects was positively correlated with the abundance of Actinomyces pacaensis, Schaalia odontolytica, Lachnonaerobaculum umeaense, Leptotrichia_trevisanii, and Leptotrichia sp. oral_taxon_212 but negatively correlated with the abundance of Haemophilus_haemolyticus and Haemophilus_influenzae ().
Figure 7 Analysis of the correlation between clinical features and differentially abundant oral microbiota. Pearson correlation analysis was used to identify the correlation between clinical characteristics and the top 20 differentially abundant microbiota at the species level.
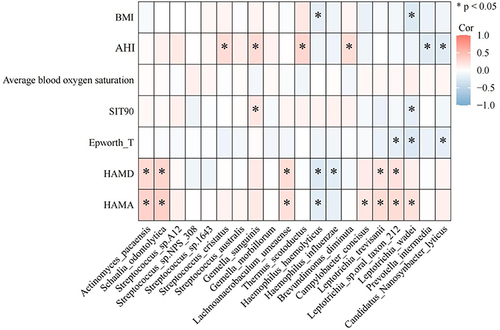
Inflammation has been confirmed to be involved in the pathogenesis of OSA and MDD.Citation23–25 Additionally, the findings of this study clearly demonstrated that LBP level was positively correlated with BMI, AHI, and SIT90 (p<0.05) and had a positive correlation with HAMA and HAMD scores. IL-6 level was positively correlated with HAMD and HAMA total scores (p<0.05) (Figure S3). As shown in Figure S3, the correlation heatmap shows the correlation between inflammation factors in plasma and differentially abundant microbiota in the oral cavity. IL-6 level was positively correlated with the abundance of Schaalia, Campylobacter, Fusobacterium, Alloprevotella, and Candidatus Nanosynbacter (p<0.05). LBP and CRP levels were negatively correlated with the abundance of Prevotella, Bacteroides and Candidatus Nanosynbacter (p<0.05) (Figure S4).
Discussion
The oral cavity is the entrance that connects the outside world with the respiratory and digestive tracts. It is a warm, humid, and nutrient-rich environment that provides a particularly favorable environment for the survival of microbiota. For OSA patients, there was a significant reduction in airflow due to changes in airway pressure, which could change the moisture, oxygen content, and temperature of the upper airway.Citation5 Many studies have shown that changes in the oxygen concentration in the environment could affect the growth of the microbiota.Citation26 In the oral ecosystem, microbe-microbe and microbe-host relationships coexist for a long time, and the imbalance between them may be related to various diseases.Citation27,Citation28
In this work, whole-genome metagenomic analysis and bioinformatics analysis were used to examine and contrast the variations in oral microbiota among the HC, OSA, and OSA+MDD groups. The results showed that the α-diversity of the microbiota in the OSA+MDD group was higher than that of the other two groups, and there was no significant difference between the other two groups. In other words, the OSA+MDD group had greater richness, evenness, and diversity of their oral microbiota. In studies on oral microbiota changes in depressed patients, most of the results suggest that the α-diversity in depressed patients is higher than that in controls,Citation29,Citation30 which is consistent with our results. Rhee et al found that the α-diversity of the gut microbiota of depressed patients was significantly increased when compared with that of the control group.Citation31 Autistic children were also found to have an increased diversity of gut microbiota compared to healthy controls.Citation32 While having a greater diversity of gut microbiota was thought to be beneficial for hosts in the traditional sense, it has not been established whether the effect of diversity on the central nervous system is beneficial or not.Citation33 More research is needed to explore the relationship between them. In this study, there was no significant difference in α-diversity between the OSA and HC groups. However, studies on the changes in oral microbial diversity in OSA patients have shown inconsistent results. Some studies indicated that OSA patients have lower α-diversity than that of healthy controls,Citation5,Citation9,Citation34 although some studies shown no difference,Citation7,Citation35–37 and another study found higher α-diversity in the OSA group.Citation38 We hypothesize that this was because the severity of OSA was different and the sample of patients was sampled at different sites of the oral cavity, leading to different results. The β-diversity reflects the similarity of microbiota among different samples in a group. In our study, the β-diversity of the OSA+MDD, HC, and OSA groups gradually increased, indicating that the composition of microbiota in the OSA group varied greatly among each patient, while the oral microbiota in the OSA+MDD group tended to be similar.
In our study, we found that Prevotella (including Prevotella melanogenes, Prevotella intermedia, etc.) abundance in the oral microbiota of the OSA and OSA+MDD groups decreased, while Streptococcus abundance increased, and the results of correlation analysis also suggested that Prevotella_intermedia abundance was significantly negatively correlated with AHI, and Streptococcus cristatus abundance was significantly positively correlated with AHI. Bacteroidetes was one of the main bacterial groups in the oral cavity of healthy people, and Prevotella was the largest genus of Bacteroidetes. Prevotella is a gram-negative bacterium that is strictly anaerobicCitation39 and could be an opportunistic pathogen in many oral infections.Citation40 This genus was associated with chronic periodontitis, pulp infection, and abscesses of periodontal origin.Citation41,Citation42 Colonization of Prevotella in the mouth depends on biofilm formation, but open mouth breathing in OSA patients changes the anaerobic environment and increases the oxygen content of the mouth, which is not conducive to the survival of Prevotella. Gao et al confirmed that the concentration of Prevotella in the saliva of OSA patients was significantly lower than that of healthy controls. However, for MDD patients, previous studies have found that the abundance of Prevotella in both the oral cavity and feces increased,Citation43–45 and the abundance of Prevotella in the oral cavity was positively correlated with depressive symptoms at the species level.Citation45 Therefore, we speculate that the variation in oral Prevotella abundance may be used as a characteristic microbiota to distinguish OSA, MDD, and OSA+MDD. The decrease in Prevotella abundance may be a predictor of OSA.
Streptococcus is a gram-positive, facultative anaerobic bacterium commonly found in various parts of the human body. It significantly influences the balance of oral microbiota and the development of oral and systemic diseases. Streptococcus regulates the expression of adherence factors and other virulence factors, allowing it to colonize oral mucosa or other parts of the body effectively, and these factors are also important for infecting the host.Citation46 In our study, LEfSe analysis results suggested that Streptococcaceae were the characteristic oral microbiota of the OSA group. Streptococcus was related to tonsil and adenoid hypertrophy, and previous metagenomics studies had also found that, compared with the control group, the abundance of Streptococcus in the oral mucosa of OSA patients was increased.Citation9 Higher abundance levels of Streptococcus were also found in the nasal passages of adult OSA patients.Citation47 With the increased abundance of Streptococcus in the oral cavity, its metabolites could directly or indirectly upregulate the level of inflammatory factors in oropharyngeal tissues, causing inflammatory distention of the soft palate, tonsils, and adenoids. This could lead to a narrowing airway, exacerbating the obstruction of the upper airway, and making patients more susceptible to obstruction events during sleep. Streptococcus depends on the glycolysis of carbohydrates for energy and is extremely acid-resistant. Long-term high carbohydrate intake may lead to weight gain, which is a risk factor for OSA. In addition, exposure to dietary carbohydrates can make the oral environment dysfunctional. In this environment where more organic acids are produced, such as lactic acid, which is a byproduct of fermentation, the abundance of Streptococcus and other acid-tolerant bacteria increased, and less acid-tolerant symbiotic bacteria decreased,Citation48 ultimately leading to the disruption of oral microbiota balance.
Previous studies have noted that compared with those of healthy people, the oral microbiota and gut microbiota of depressed patients are different. In the present study, Actinomycetes was the characteristic microbiota of the OSA+MDD group, and the abundances of Actinomyces pacaensis and Schaalia odontolytica were positively correlated with HAMD scores and HAMA scores. A study by Brianna N. et al found that patients with depressive symptoms had an increased abundance of Actinomycetes compared with patients without depressive symptoms.Citation49 Another study also found that the abundance of Actinomyces in the oral cavity was positively correlated with depressive symptoms.Citation45 These findings were consistent with our own. The abundance of Actinomycetes was positively correlated with cortisol levels.Citation45 Basal cortisol level is associated with depressive and anxiety symptoms, and previous studies have hypothesized that elevated salivary cortisol due to dysregulation of HPA axis activity may be responsible for the association between depressive and anxiety symptoms and oral bacterial abundance.Citation50 For OSA+MDD patients, the factors that affect the oral microbiota include not only cortisol but also changes in the oral environment, and the regulatory effect of cortisol on oral Actinomycetes still needs further research.
Oral microbiota and its metabolite entry into the systemic circulation may be one of the reasons for inducing and aggravating inflammation. Pathogenic oral bacteria can induce the production of proinflammatory factors. In this study, plasma IL-6 levels in the OSA+MDD group were significantly higher than those in the OSA and HC groups. IL-6 was positively correlated with the abundance of Schaalia, Campylobacter, Fusobacterium, Alloprevotella, and Phlolobacter (Candidatus Nanosynbacter). Previous studies have found that numerous inflammatory factors are increased in depressed patients, and these inflammatory factors, including IL-6, decrease after antidepressant treatment.Citation51–53 Elevated IL-6 levels have been identified as an independent predictor of depression.Citation54 In OSA patients, previous studies have also found that the plasma IL-6 concentration was higher than that of normal controls.Citation55 In a previous study on inflammatory factors in female OSA patients, the researchers assessed depression (using the depression score from the hospital anxiety and depression questionnaire HAD-D) and measured plasma inflammatory factors in 247 patients diagnosed with moderate to severe OSA and found that IL-6 was independently associated with the presence of depression and positively correlated with depression scores.Citation56 Our study also found that IL-6 has a positive correlation with AHI and BMI. The sympathetic nervous system and the adrenomedullary nervous system could stimulate the secretion of IL-6, which could lead to increased IL-6 under stress.Citation57 In addition, IL-6 can activate the HPA system,Citation58 which is associated with depression. Intermittent hypoxia during sleep and increasing sympathetic nerve activity may lead to increased IL-6 in OSA patients. Therefore, elevated IL-6 in OSA patients may be one of the mechanisms of depression. Therefore, we speculated that, regardless of whether OSA was combined with MDD, elevated plasma IL-6 and increased oral Actinomycetes may be predictors of depressive events. Oral microbiota imbalance affects the plasma IL-6 concentration, and IL-6 may be involved in regulating the relationship between depressive symptoms and oral microbiota in OSA+MDD patients.
To anticipate the roles of oral microbiota function, KEGG pathway studies were performed. Compared with the HC group, the synthesis of branched-chain amino acids (BCAAs), including valine, leucine, and isoleucine, were increased in the OSA group. This was consistent with previous findings in children with OSA.Citation59 The presence of OSA was significantly correlated with the concentration of BCAA. The increase in BCAA may directly or indirectly lead to mitochondrial dysfunction, and abdominal obesity, insulin resistance, and low-grade inflammation are associated with the increase in BCAA.Citation59 Mammalian target of rapamycin (mTOR) is a ubiquitous serine/threonine protein kinase that plays a crucial role in regulating cell growth, cell proliferation, cell survival, cell motility, protein synthesis, autophagy, and transcription.Citation60 According to Hay et al, BCAAs (especially leucine), insulin and growth factors are important input signals from the upstream pathway of mTOR that could activate mTOR.Citation60 Chronic activation of mTOR induced by BCAAs could lead to insulin resistance and early cell dysfunction.Citation61–63 It was related to the occurrence of OSA complications. Moreover, obesity, as one of the risk factors for OSA, could dull amino acid metabolism in adipose tissue, thus profoundly affecting the catabolism of BCAA in OSA patients.Citation64 In further analysis, we found increased expression of a BCAA-degrading pathway in the OSA+MDD group compared to the HC group. Previous studies on depression in adults and adolescents have found that reduced BCAA levels are associated with depression. In an animal study, researchers found that treatment with paroxetine, an antidepressant, increased the concentrations of the essential amino acids valine, leucine, and isoleucine by 50–70% in mice.Citation65 The mTOR signaling pathway in the prefrontal cortex was impaired in patients with major depression.Citation66 However, BCAA deficiency could lead to decreased mTOR activity, resulting in decreased energy metabolism and depressive symptoms.Citation67
In addition, autophagy was increased in the OSA+MDD group compared with the OSA and HC groups. Autophagy is a cellular homeostasis process and a stress response. Autophagy may be a response to chronic stress; studies have confirmed that the occurrence of autophagy is conducive to alleviating OSA or MDD processes.Citation68–70 Autophagy could act as an antidepressant by maintaining protein stability, especially by maintaining the integrity of synaptic membrane protein function.Citation71 Previous studies have also found that most antidepressants, including fluoxetine, sertraline, paroxetine, venlafaxine, mirtazapine, and electric convulsive therapy, can enhance autophagy.Citation71 However, excessive autophagy can lead to cell death, characterized by the formation of large autophagy vacuoles.Citation71 Increased autophagy affects synaptic function, inducing autophagy by inhibiting mTOR at the presynaptic terminal, rapidly altering the presynaptic structure, and reducing neurotransmission.Citation72 An autopsy study showed that the mTOR signaling pathway in the prefrontal cortex was impaired in patients with major depression.Citation73 Chronic stress in mice is often used to simulate depression, and enhanced autophagy can be seen in chronically stressed mice.Citation74,Citation75 In human studies, a study with a small sample size found increased expression of autophagy-related genes in the blood mononuclear cells of individuals with major depression compared to healthy controls.Citation73 OSA can induce autophagy through hypoxia, oxidative stress, endoplasmic reticulum stress, endothelial dysfunction, and miRNA.Citation76 Hypoxia is one of the reasons for mTOR inactivation. Therefore, we speculate that autophagy in OSA patients may increase due to hypoxia, but if it is excessively increased, it might cause synaptic dysfunction. Autophagy is a normal physiological function, and the increase in autophagy during stress is also an adaptive response of cells. A certain degree of autophagy is the basis for maintaining cell and organ function, and autophagy activation that is too low or too high may lead to impaired cell function. Therefore, we speculate that the process of hypoxia-induced autophagy may be affected by many factors, and excessive autophagy activation may cause synaptic damage, resulting in depressive symptoms. Further research is needed to confirm this idea.
Recently, several investigations have been conducted on the oral microbiota of individuals diagnosed with OSA and MDD. However, the findings of these studies are inconsistent. There were many factors involved, including disease assessment methods. In previous studies on the oral microbiota of patients with depression, most of them only used a scale to assess the depressive symptoms of patients and did not diagnose MDD. In addition, the oral cavity is a complex environment, and different results may occur depending on the sampling site. In addition, factors such as OSA severity, dietary habits and oral health may also affect the study results. In our study, there were differences in the number of participants with a history of alcohol use among the three groups, but none of them had alcohol use disorder. Alcohol use was associated with a heightened risk of OSA due to its effects on the upper airway and body mass index (BMI).Citation77 The results of meta-analysis found that alcohol consumption was associated with worsening severity of snoring, altered sleep architecture, AHI, as well as lowest oxygen saturation among patients susceptible to snoring and OSA.Citation78 The interrelationship between alcohol and depression was also complex. There was a U-shaped curve between the amount of alcohol and the risk of depression,Citation79 non-drinkers and people who engage in hazardous drinking had a higher depression risk.Citation80 Most research showed that alcohol can lead to adverse outcomes of depression.Citation81 Therefore, alcohol use as a risk factor for OSA and MDD may be the reason why in our study more participants in the OSA group and OSA+MDD group have a history of drinking. However, this remains a limitation of this study. Previous studies have shown that alcohol use might be one of the potential determinants in shaping the oral microbiota communities, and continuous alcohol consumption will alter the oral ecosystem including reducing saliva production, decreasing oral pH, and disrupting tooth enamel, resulting in cavities and periodontal inflammation.Citation82,Citation83 Due to the discrepancies in drinking habits and the diversity of alcoholic beverages across various regions, there was no consistent result on the impact of alcohol use on oral microbiota at present.Citation84,Citation85 More comprehensive data were needed to analyze the effects of alcohol on oral microbes in OSA and OSA+MDD patients. In addition, the effect of OSA on the oral microbiota may be a dynamic process, so the influence of the disease course should be considered in future studies. This work represents the initial investigation into the oral microbiota of individuals with comorbid OSA and MDD. The diagnostic criteria outlined in the DSM-V were used to identify individuals with MDD, while metagenomics techniques were utilized to analyze the oral samples.
Conclusion
In the present investigation we draw the following conclusions: a) notable disparities were observed in the oral microbiota and gene functions among the OSA, OSA+MDD, and HC groups; b) the variation in oral Prevotellaceae abundance may be used as a characteristic microorganism to distinguish OSA, MDD, and OSA+MDD; c) the decreased abundance of Prevotellaceae and increased abundance of Streptococcaceae in oral were the characteristics of OSA patients; d) Actinobacteria were characteristic of the OSA+MDD group, and increased Actinobacteria abundance was associated with depression. e) with or without OSA, elevated plasma IL-6 levels and increased oral abundance of Actinobacteria may be predictors of depressive events.; f) dysregulation of the oral microbiota could affect plasma IL-6 concentration and IL-6 may be involved in regulating the relationship between depressive symptoms and oral microbiota in OSA+MDD patients.
Abbreviations
AHI, apnea and hypopnea index; ArI, arousal index; BCAAs, branched-chain amino acids; BMI, body mass index; CRP, C-reactive protein; HAMA, Hamilton Anxiety Rating Scale; HAMD, Hamilton Depression Rating Scale; HC, healthy control; IL-6, interleukin-6; IL-8, interleukin-8; LBP, lipopolysaccharide binding protein; mTOR, mammalian target of rapamycin; MDD, major depressive disorder; NREM, non-rapid eye movement sleep; OSA, obstructive sleep apnea; OSA+MDD, obstructive sleep apnea comorbid with major depressive disorder; OCST, out-of-center sleep testing; REM, rapid eye movement; SIT90, saturation impair time below 90%; TNF-α, tumor necrosis factor-α; TST, total sleep time; WASO, waking after sleep onset.
Ethics Approval and Consent to Participate
The experimental protocol complied with the ethical guidelines of the Helsinki Declaration and was approved by the Medical Ethics Committee of the First People’s Hospital of Yunnan Province (KHLL2022-KY040). All subjects signed informed consent forms.
Disclosure
The authors declare that they have no conflicts of interest in this work.
Acknowledgments
We would like to thank all participants.
Additional information
Funding
References
- Grewal N, Gordon D, Bajaj S. et al. Impact of obstructive sleep apnea treatment on cardiovascular disease associated mortality and morbidity: a systematic review. Curr Prob Cardiology. 2024;49(1 Pt C)):102139. doi:10.1016/j.cpcardiol.2023.102139
- Abelleira R, Zamarrón C, Riveiro V, et al. Relationship between obstructive sleep apnea and type 2 diabetes mellitus. Med Clin-Barcelona. 2024;162(8):363–369. doi:10.1016/j.medcli.2023.11.014
- Qin Y, Sun C, Sun H, et al. Electroencephalographic slowdowns during sleep are associated with cognitive impairment in patients who have obstructive sleep apnea but no dementia. Sleep Breath. 2023;27(6):2315–2324. doi:10.1007/s11325-023-02843-y
- Kapur VK, Auckley DH, Chowdhuri S, et al. Clinical practice guideline for diagnostic testing for adult obstructive sleep apnea: an American Academy of sleep medicine clinical practice guideline. J Clin Sleep Med. 2017;13(3):479–504. doi:10.5664/jcsm.6506
- Yang W, Shao L, Heizhati M, et al. Oropharyngeal microbiome in obstructive sleep apnea: decreased diversity and abundance. J Clin Sleep Med. 2019;15(12):1777–1788. doi:10.5664/jcsm.8084
- Alexander AG. Habitual mouthbreathing and its effect on gingival health. Parodontologie. 1970;24(2):49–55.
- Ko CY, Hu AK, Chou D, et al. Analysis of oral microbiota in patients with obstructive sleep apnea-associated hypertension. Hypertens Res. 2019;42(11):1692–1700. doi:10.1038/s41440-019-0260-4
- Ko CY, Hu AK, Zhang L, Lu XL, Zeng YM. Alterations of oral microbiota in patients with obstructive sleep apnea-hypopnea syndrome treated with continuous positive airway pressure: a pilot study. Sleep Breath. 2022;26(2):811–814. doi:10.1007/s11325-021-02428-7
- Gao Y, Wang H, Hu Y, et al. Whole-genome metagenomic analysis of the oral microbiota in patients with obstructive sleep apnea. Sleep Breath. 2023;27(4):1383–1398. doi:10.1007/s11325-022-02732-w
- Dominy SS, Lynch C, Ermini F, et al. Porphyromonas gingivalis in Alzheimer’s disease brains: evidence for disease causation and treatment with small-molecule inhibitors. Sci Adv. 2019;5(1):eaau3333. doi:10.1126/sciadv.aau3333
- Farrokhi V, Nemati R, Nichols FC, et al. Bacterial lipodipeptide, Lipid 654, is a microbiome-associated biomarker for multiple sclerosis. Clin Transl Immunology. 2013;2(11):e8. doi:10.1038/cti.2013.11
- Pereira PAB, Aho VTE, Paulin L, Pekkonen E, Auvinen P, Scheperjans F. Oral and nasal microbiota in Parkinson’s disease. Parkinsonism Relat d. 2017;38(null):61–67. doi:10.1016/j.parkreldis.2017.02.026
- Paudel D, Uehara O, Giri S, et al. Effect of psychological stress on the oral-gut microbiota and the potential oral-gut-brain axis. Jpn Dent Sci Rev. 2022;58(null):365–375. doi:10.1016/j.jdsr.2022.11.003
- Garbarino S, Bardwell WA, Guglielmi O, Chiorri C, Bonanni E, Magnavita N. Association of anxiety and depression in obstructive sleep apnea patients: A systematic review and meta-analysis. Behav Sleep Med. 2020;18(1):35–57. doi:10.1080/15402002.2018.1545649
- Chen Y, Chen Y, Shi C, et al. SOAPnuke: a MapReduce acceleration-supported software for integrated quality control and preprocessing of high-throughput sequencing data. Gigascience. 2018;7(1):1–6. doi:10.1093/gigascience/gix120
- Langmead B, Salzberg SL. Fast gapped-read alignment with Bowtie 2. Nat Methods. 2012;9(4):357–359. doi:10.1038/nmeth.1923
- Li D, Liu CM, Luo R, Sadakane K, Lam TW. MEGAHIT: an ultra-fast single-node solution for large and complex metagenomics assembly via succinct de Bruijn graph. Bioinformatics. 2015;31(10):1674–1676. doi:10.1093/bioinformatics/btv033
- Zhu W, Lomsadze A, Borodovsky M. Ab initio gene identification in metagenomic sequences. Nucleic Acids Res. 2010;38(12):e132. doi:10.1093/nar/gkq275
- Fu L, Niu B, Zhu Z, Wu S, Li W. CD-HIT: accelerated for clustering the next-generation sequencing data. Bioinformatics. 2012;28(23):3150–3152. doi:10.1093/bioinformatics/bts565
- Patro R, Duggal G, Love MI, Irizarry RA, Kingsford C. Salmon provides fast and bias-aware quantification of transcript expression. Nat Methods. 2017;14(4):417–419. doi:10.1038/nmeth.4197
- Wood DE, Lu J, Langmead B. Improved metagenomic analysis with Kraken 2. Genome Biol. 2019;20(1):257. doi:10.1186/s13059-019-1891-0
- Lu J, Breitwieser FP, Thielen P, Salzberg SL. Bracken: estimating species abundance in metagenomics data. PeerJ Comput Sci. 2017;3:e104. doi:10.7717/peerj-cs.104
- Meliante PG, Zoccali F, Cascone F, et al. Molecular pathology, oxidative stress, and biomarkers in obstructive sleep apnea. Int J Mol Sci. 2023;24(6):null. doi:10.3390/ijms24065478
- Bhatt S, Nagappa AN, Patil CR. Role of oxidative stress in depression. Drug Discov Today. 2020;25(7):1270–1276. doi:10.1016/j.drudis.2020.05.001
- Slavich GM, Sacher J. Stress, sex hormones, inflammation, and major depressive disorder: extending social signal transduction theory of depression to account for sex differences in mood disorders. Psychopharmacology. 2019;236(10):3063–3079. doi:10.1007/s00213-019-05326-9
- Paul D, Kumbhare SV, Mhatre SS, et al. Exploration of microbial diversity and community structure of lonar lake: the only hypersaline meteorite crater lake within basalt rock. Front Microbiol. 2015;6(null):1553.
- Atarashi K, Suda W, Luo C, et al. Ectopic colonization of oral bacteria in the intestine drives TH1 cell induction and inflammation. Science. 2017;358(6361):359–365. doi:10.1126/science.aan4526
- Dickson I. Gut microbiota: oral bacteria: a cause of IBD? Nat Rev Gastroenterol Hepatol. 2018;15(1):4–5.
- Kohn JN, Kosciolek T, Marotz C, et al. Differing salivary microbiome diversity, community and diurnal rhythmicity in association with affective state and peripheral inflammation in adults. Brain Behav Immun. 2020;87(null):591–602. doi:10.1016/j.bbi.2020.02.004
- Al Bataineh MT, Künstner A, Dash NR, et al. Altered composition of the oral microbiota in depression among cigarette smokers: a pilot study. Front Psychiatry. 2022;13(null):90s2433. doi:10.3389/fpsyt.2022.902433
- Rhee SJ, Kim H, Lee Y, et al. Comparison of serum microbiome composition in bipolar and major depressive disorders. J Psychiatr Res. 2020;123(null):31–38.
- Finegold SM, Dowd SE, Gontcharova V, et al. Pyrosequencing study of fecal microflora of autistic and control children. Anaerobe. 2010;16(4):444–453. doi:10.1016/j.anaerobe.2010.06.008
- Jiang H, Ling Z, Zhang Y, et al. Altered fecal microbiota composition in patients with major depressive disorder. Brain Behav Immun. 2015;48(null):186–194. doi:10.1016/j.bbi.2015.03.016
- Chen Y, Chen X, Huang X, Duan Y, Gao H, Gao X. Analysis of salivary microbiome and its association with periodontitis in patients with obstructive sleep apnea. Front Cell Infect Microbiol. 2021;11(null):752475. doi:10.3389/fcimb.2021.752475
- Chen X, Chen Y, Feng M, et al. Altered salivary microbiota in patients with obstructive sleep apnea comorbid hypertension. Nat Sci Sleep. 2022;14(null):593–607. doi:10.2147/NSS.S347630
- Jia P, Zou J, Yin S, Chen F, Yi H, Zhang Q. Analysis of the salivary microbiome in obstructive sleep apnea syndrome patients. Can j Infect Dis Med. 2020;2020(null):6682020.
- Zhang X, Li X, Xu H, et al. Changes in the oral and nasal microbiota in pediatric obstructive sleep apnea. J Oral Microbiol. 2023;15(1):2182571. doi:10.1080/20002297.2023.2182571
- Xu H, Li X, Zheng X, et al. Pediatric obstructive sleep apnea is associated with changes in the oral microbiome and urinary metabolomics profile: a pilot study. J Clin Sleep Med. 2018;14(9):1559–1567. doi:10.5664/jcsm.7336
- Shah HN, Collins DM. Prevotella, a new genus to include bacteroides melaninogenicus and related species formerly classified in the genus bacteroides. Int j Syst Bacteriol. 1990;40(2):205–208. doi:10.1099/00207713-40-2-205
- Krom BP, Kidwai S, Ten Cate JM. Candida and other fungal species: forgotten players of healthy oral microbiota. J Dent Res. 2014;93(5):445–451. doi:10.1177/0022034514521814
- Xie Y, Chen J, He J, et al. Antimicrobial resistance and prevalence of resistance genes of obligate anaerobes isolated from periodontal abscesses. J Periodontol. 2014;85(2):327–334. doi:10.1902/jop.2013.130081
- Lafaurie GI, Contreras A, Barón A, et al. Demographic, clinical, and microbial aspects of chronic and aggressive periodontitis in Colombia: a multicenter study. J Periodontol. 2007;78(4):629–639. doi:10.1902/jop.2007.060187
- Chung YE, Chen HC, Chou HL, et al. Exploration of microbiota targets for major depressive disorder and mood related traits. J Psychiatr Res. 2019;111(null):74–82. doi:10.1016/j.jpsychires.2019.01.016
- Lai WT, Zhao J, Xu SX, et al. Shotgun metagenomics reveals both taxonomic and tryptophan pathway differences of gut microbiota in bipolar disorder with current major depressive episode patients. J Affect Disord. 2021;278(null):311–319. doi:10.1016/j.jad.2020.09.010
- Simpson CA, Adler C, du Plessis MR, et al. Oral microbiome composition, but not diversity, is associated with adolescent anxiety and depression symptoms. Physiol Behav. 2020;226(null):113126. doi:10.1016/j.physbeh.2020.113126
- Brouwer S, Barnett TC, Rivera-Hernandez T, Rohde M, Walker MJ. Streptococcus pyogenes adhesion and colonization. FEBS Lett. 2016;590(21):3739–3757. doi:10.1002/1873-3468.12254
- Wu BG, Sulaiman I, Wang J, et al. Severe obstructive sleep apnea is associated with alterations in the nasal microbiome and an increase in inflammation. Am j Resp Crit Care. 2019;199(1):99–109. doi:10.1164/rccm.201801-0119OC
- Abranches J, Zeng L, Kajfasz JK, et al. Biology of oral streptococci. Microbiol Spectr. 2018;6(5):null. doi:10.1128/microbiolspec.GPP3-0042-2018
- Richardson BN, Noh HI, Webster CI, et al. Oral microbiome, mental health, and sleep outcomes during the COVID-19 Pandemic: an observational study in Chinese and Korean American immigrants. Omics. 2023;27(4):180–190. doi:10.1089/omi.2022.0182
- Lamb AL, Hess DE, Edenborn S, Ubinger E, Carrillo AE, Appasamy PM. Elevated salivary IgA, decreased anxiety, and an altered oral microbiota are associated with active participation on an undergraduate athletic team. Physiol Behav. 2017;169(null):169–177. doi:10.1016/j.physbeh.2016.12.004
- Bakunina N, Pariante CM, Zunszain PA. Immune mechanisms linked to depression via oxidative stress and neuroprogression. Immunology. 2015;144(3):365–373. doi:10.1111/imm.12443
- Krishnadas R, Cavanagh J. Depression: an inflammatory illness? J Neurol Neurosur Ps. 2012;83(5):495–502. doi:10.1136/jnnp-2011-301779
- Hannestad J, DellaGioia N, Bloch M. The effect of antidepressant medication treatment on serum levels of inflammatory cytokines: a meta-analysis. Neuropsychopharmacol. 2011;36(12):2452–2459. doi:10.1038/npp.2011.132
- Valkanova V, Ebmeier KP, Allan CL. CRP. IL-6 and depression: a systematic review and meta-analysis of longitudinal studies. J Affect Disord. 2013;150(3):736–744. doi:10.1016/j.jad.2013.06.004
- Takayanagi H. Osteoclast differentiation and activation. Clin Calcium. 2007;17(4):484–492.
- Campos-Rodriguez F, Cordero-Guevara J, Asensio-Cruz MI, et al. Interleukin 6 as a marker of depression in women with sleep apnea. J Sleep Res. 2021;30(1):e13035. doi:10.1111/jsr.13035
- Papanicolaou DA, Wilder RL, Manolagas SC, Chrousos GP. The pathophysiologic roles of interleukin-6 in human disease. Ann Intern Med. 1998;128(2):127–137. doi:10.7326/0003-4819-128-2-199801150-00009
- Maes M, Scharpé S, Meltzer HY, et al. Relationships between interleukin-6 activity, acute phase proteins, and function of the hypothalamic-pituitary-adrenal axis in severe depression. Psychiat Res. 1993;49(1):11–27. doi:10.1016/0165-1781(93)90027-E
- Bogl LH, Kaye SM, Rämö JT, et al. Abdominal obesity and circulating metabolites: a twin study approach. Metabolism. 2016;65(3):111–121. doi:10.1016/j.metabol.2015.10.027
- Hay N, Sonenberg N. Upstream and downstream of mTOR. Gene dev. 2004;18(16):1926–1945. doi:10.1101/gad.1212704
- Melnik BC. Leucine signaling in the pathogenesis of type 2 diabetes and obesity. World J Diabetes. 2012;3(3):38–53. doi:10.4239/wjd.v3.i3.38
- Xu Q, Vu H, Liu L, Wang TC, Schaefer WH. Metabolic profiles show specific mitochondrial toxicities in vitro in myotube cells. J Biomol Nmr. 2011;49(3–4):207–219. doi:10.1007/s10858-011-9482-8
- Felig P, Marliss E, Cahill GF. Plasma amino acid levels and insulin secretion in obesity. New engl j med. 1969;281(15):811–816. doi:10.1056/NEJM196910092811503
- Wang TJ, Larson MG, Vasan RS, et al. Metabolite profiles and the risk of developing diabetes. Nat med. 2011;17(4):448–453. doi:10.1038/nm.2307
- Webhofer C, Gormanns P, Tolstikov V, et al. Metabolite profiling of antidepressant drug action reveals novel drug targets beyond monoamine elevation. Transl Psychiatry. 2011;1(null):e58. doi:10.1038/tp.2011.56
- Jernigan CS, Goswami DB, Austin MC, et al. The mTOR signaling pathway in the prefrontal cortex is compromised in major depressive disorder. Prog Neuropsyc Biol Psych. 2011;35(7):1774–1779. doi:10.1016/j.pnpbp.2011.05.010
- Baranyi A, Amouzadeh-Ghadikolai O, von Lewinski D, et al. Branched-chain amino acids as new biomarkers of major depression - a novel neurobiology of mood disorder. PLoS One. 2016;11(8):e0160542. doi:10.1371/journal.pone.0160542
- Ali T, Rahman SU, Hao Q, et al. Melatonin prevents neuroinflammation and relieves depression by attenuating autophagy impairment through FOXO3a regulation. J Pineal Res. 2020;69(2):e12667. doi:10.1111/jpi.12667
- Lyu D, Wang F, Zhang M, et al. Ketamine induces rapid antidepressant effects via the autophagy-NLRP3 inflammasome pathway. Psychopharmacology. 2022;239(10):3201–3212. doi:10.1007/s00213-022-06201-w
- Gong LJ, Wang XY, Gu WY, Wu X. Pinocembrin ameliorates intermittent hypoxia-induced neuroinflammation through BNIP3-dependent mitophagy in a murine model of sleep apnea. J Neuroinflammation. 2020;17(1):337. doi:10.1186/s12974-020-02014-w
- Gassen NC, Rein T. Is there a role of autophagy in depression and antidepressant action? Front Psychiatry. 2019;10(null):337. doi:10.3389/fpsyt.2019.00337
- Hernandez D, Torres CA, Setlik W, et al. Regulation of presynaptic neurotransmission by macroautophagy. Neuron. 2012;74(2):277–284. doi:10.1016/j.neuron.2012.02.020
- Alcocer-Gómez E, Casas-Barquero N, Núñez-Vasco J, Navarro-Pando JM, Bullón P. Psychological status in depressive patients correlates with metabolic gene expression. Cns Neurosci Ther. 2017;23(10):843–845. doi:10.1111/cns.12755
- Nestler EJ, Hyman SE. Animal models of neuropsychiatric disorders. Nat Neurosci. 2010;13(10):1161–1169. doi:10.1038/nn.2647
- Woo H, Hong CJ, Jung S, Choe S, Yu SW. Chronic restraint stress induces hippocampal memory deficits by impairing insulin signaling. Mol Brain. 2018;11(1):37. doi:10.1186/s13041-018-0381-8
- Ding H, Guo H, Cao J. The importance of autophagy regulation in obstructive sleep apnea. Sleep Breath. 2021;25(3):1211–1218. doi:10.1007/s11325-020-02261-4
- Ko J, Lim JH, Kim DB, et al. Association between alcohol use disorder and risk of obstructive sleep apnea. J Sleep Res. 2023;null(null):e14128.
- Burgos-Sanchez C, Jones NN, Avillion M, et al. Impact of alcohol consumption on snoring and sleep apnea: a systematic review and meta-analysis. Otolaryng Head Neck. 2020;163(6):1078–1086. doi:10.1177/0194599820931087
- Lina-Jolien P, Rocío GJ, Miquel R, et al. Moderate alcohol consumption and depression prevention: a critical review. Actas esp psiquiatri. 2022;50(3):126–133.
- Gémes K, Forsell Y, Janszky I, et al. Moderate alcohol consumption and depression - a longitudinal population-based study in Sweden. Acta Psychiat Scand. 2019;139(6):526–535. doi:10.1111/acps.13034
- Sivolap YP, Krupitsky EM, Mendelevich VD, et al. Dual diagnosis: depression and alcohol use disorder. Zh nevrol psikhiatr. 2021;121(7):135–140. doi:10.17116/jnevro2021121071135
- Lages EJ, Costa FO, Cortelli SC, et al. Alcohol consumption and periodontitis: quantification of periodontal pathogens and cytokines. J Periodontol. 2015;86(9):1058–1068. doi:10.1902/jop.2015.150087
- Enberg N, Alho H, Loimaranta V, Lenander-Lumikari M. Saliva flow rate, amylase activity, and protein and electrolyte concentrations in saliva after acute alcohol consumption. Oral Surg Oral Med o. 2001;92(3):292–298. doi:10.1067/moe.2001.116814
- Fan X, Peters BA, Jacobs EJ, et al. Drinking alcohol is associated with variation in the human oral microbiome in a large study of American adults. Microbiome. 2018;6(1):59. doi:10.1186/s40168-018-0448-x
- Liao Y, XT T, YJ J, et al. The Effects of alcohol drinking on oral microbiota in the Chinese population. Int J Environ Res Public Health. 2022;19(9):null. doi:10.3390/ijerph19095729