
Abstract
Introduction
Center of pressure (COP) is a sudden displacement at the time of a lateral ankle sprain (LAS). It has been suggested that the distribution of plantar pressure and the quantity of COP displacement are important for assessing the risk of LAS. Therefore, we evaluated the plantar pressure during a single-leg balance test with eyes closed (SLB-C) to identify the factors and characteristics of plantar pressure in people with repeated cases of LAS.
Methods
We recruited 22 collegiate athletes and divided them into an instability group (IG; n=11) and a control group (CG; n=11). We measured the distribution of plantar pressure and lower extremity muscle activity during a SLB-C along with static alignment and isometric ankle strength.
Results
The fibularis longus (FL) activity was significantly lower in the IG than in the CG. The lateral plantar pressure (LPP)/medial plantar pressure (MPP) ratio was also higher in the IG than in the CG. In addition, the LPP/MPP ratio was correlated with the tibialis anterior (TA)/FL ratio.
Conclusion
These results suggest that increased lateral plantar pressure is related to decreased FL activity and increased TA/FL ratio.
Introduction
Lateral ankle sprain (LAS) is a common injury in a collegiate athletic population, and according to a previous study by Gerber et al,Citation1 it accounts for ~21% of all injuries in the collegiate athletic population. In addition, at 7 years of follow-up, in 648 patients with LAS, >30% of patients still had some sequelae (e.g., pain, swelling, recurrent injury) and >70% of patients felt functionally impaired.Citation2 In addition, since repeated LAS is a risk factor for the early onset of posttraumatic ankle osteoarthritis, which impairs quality of life (QoL) in the future,Citation3 it is necessary to improve performance while screening clearly. From the abovementioned findings, as indicated in the 2016 consensus statement of the International Ankle Consortium,Citation4,Citation5 LAS has a harmful effect on not only current sports activities but also future QoL. Moreover, it has been reported that an increasing lateral plantar pressure (LPP) and a considerable lateral displacement of the center of pressure (COP) are hallmarks of LAS injury.Citation6 Thus, the increasing LPP and the lateral displacement of COP are harmful characteristics that can cause LAS,Citation6 and it is clear that muscle activity has a large influence on plantar pressure distribution.Citation7 However, further research on the relationship between LPP and muscle activity related to hypofunction (especially, the fibularis longus [FL]) is needed.Citation8–Citation10
It has been revealed that the FL contributes to ankle stability.Citation11 In particular, the FL contributes to frontal plane ankle stability during single-leg tasksCitation12 and is correlated with the amount of lateral–medial COP displacement.Citation13 From these studies, it can be considered that FL has an influence on the plantar pressure distribution. However, the influence of other muscles (tibialis anterior [TA] and gastrocnemius [GASTRO]), in terms of muscle activity interaction (e.g., agonist/antagonist activity ratio), on plantar pressure distribution is not clear. Since plantar pressure distribution is influenced by factors such as static alignment,Citation14 ankle strength,Citation15,Citation16 and postural controlCitation17,Citation18 we have to measure many factors comprehensively to elucidate the relationship between muscle activity and plantar pressure distribution.
In the context of this background, this study aimed to investigate the relationship between increased LPP, characteristic of LAS, and lower extremity muscle activities, using a single-leg balance task with eyes closed (SLB-C) and assessing the ankle strength and static alignment. We believe that it is important to identify the factors that are related to increasing LPP and beneficial for designing training to prevent increasing LPP.
Methods
Subjects and study design
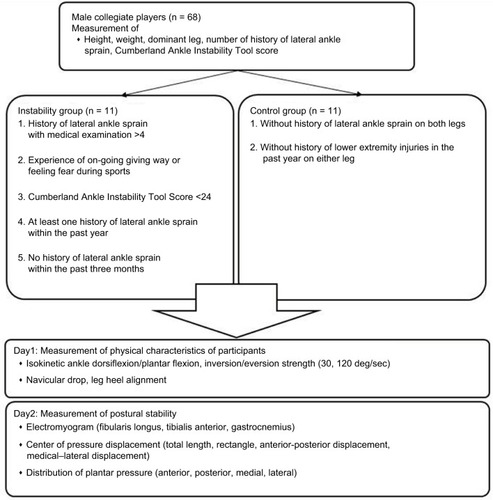
This study was conducted in a single-blind method as a retrospective cross-sectional study. A total of 68 collegiate athletes were screened for anthropometric data (height, weight, dominant leg, and history of LAS with medical examination) and Cumberland Ankle Instability Tool (CAIT) score using the CAIT questionnaire ().Citation19 In all, 11 athletes met the following inclusion criteria for the instability group (IG), based on a consensus statement and endorsement from the International Ankle Consortium:Citation20 1) more than four counts of LAS with medical examination; 2) ongoing giving way experiences or feeling fear during sports activity; 3) CAIT score <24; 4) at least one LAS within the past year; and 5) no history of LAS within the past 3 months. We required the IG of more than four counts of LAS with medical examination to ensure that the subjects had repeated LAS. A total of 11 participants were included in the control group (CG) based on the following criteria: 1) no history of LAS in either leg, and 2) no history of lower extremity injuries within 1 year. An LAS was defined as an ankle injury with an inversion mechanism requiring the player to miss at least one game or practice after a medical examination of the LAS by a physician. An ongoing giving way experience was defined as uncontrolled and unpredictable episodes of excessive inversion of the ankle at least two times in the 6 months prior to study enrollment.Citation20 Subjects were excluded if they had a history of fractures or surgery in the lower extremity or trunk. None of the subjects in either group reported a history of neurological or vestibular impairment. The target leg was selected at random in the CG. The dominant leg was determined by asking which leg the subject would use to kick a ball. The selection of subjects and the target leg was conducted by an author (S.M.). On the first day, we measured static alignment and ankle isokinetic strength. On another day, we measured COP displacement, distribution of plantar pressure, and muscle activity during the SLB-C task. The subjects were blinded during the measurement of variables.
Table 1 Physical characteristics of participants
SLB-C is the task of maintaining balance standing barefoot on one leg with eyes closed for 15 seconds.Citation21 We instructed subjects to put their hands on their waist and maintain a contralateral hip joint flexion at 90°. A trial was discarded if subjects did not keep their hands on their hips, if the balancing foot shifted, if the contralateral foot touched the ground, or if both legs were pushed together for balance.Citation22 After a practice trial, the SLB-C was repeated until two successful trials were completed. We set a rest period of 1 minute between SLB-C tasks.
We finished all the measurements within 2 weeks (). This study was carried out in accordance with the principles outlined in the Declaration of Helsinki of the World Medical Association and was approved by the ethics committee of Medical and Health Research Involving Human Subjects of Waseda University, and all the participants signed an informed consent form.
Figure 1 General procedure.
Measurement of isokinetic strength
We measured ankle isokinetic concentric dorsiflexion, plantar flexion, and inversion and eversion strength using a Biodex System III Dynamometer (Biodex Medical Systems; Shirley, NY, USA). These tests were conducted at speeds of 30°/second and 120°/second. The knee was positioned at 0°, and the ankle joint was positioned such that the subtalar joint became dorsi-/plantarflexion 0° during dorsi-/plantarflexion measurement. The trunk and femur were fixed to the seat and the ankle to the footplate with straps. Both arms were crossed in front of the chest during measurement. The rotational axis of the dynamometer was positioned on the lateral malleolus.Citation23 For the inversion test, the knee was flexed 60° and the ankle joint was positioned such that the subtalar joint became dorsi-/plantarflexion 0° during inversion/eversion measurement. The range of motion stop angle was set at full range of motion. Before testing, a warm-up session was performed to allow familiarization with the testing protocol. The warm-up session consisted of a submaximal five trials (~50%)Citation24 before each test. Five maximal repetitions were recorded for each of the test conditions. Consistent verbal encouragement for each maximal effort was given to the subject throughout the test. A 3-minute rest period was provided between efforts, and subjects were instructed that their best effort was required. The average torque value (normalized to body weight) for each condition was used in the data analysis to detect group differences.
Navicular drop
Navicular drop (ND) was calculated using an iron ruler in a seated position. Subjects sat on a chair and placed their foot on a scale (HA552; Tanita, Itabashi Ward, Tokyo, Japan). We regulated the height of the chair so that their thigh was parallel to the ground, and their ankle position was dorsi-/plantarflexion 0° to load for 10% of weight. We measured the distance between the navicular tuberosity and the ground in the sitting and standing positions and defined the difference as the ND. The measurement was performed two times, and the average value was used in the data analysis.
Leg heel alignment
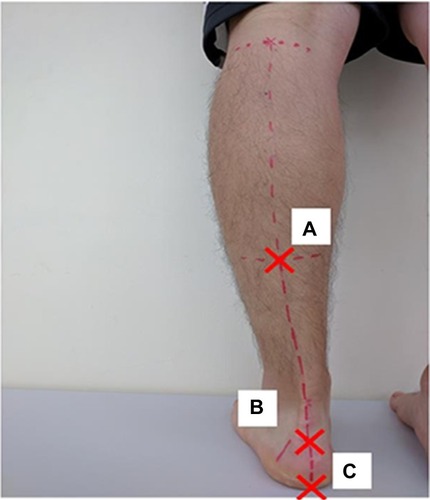
We marked three points on the subject’s leg and defined the angle created by segments A–B and B–C as leg heel alignment (LHA; ).Citation25 We marked point A in the lower one-third, central part of the leg, point B on the calcaneal tuberosity, and point C on the heel so that the segment B–C divided the heel in half. We took a picture of the lower limb from behind the subject using a digital camera (EXILIM EX-FX1; Casio, Shibuya Ward, Tokyo, Japan). LHA was determined from the picture using the 2D image analysis software (Dartfish; gsport, Bunkyo Ward, Tokyo, Japan).
Figure 2 The definition of leg heel alignment
Distribution of plantar pressure and COP displacement
We measured anterior plantar pressure (APP), posterior plantar pressure (PPP), medial plantar pressure (MPP), LPP, total length of COP anterior–posterior (A–P) displacement, total length of COP medial–lateral (M–L) displacement, total length of COP (LNG), and rectangle area (RA) during the balance task. We calculated the PPP/APP ratio and LPP/MPP ratio from the data. Plantar pressure distribution and COP displacement data were measured at 100 Hz using the plantar pressure sensor (F-scan II; Nitta, Osaka, Japan). Plantar pressure distribution was recorded per unit area (kg/cm2). We recorded plantar pressure distribution during a balance task for 15 seconds, and the results were normalized to body weight.Citation21 We defined line A as the connection between the second distal phalanx and the calcaneus and line B as the line crossing line A at a right angle. We determined the portion one-third anterior to line B as the APP area and the portion one-third posterior to line B as the PPP area. In addition, we determined the portion one-third inside of line A as the MPP area and one-third outside of line A as the LPP area (). Since this definition of plantar pressure area was used in the original method, we calculated an intraclass correlation coefficient (ICC) value before data collection (n = 8). All areas had a high reliability (ICC [1, 2]: APP = 0.985, PPP =0.878, LPP =0.997, MPP =0.992, LPP/MPP ratio =0.973, PPP/APP ratio =0.778; ). Thus, the average value of plantar pressure and COP displacement in two SLB-C tasks was used for analysis.
Figure 3 Distribution of plantar pressure.
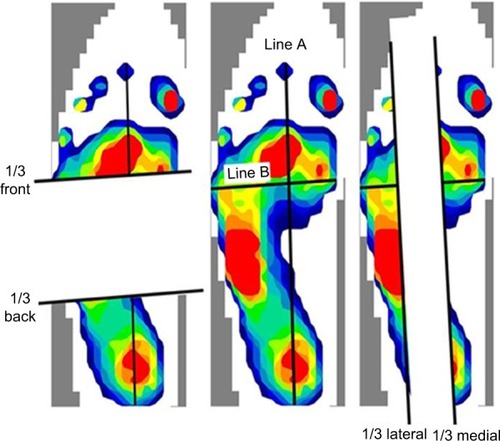
Table 2 Intra-class correlation coefficient value of plantar pressure
Electromyography
We measured the FL, TA, and GASTRO lateral muscle activity by means of surface electromyography (TeleMyo 2400T; Noraxon, Scottsdale, AZ, USA) at 1500 Hz during SLB-C. The preparation consisted of shaving the skin over the area of electrode placement, followed by cleaning the skin with alcohol swabs. Disposable Ag/AgCl circular electrodes were placed over each muscle. Electrode placement was consistent with a previous study.Citation26 Before recording the SLB-C trial, 5-second maximum voluntary isometric contractions (MVICs) against manual resistance were recorded to normalize the electromyography (EMG) amplitude during the SLB-C trials. We calculated root mean square (RMS) value from an interval of the middle 3 seconds and assumed the value as 100% RMS. We normalized the EMG signals during SLB-C to 100% RMS and the average value of RMS during 15 seconds of SLB-C. All muscle activities during SLB-C and MVICs, after full-wave rectification, were filtered by a band-pass filter with a cutoff frequency of 5–500 Hz using the TRAIS System (DKH, Itabashi Ward, Tokyo, Japan).
Statistical analysis
First, we performed the Kolmogorov–Smirnov test as the test of normality. We performed independent t-tests for the variables that had a normal distribution. We performed the Mann–Whitney U test for the variables that were not normally distributed. In addition, Spearman’s rank-order correlation analysis was used to evaluate the relationships among static alignment (LHA and ND), EMG, isokinetic strength, and all of the plantar pressure measures. The level of significance was set a priori at p < 0.05 using the statistical software program (Excel analysis; SSRI, Shinjuku Ward, Tokyo, Japan) for all analyses. We calculated the effect size, using Cohen’s d coefficient, and 95% confidence intervals (CIs) around Cohen’s d ().Citation27
Figure 4 Calculation of Cohen’s d and 95% CIs around Cohen’s d.
Abbreviations: CI, confidence interval; ES, effect size (Cohen’s d).
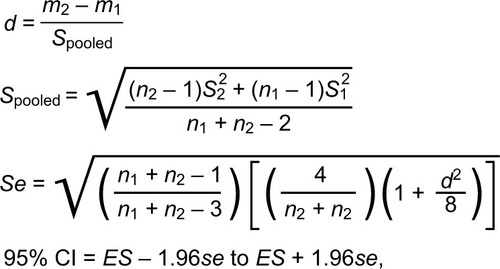
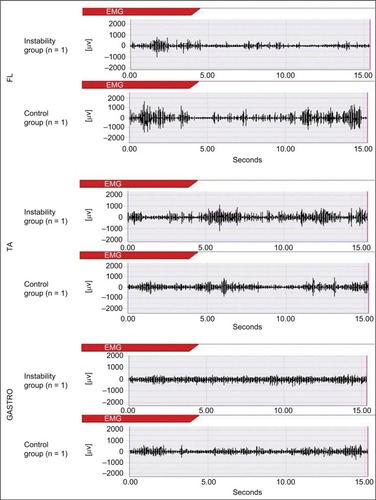
Figure 5 An example of the raw wave of muscle activities (n = 1).
Results
Kolmogorov–Smirnov testing revealed a non-normal distribution for FL activity, dosiflexion/plantarflexion strength ratio (30°/second), inversion strength (30/second), and eversion strength (30°/second).
Distribution of plantar pressure, muscle activity, and COP displacement
MPP during SLB-C was lower in the IG compared to the CG (p<0.05, Cohen’s d = −1.12 [95% CI, −1.10 to 3.38], 1 − b =0.70), and LPP/MPP ratio was higher in the IG compared to the CG (p<0.05, Cohen’s d =1.00 [95% CI, −1.19 to 3.29], 1 − b =0.61; ). FL activity was significantly lower in the IG than in the CG (p<0.05, Cohen’s d =0.99 [95% CI, −1.20 to 3.27], 1 − b =0.58), and TA/FL ratio was significantly higher in the IG than in the CG (p<0.05, Cohen’s d =1.44 [95% CI, −0.77 to 3.75], 1 − b =0.89; and ). In addition, FL activity was correlated with LPP and LPP/MPP ratio. The TA/FL ratio was correlated with MPP and the LPP/MPP ratio (). No significant difference was found in APP, PPP, LPP, or PPP/APP; COP A–P displacement; COP M–L displacement; LNG; or RA ( and and ).
Figure 6 An example of the raw data of the COP displacement (n = 1).
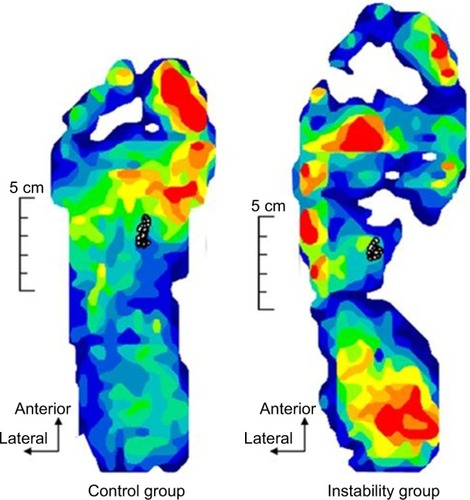
Table 3 Variables measured during the balance task
Table 4 Correlation coefficient value between muscle activities and plantar pressure
Table 5 Characteristics of strength and foot posture
Measurement of ankle isokinetic strength and static alignment
There were no significant differences in concentric isokinetic ankle strength, LHA, and ND between IG and CG ().
Discussion
In this study, we investigated the characteristics of the distribution of plantar pressure and muscle activity and the relationships between these measures. Our results showed that in the IG, there was more loading toward the outside of the foot during SLB-C than in the CG and the FL was lower and TA/FL ratio was higher. In addition, the MPP was correlated with the TA/FL ratio. The LPP was correlated with FL activity. The LPP/MPP ratio was correlated with the FL activity and the TA/FL ratio. Our study showed that the LPP/MPP ratio was increased with decreasing MPP in chronic ankle instability (CAI) patients, and this was related to diminished FL activity and increasing TA/FL ratio. To the best of our knowledge, this result is shown first by our study. The increasing LPP/MPP ratio with decreasing MPP indicates increasing loading in the lateral direction, which is considered as a harmful position that could lead to re-sprain.Citation6
A previous study has shown that FL activity contributes to frontal plane ankle stability,Citation13 and our study suggests that FL activity prevents loading toward the outside of the foot. In addition, a previous study showed that FL activity prevents the ankle from inverting excessivelyCitation12 and increases with added perturbation, which increases LPP.Citation28 From these previous studies, it can be considered that FL has the function of preventing increasing LPP by exhibiting eversion torque, and in the IG in our study, this preventive function may have been diminished. In addition, there were no significant differences in static alignment,Citation14 ankle strength,Citation15,Citation16 and postural control,Citation17,Citation18 which have an influence on plantar pressure distribution. So it was suggested that the increasing LPP/MPP is related to decreasing FL function, which prevents LPP from increasing, and the relative enhancement of the inversion function of TA.
Decreasing FL activity was consistent with the findings of a previous study.Citation29 Rodriguez-Fernandez et alCitation30 suggested decreased excitability of the common peroneal nerve in people with a history of LAS. In addition, Kim et alCitation31 showed a decrease in the Hoffmann’s reflex (H-reflex) in an injured group compared to a CG. It was suggested that there are some changes not only in peripheral function but also in the central nervous system. Futatsubashi et alCitation32 showed increasing gains of the suppressive cutaneous reflex (CR) and implied that impairment of the CR pathway, including the spinal and supraspinal pathways, occurs in CAI patients.Citation32,Citation33 In addition, the CR is important for motor control of the closed kinetic chain (CKC) and is affected by the cutaneous mechanoreceptor.Citation34 It has been shown that the sensitivity of the calcaneal cutaneous mechanoreceptor is diminished in CAI patients.Citation35 Furthermore, Pietrosimone and Gribble Citation36 showed a relationship between FL motor threshold of corticomotor pathway as assessed using transcranial magnetic stimulation (TMS) and subjective feelings of instability. From these studies, it is clear that the reflex pathway, including the spinal and supraspinal levels, is impaired in CAI patients. Thus, it is possible that this diminished FL activity is related to the impaired reflex pathway and sensorimotor deficits. On the other hand, Tokuno et alCitation37 showed that the COP displacement has an effect on the H-reflex and stretch reflex excitability. Additionally, the amplitude of the H-reflex following conditioning cutaneous stimulation depends on the stimulation area of the plantar cutaneous.Citation38 From these previous studies, it can be concluded that it is possible that the altered FL activity was influenced by the plantar pressure distribution itself. Delahunt et alCitation39 have suggested that the increasing activity of the FL occurs by feed-forward motor control to increase ankle stability after landing. Thus, it is possible that the feed-forward mechanism of our subjects was altered in our study. Consequently, it is considered that the decreasing FL activity might be related to these altered spinal-level or supraspinal-level motor control mechanisms.
Our results showed that MPP is correlated with the TA/FL ratio and not only FL activity, and this result suggests that interaction of the FL and TA is important to control MPP. Pozzi et alCitation40 have suggested that the increasing TA activity is important to increase ankle inversion torque (i.e., increasing LPP) during the SLB-C task. In addition, Feger and HertelCitation41 showed that increasing FL activity leads to loading more toward the inside of the foot. In other words, it implies that the FL eversion function and TA inversion function lead to increasing MPP and LPP, respectively. This result indicates that increasing FL function relative to the TA may induce MPP dominance. In a previous study, since TA activity leads the ankle to a close-packed dorsiflexed position, it was found that increasing TA activity before landing is important for ankle stability after landing.Citation39 However, our study results suggest that to increase TA activity in the state of remaining decreased FL activity may cause increasing plantar pressure in the lateral direction.
In general, strength and postural stability are important for an LAS rehabilitation program. Our research suggests increasing LPP/MPP if FL activity is not fully activated, even if ankle strength and postural stability have been fully recovered. Therefore, according to our research, we need to introduce not only the typical concentric ankle training and balance training used for LAS rehabilitation but also FL activation training, which can prevent the increasing LPP that occurs during some movements.
Limitations
Henry et alCitation28 showed that thigh- and trunk-muscle activities are important for postural control. Thus, one limitation of this study was a lack of information about thigh- and trunk-muscle activities. However, it has been reported that most of the postural control during SLB-C is achieved by the ankle joint;Citation42 therefore, this limitation likely had little influence on the results. Second, in this study, the selection of subjects and target leg was conducted by a single athletic trainer, which could imply a conflict with the double-blind study design. However, since it was analyzed by the consolidated possible anonymous, the author was not able to know the subjects’ attributes (IG or CG) during analysis. Therefore, the bias of measurement and analysis is considered to be small. In addition, in regard to the plantar pressure distribution area definition that can be biased, we defined the plantar pressure area using an objective landmark (), and the ICC of plantar pressure analysis was high (). So we think the influence of bias on the results was small. Last, since only 11 athletes met the IG inclusion criteria, we did not perform prior power analysis. Also, the 95% CIs of the effect size crossed zero. However, when we performed a post hoc analysis, all results met medium power (LPP/MPP ratio: 1 − β =0.61, MPP: 1 − β =0.70, FL activity: 1 − β =0.58, TA/FL ratio: 1 − β =0.89). In addition, regarding the 95% CIs of the effect size crossing zero, we thought that it was caused by large individual differences in plantar pressure distribution and the values of muscle activity. However, since the values of plantar pressure distribution and muscle activity were almost the same in previous studiesCitation14,Citation21,Citation43 and the ICCs of the measuring methods were high (), our results are reliable. Thus, these results likely show accurately the characteristics of plantar pressure distribution of the patients of recurrent sprain and its factors.
Disclosure
The authors report no conflicts of interest in this work.
References
- GerberJPWilliamsGNScovilleCRArcieroRATaylorDCPersistent disability associated with ankle sprains: a prospective examination of an athletic populationFoot Ankle Int199819106536609801078
- KonradsenLBechLEhrenbjergMNickelsenTSeven years follow-up after ankle inversion traumaScand J Med Sci Sports200212312913512135444
- BrownTDJohnstonRCSaltzmanCLMarshJLBuckwalterJAPosttraumatic osteoarthritis: a first estimate of incidence, prevalence, and burden of diseaseJ Orthop Trauma2006201073974417106388
- GribblePABleakleyCMCaulfieldBM2016 consensus statement of the International Ankle Consortium: prevalence, impact and long-term consequences of lateral ankle sprainsBr J Sports Med201650241493149527259750
- GribblePABleakleyCMCaulfieldBMEvidence review for the 2016 International Ankle Consortium consensus statement on the prevalence, impact and long-term consequences of lateral ankle sprainsBr J Sports Med201650241496150527259753
- KristianslundEBahrRKrosshaugTKinematics and kinetics of an accidental lateral ankle sprainJ Biomech201144142576257821824618
- KoldenhovenRMFegerMAFraserJJSalibaSHertelJSurface electromyography and plantar pressure during walking in young adults with chronic ankle instabilityKnee Surg Sports Traumatol Arthrosc20162441060107026856315
- RosenASwanikCThomasSGluttingJKnightCKaminskiTWDifferences in lateral drop jumps from an unknown height among individuals with functional ankle instabilityJ Athl Train201348677378123952040
- KavanaghJJBissetLMTsaoHDeficits in reaction time due to increased motor time of peroneus longus in people with chronic ankle instabilityJ Biomech201245360560822177674
- SedoryEJMcVeyEDCrossKMIngersollCDHertelJArthrogenic muscle response of the quadriceps and hamstrings with chronic ankle instabilityJ Athl Train200742335536018059990
- LouwerensJWvan LingeBde KlerkLWMulderPGSnijdersCJPeroneus longus and tibialis anterior muscle activity in the stance phase. A quantified electromyographic study of 10 controls and 25 patients with chronic ankle instabilityActa Orthop Scand19956665175238553819
- Ty HopkinsJMcLodaTMcCawSMuscle activation following sudden ankle inversion during standing and walkingEur J Appl Physiol200799437137817165055
- MitchellADysonRHaleTAbrahamCBiomechanics of ankle instability. Part 2: postural sway-reaction time relationshipMed Sci Sports Exerc20084081522152818614937
- JonelyHBrismeeJMSizerPSJrJamesCRRelationships between clinical measures of static foot posture and plantar pressure during static standing and walkingClin Biomech (Bristol, Avon)2011268873879
- FourchetFKuitunenSGirardOBeardAJMilletGPEffects of combined foot/ankle electromyostimulation and resistance training on the in-shoe plantar pressure patterns during sprint in young athletesJ Sports Sci Med201110229230024149874
- MehlhornATWaltherMYilmazTDynamic plantar pressure distribution, strength capacity and postural control after Lisfranc fracture-dislocationGait Posture20175233233728043054
- JohanssonRMagnussonMHuman postural dynamicsCrit Rev Biomed Eng19911864134371855384
- SongKBurcalCHertelJWikstromEAIncreased visual utilization in chronic ankle instability: a meta-analysisMed Sci Sports Exerc Epub2016517
- KunugiSMasunariANohBMoriTYoshidaNMiyakawaSCross-cultural adaptation, reliability, and validity of the Japanese version of the Cumberland ankle instability toolDisabil Rehabil2017391505826878332
- GribblePADelahuntEBleakleyCSelection criteria for patients with chronic ankle instability in controlled research: a position statement of the International Ankle ConsortiumBr J Sports Med201448131014101824255768
- FegerMADonovanLHartJMHertelJLower extremity muscle activation during functional exercises in patients with and without chronic ankle instabilityPM R201467602611 quiz 61124412672
- De RidderRWillemsTVanrenterghemJRoosenPInfluence of balance surface on ankle stabilizing muscle activity in subjects with chronic ankle instabilityJ Rehabil Med201547763263826035531
- KelesSBSekirUGurHAkovaBEccentric/concentric training of ankle evertor and dorsiflexors in recreational athletes: muscle latency and strengthScand J Med Sci Sports2014241e29e3823941193
- KaminskiTWPerrinDHGansnederBMEversion strength analysis of uninjured and functionally unstable anklesJ Athl Train199934323924516558571
- KondouAInoueYOkamotoKThe method guidelines for range of motion measurementJ Rehabil Med1995324207217
- DelagiEFPerottoAODanielMAnatomical Guide for the Electromyographer: the Limbs and Trunk5 edSpringfield, ILCharles C Thomas Pub Ltd2014140146154
- NakagawaSCuthillIEffect size, confidence interval and statistical significance: a practical guide for biologistsBiol Rev Camb Philos Soc200782459160517944619
- HenrySMFungJHorakFBEMG responses to maintain stance during multidirectional surface translationsJ Neurophysiol1998804193919509772251
- DelahuntEMonaghanKCaulfieldBChanges in lower limb kinematics, kinetics, and muscle activity in subjects with functional instability of the ankle joint during a single leg drop jumpJ Orthop Res200624101991200016894592
- Rodriguez-FernandezALRebollo-RoldanJJimenez-RejanoJJGueita-RodriguezJStrength-duration curves of the common fibular nerve show hypoexcitability in people with functional ankle instabilityPMR201686536544
- KimKMHartJMSalibaSAHertelJModulation of the fibularis longus Hoffmann reflex and postural instability associated with chronic ankle instabilityJ Athl Train201651863764327583692
- FutatsubashiGSasadaSTazoeTKomiyamaTGain modulation of the middle latency cutaneous reflex in patients with chronic joint instability after ankle sprainClin Neurophysiol201312471406141323541471
- DuysensJHoogkamerWLevinOIs there “arthrogenic inhibition” of cutaneous reflexes in subjects with functional ankle instability?Clin Neurophysiol201312471264126623567073
- DrewTRossignolSA kinematic and electromyographic study of cutaneous reflexes evoked from the forelimb of unrestrained walking catsJ Neurophysiol1987574116011843585458
- BurcalCJWikstromEAPlantar cutaneous sensitivity with and without cognitive loading in people with chronic ankle instability, copers, and uninjured controlsJ Orthop Sports Phys Ther201646427027626813754
- PietrosimoneBGGribblePAChronic ankle instability and corticomotor excitability of the fibularis longus muscleJ Athl Train201247662162623182009
- TokunoCDCarpenterMGThorstenssonAGarlandSJCresswellAGControl of the triceps surae during the postural sway of quiet standingActa Physiol (Oxf)2007191322923617635414
- SayenkoDGVetteAHObataHAlekhinaMIAkaiMNakazawaKDifferential effects of plantar cutaneous afferent excitation on soleus stretch and H-reflexMuscle Nerve200939676176919260052
- DelahuntEMonaghanKCaulfieldBAltered neuromuscular control and ankle joint kinematics during walking in subjects with functional instability of the ankle jointAm J Sports Med200634121970197616926342
- PozziFMoffatMGutierrezGNeuromuscular control during performance of a dynamic balance task in subjects with and without ankle instabilityInt J Sports Phys Ther201510452052926347059
- FegerMAHertelJSurface electromyography and plantar pressure changes with novel gait training device in participants with chronic ankle instabilityClin Biomech (Bristol, Avon)201637117124
- WoollacottMShumway-CookAAttention and the control of posture and gait: a review of an emerging area of researchGait Posture200216111412127181
- DeschampsKBirchIMc InnesJDesloovereKMatricaliGAInter- and intra-observer reliability of masking in plantar pressure measurement analysisGait Posture200930337938219647431