
Abstract
Background
The aim of this study was to compare the effect of different soccer-specific maximal actions (Continuous run, Sprint, Sprint with change of direction [Sprint COD], Jump and Shot) upon physiological (oxygen uptake and heart rate) and perceptual (rating of perceived exertion [RPE]) responses and accelerometer load.
Materials and methods
Ten moderately to well-trained male soccer players volunteered to serve as subjects in this study. A repeated within-subject design was used in which each subject was tested on five occasions on different days, one test each day, during a period of 2 weeks. Each of the five tests had a distance of 900 m and lasted 5 minutes, thus the mean speed for all five tests was 3 m/s. During the test, oxygen uptake, heart rate and accelerometer load were measured. Immediately after each test, RPE was recorded, and after the test, oxygen uptake was measured for 5 minutes while the subject sat in an upright position on a chair.
Results
In the comparison of different soccer-specific maximal actions upon physiological and perceptual responses and accelerometer load, this study found that the total accelerometer load was lowest in Sprint and Sprint COD conditions, although the physiological (oxygen uptake and heart rate) and perceptual (RPE) responses were highest in the respective conditions. The Jump condition experienced lower RPE than Sprint and Sprint COD but achieved the highest accelerometer load.
Conclusion
Accelerometer load is not a valid measurement for energy costs or RPE but may function as a complementary tool to investigate the player loads during matches and training.
Introduction
It is well established that soccer is characterized by low-intensity (eg, standing and walking) and high-intensity (eg, running and sprinting) activities. Several studies have investigated the physical and physiological demands of elite soccer players based on distance covered by running at different intensities during a match. Citation1–Citation3 However, these analyses of differences in work rate measured as running speed and distance do not take into account fast discrete movements in soccer (jumping, tackling, collisions, accelerations and decelerations, passing, shooting and change of directions [CODs]),Citation1,Citation4,Citation5 also called maximal actions, which together take place several 100 times in each match. Quite a few of these soccer-specific movements can cause high physical stress on the players, even though the distance and speed are low. These maximal actions may be classified in the low-speed locomotor category, although there will be high physical strain on the player.Citation6–Citation8 Although the energy expended in traveling a fixed distance during continuous exercise is independent of the velocity of the movement, this relationship does not hold under conditions of locomotion that apply during soccer matches. Energy costs throughout a match would be grossly underestimated if they were calculated from only distance covered and did not account for the frequent changes in velocity and direction of motion.Citation6
Triaxial accelerometers are highly responsive motion sensors that record acceleration of body movement in three dimensions. These systems have been found useful not only for quantifying physical activity in a variety of populations but also for quantifying physical and physiological demands in Australian footballCitation7,Citation8 and basketball.Citation9 Movements with accelerations are more energetically demanding than constant velocity running.Citation10,Citation11 Even at a low running speed, a high metabolic load is imposed on a soccer player when acceleration is elevated.Citation10,Citation11 Decelerations are just as common as accelerations in soccerCitation11 and will also contribute significantly to the players’ load. Therefore, accelerometers may be a complementary tool for measuring the load from activities misrepresented by other measuring systems, such as time–motion analysis (ie, high-intensity bouts classified as low-speed activities), oxygen consumption and heart rate measurements.Citation5,Citation6,Citation12 A recent studyCitation12 combined data from a time–motion analysis and triaxial accelerometery and demonstrated that player load is accumulated in a variety of ways across different playing positions. Dalen et alCitation12 found that only using time–motion analysis might underestimate the players’ physical strain, and the potential application of accelerometers for measuring player load at low velocities may be underestimated in a time–motion analysis system. However, other studies have also emphasized the limitations of accelerometers to measure differences in activity with movements at high speed.Citation13 It is clear that the most realistic way of investigating the physical demand of soccer-specific intermittent activity is to monitor physiological responses (ie, oxygen uptake) during match play. However, this approach faces difficulties with the experimental control of the environment because it is impossible to make use of all the measuring instruments during matches. Therefore, different treadmill protocols have previously been used in an attempt to simulate the work rate of a soccer match.Citation14,Citation15 In addition, different intermittent shuttle running tests have been used to simulate the activity patterns of soccer.Citation16 Without doubt, these protocols have allowed a more detailed determination of the physiological responses during soccer-specific intermittent exercises and have provided a better understanding of the demand of these activities. However, these protocols only involved running movements of different intensity with and without a ball and it can be argued that a laboratory-based replication of purely the activity profile would not elicit the same physiological response as match play.Citation17 The effects, on physical and perceptual responses, of including fast discrete maximal actions—such as shooting, tackling and jumping—in an already ongoing movement were not taken into account in these studies. In later years, triaxial accelerometers were used to specify the accelerometer load of these discrete actions. Several studies in team sports have investigated the accelerometer load and used triaxial accelerometers as an additional part of their global positioning system (GPS) or radio-based systems for performance analyses (ie, GPSport, Catapult, ZXY Sport Tracking).Citation12,Citation18–Citation21 However, to the best of our knowledge, studies on accelerometer loads in combination with physiological and perceptual measurements in order to specify the demand of these fast, discrete, maximal actions in soccer are rather sparse.
Therefore, the aim of this study was to compare the effect of different soccer-specific maximal actions (Continuous run, Sprint, Sprint with change of direction [Sprint COD], Jump and Shot) on physiological (oxygen uptake and heart rate) and perceptual (rating of perceived exhaustion) responses and accelerometer load. It was hypothesized that accelerometer load, physiological and perceptual responses increase with the discrete maximal actions, but that accelerometer load would be underestimated in conditions with high-speed activities (Sprint and Sprint COD). In addition, it was hypothesized that Sprint and Sprint COD would have the highest values in physiological and perceptual responses because of the highest percentage of time spent’ in maximal activity during the conditions.
Materials and methods
Subjects
Ten moderately to well-trained male soccer players volunteered to serve as subjects in this study. The average age of the subjects was 25±2.7 years, body height 179.0±5.4 cm and body mass 78.3±7.4 kg. The subjects had three to five training sessions each week before the start of the competition season, and none reported taking any medication or being under medical care. The subjects were informed orally and in writing about the purpose of the experiment, the experimental procedure and possible risks and discomfort. All subjects gave their written informed consent to take part in the study and were assured that they as volunteers could leave the study at any stage without giving a reason. The subjects were also told not to change their training routines during the study, to avoid hard training and to avoid alcohol the day before each test. The study was conducted according to the Declaration of Helsinki and approved by the Norwegian Centre for Research Data.
Design
A repeated within-subject design was used in which each subject was tested on five occasions during different days, one test each day, during a period of 2 weeks. The tests were performed in a randomized order. The test venue was in a sports hall, and all tests were performed on a tartan floor. Four of the tests consisted of different series of maximal actions (detailed below) carried out sequentially, with running breaks in between. Continuous submaximal running was chosen as a baseline condition test with which the four maximal action tests could be compared.
Procedures
Before each test, the subject performed a 15-minute warm-up. During the first 5 minutes, the subject ran at an intensity of 70% of maximum heart rate. During the last 10 minutes, the subject ran at 80% of maximum heart rate, where three maximal 20 m sprints were included. After the warm-up, the test equipment was fastened and the test began within 4–5 minutes after the end of the warm-up. During the test, oxygen uptake, heart rate and accelerometer load were measured. Immediately after each test, the rating of perceived exertion (RPE) was recorded. After the test, oxygen uptake was measured for 5 minutes while the subject sat in an upright position on a chair. To measure oxygen uptake, a portable oxygen analyzer was mounted in a small backpack on the subject’s back and tightened with a belt at the breast and above the hip level. The complete instrument including batteries weighed 1.3 kg. To measure heart rate and acceleration loads, an accelerometer was mounted at the waist using an elastic belt with a belt clip, along with the manufacturer’s accompanying a chest strap heart rate monitor.Citation22
Test conditions
Each of the five tests involved a distance of 900 m and lasted 5 minutes, thus the mean speed for all five tests was 3 m/s. This pace is the mean value of the “jogging category” used in investigations of physical demands in soccer games.Citation12 The distance of 900 m consisted of 15 shuttle runs where the subject ran 30 m, turned 180° and ran 30 m back to the start, 15 times (15 shuttle runs). Each shuttle run lasted for 20 seconds with the use of a digital signal for the pace every 10 seconds. During each shuttle run, in four of the five tests maximal actions were performed (). The subject was informed about the number of shuttle runs during the test. For all tests, the subject ran with the same training shoes and was encouraged to perform their best during the maximal actions.
Table 1 Description of the five different test conditions
Instruments
Oxygen uptake was measured using the Metamax II metabolic cart (Cortex Biophysics, GmbH, Leipzig, Germany) portable metabolic analyzer, with the instrument’s breathing valve (Triple V) mounted on the face mask. A standard two-point gas calibration procedure against ambient air and a commercial gas of known concentrations of O2 (16.00%) and CO2 (4.00%) was performed in the morning after a 30-minute warm-up period for the instrument. Ambient air measurement was also carried out before each test. The flow transducer was calibrated using a 3 L high-precision calibration syringe (Calibration syringe D, SensorMedics, Yorba Linda, CA, USA) before each test. The Metamax II has been validated and the oxygen uptake reported by this analyzer was precisely measured within subjects.Citation23
Accelerometer load and heart rate data were measured using an ActiGraph wGT3X+ monitor (ActiGraph, Pensacola, FL, USA). The ActiGraph is a lightweight (27 g), compact (dimensions of 3.8 cm×3.7 cm×1.8 cm) and rechargeable accelerometer (ie, lithium polymer battery powered).Citation24 The ActiGraph measured acceleration in three axes (vertical [Y], mediolateral [X] and anteroposterior [Z]) and provided activity counts as a composite vector magnitude of these three axes (total). The activity monitor samples acceleration at a rate of 30 Hz. The output of the accelerometers is given in “counts”, with one count equaling 16.6 miliG/s at 0.75 Hz.Citation24 Activity counts, which are the results summing the absolute values of the sampled change in acceleration measured during the time period, represent the quantitative measure of activity over time. The ActiGraph also included the vector summed value √(Y2+X2+Z2), known as “vector magnitude”.Citation24 In this study, two accelerometers were used, one on each side of the waist, and the mean values from the two accelerometers were defined as the subject’s accelerometer load.
To register subjective perceived exertion, Borg’s rating scale was used (RPE6–20),Citation25,Citation26 with the subject instructed to report an overall feeling of exertion immediately after each 900 m running test. A 6 on the RPE6-20 scale means “very easy” and 20 corresponds to “total exhaustion”.
The average of all measured variables during each of the five 5-minute tests and during a 5-minute rest after each test was used for further analyses.
Statistical analysis
To investigate the effect of different soccer-specific maximal actions on the physiological and perceptual responses, a one-way analysis of variance (Run, Sprint, Sprint COD, Jump and Shot) with repeated measures on the accelerometer load and each response was used.
In the case that the sphericity assumption was violated, the Greenhouse–Geisser adjustments to the p-values are reported in the results. A post hoc test using Holm–Bonferroni probability adjustments was used to locate significant differences. The criterion level for significance was set at p<0.05. The effect size was evaluated with η2 (partial eta squared), where 0.01<η2<0.06 constitutes a small effect, 0.06<η2<0.14 constitutes a medium effect, and η2>0.14 constitutes a large effect.Citation27 Statistical analysis was performed using SPSS 23.0 for Windows (SPSS Inc., Chicago, IL, USA).
Results
A significant effect was found for each of the variables measured during different soccer-specific maximal actions (F≥2.86; p=0.037; η2≥0.24, and ). Post hoc comparison showed that accelerometer load in the anterior–posterior direction in the Jump condition was significantly higher than all the other actions except the Sprint condition ( and ); whereas in the medial–lateral direction, the Sprint condition was the lowest compared with all other conditions. In the vertical direction, the total accelerometer load in the Jump condition was the highest followed by the Shot and Run conditions (no significant difference between these two conditions, p=0.28), whereas Sprint and Sprint COD conditions had produced the lowest vertical and total accelerometer load ( and ).
Figure 1 Mean acceleration development over time in anterior–posterior (A), medial–lateral (B), and vertical (C) directions and total amount of acceleration (D) per soccer-specific action.
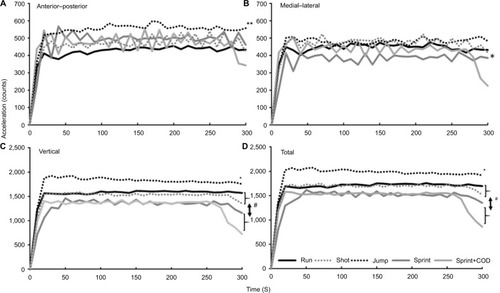
Table 2 Mean ± SD of acceleration load in different directions, heart rate, oxygen uptake, oxygen uptake after exercise and RPE per soccer-specific action ordered (left to right) after RPE results (lowest to highest)
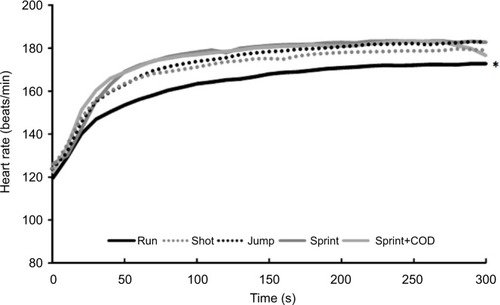
Oxygen uptake during and after the Run condition was significantly lower than the other conditions, followed by the Shot condition. No significant differences in oxygen uptake during and after the Sprint, Sprint COD and Jump conditions were found ( and ). However, the heart rate was only significantly lower when performing the Run condition compared with all other actions ().
Figure 2 Mean oxygen uptake development over time during (A) and after (B) each soccer-specific action.
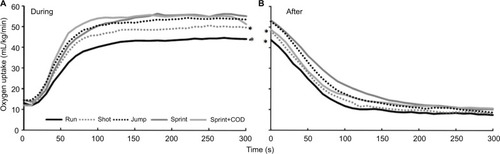
Figure 3 Mean heart rate development over time per soccer-specific action.
RPE was significantly different between all the soccer-specific actions, except between Sprint and the Sprint COD (p=0.52) starting from Run–Shot–Jump to Sprint and Sprint COD, which were perceived as the heaviest actions ().
Discussion
The main objection of this study was to compare the effect of different soccer-specific maximal actions upon physiological and perceptual responses and accelerometer load. The main findings were that the total accelerometer load was lowest in Sprint and Sprint COD conditions, although the physiological (oxygen uptake and heart rate) and perceptual (RPE) responses were highest in the respective conditions. Moreover, we found no differences in physiological response between Sprint, Sprint COD and Jump conditions. The Jump condition experienced lower RPE than Sprint and Sprint COD but achieved the highest accelerometer load.
The ranking order from high to low in RPE between the conditions indicates that Sprint and Sprint COD conditions led to the highest perception of exhaustion, followed by Jump, Shot and Run, in that order. With the exception of the Jump condition, the RPE values correspond to oxygen uptake (throughout and after exercise) and heart rate values. In this investigation, all the five conditions involved moving the same distance (900 m) in the same time (5 minutes). Therefore, approximately the total amount of work completed should be the same for all conditions, except for the jumps in the Jump condition. Not surprisingly, this shows that it is not the work done that explains the rate of perceived exhaustion, but that interval-based activities require higher demands of oxygen uptake and oxygen deficit.Citation17,Citation28 Soccer involves a number of acyclical changes in activity, each increases the energy demands placed on the athlete even when running speed is low. The oxygen uptake was 23% higher in the Jump condition compared with the Run condition and 30% higher in the Jump condition than 5 minutes after. In the Jump condition, there was one maximal jump every tenth second, and in total maximal 30 jumps over a 5-minute period. The Jump condition also increases the subjects’ mean RPE (RPE6–20) from “fairly light” to “hard” compared with the Run condition. In the traditional measurements in team sports of speed and distance (time–motion analysis), jumps would not have been registered because they do not include movement from one location to another. In our study, there are no differences between the Jump, Sprint and Sprint COD conditions in oxygen uptake or heart rate. This indicates that performing 30 jumps costs approximately the same amount of energy as 15 sprints or sprints with COD, while it feels easier to perform than the sprints, as indicated by the lower RPE ().
Conversely, the Shot condition as a specific maximal action did not result in similar physiological and perceptual responses compared with the other soccer-specific actions. The Shot condition cost more effort than the Run condition, but although the heart rate was similar, oxygen uptake ( and ) and RPE were lower than in the Jump and Sprint conditions ( and ). This indicates that this type of action did cost less for soccer players even when they had to shoot with maximal effort. A possible reason for this could be that they only shot a total of 15 times, while in the Jump condition, 30 jumps were made. Perhaps by doubling the total number of shots, physiological and perceptual responses could be similar to jumping and sprinting. Moreover, a vertical jump is a countermovement activity with a large eccentric phase during the landing, which is different from a shot movement.
In this study, the total horizontal workload (900 m) and exercise time (5 minutes) was the same for each condition to avoid an effect of this on the responses. In the Jump and Shot conditions, the subjects had approximately the same horizontal velocity as in the Run condition, whereas in the Sprint conditions, the ratio of sprinting compared with jogging was ~1:4. This shows that with these 15 sprints and lower jogging velocity between the sprints, physiological and perceptual responses increased by 26%–28%. This was in accordance with Greig et al who found the RPE and physiological load to be consistently greater during an interval than a steady-state protocol with an equivalent total distance covered.Citation17
The order of physiological and perceptual responses of the specific soccer actions from low to high (Run–Shot–Jump–Sprint–Sprint COD) were not similar to those of the acceleration load ( and ), indicating that accelerometer loads are not similar to physiological and perceptual responses. Acceleration load (anterior–posterior) was the highest in the Jump condition, indicating that an extra change in direction (vertical) causes extra acceleration loads. This also resulted in a total acceleration load compared to the other conditions. This demonstrates that the vertical component from the accelerometer load seems to be exaggerated compared to the mediolateral and anteroposterior axes. The squared value from medio–lateral and anteroposterior axes is about 10% of the squared value from the vertical axes. Therefore, the difference in accelerometer load is mainly due to a difference in vertical accelerations. This is in line with the results of Sasaki et al who achieved vector magnitude counts/minute (here acceleration load) close to the counts/minute from vertical acceleration.Citation29
Another novel finding from this study was that the Sprint and Sprint COD conditions experienced the lowest values from accelerometer load, especially in vertical and mediolateral directions. This can be explained by the fact that, in sprinting, less vertical oscillation occurs than in running.Citation30 Probably, the same occurs in a mediolateral direction. This causes a lower acceleration load in the Sprint conditions compared with the other conditions. Our results suggest the difficulty in measuring high-velocity activity from accelerometer load. Results from our conditions show that the Run condition has a higher accelerometer load than both the Sprint and Sprint COD conditions, although these conditions have higher measures of oxygen uptake, heart rate and RPE6–20. Although accelerometer load is an established measure of physical activity,Citation31 it is clear from this study that it does not correspond with oxygen uptake in these types of activities. Therefore, one might question if accelerometer load is a valid measurement for energy costs or ratings of perceived exhaustion in types of activity that include high-speed running.Citation13 However, soccer and other team sports usually have other time–motion analysis systems to investigate running at different intensities, but these systems have a problem with detecting high-intensity actions performed during low-velocity speed.Citation8 Therefore, accelerometer load data may function as a complementary tool to investigate the player loads during matches and training.Citation12
A limitation of our study was that we used a triaxial accelerometer from ActiGraph that has the company’s own settings to calculate acceleration load. This calculation was different from other well-known manufacturers in team sport analysis that use triaxial accelerometers (ie, GPSport, Catapult and ZXY Sport Tracking). This makes it difficult to compare the acceleration loads measured in our study with those from these other systems. Furthermore, the accelerometers of ActiGraph have an operating range of 6 g, which underestimate the kinematics during running compared with those that measure with 32 g or higher.Citation32 With sprinting, this underestimation will be enhanced.Citation13
However, examples from soccer show similar to our results that accelerometers underestimate load of high-velocity movements but might be a complementary tool for the measurement of load in low-velocity movements.Citation12 Dalen et alCitation12 found that full backs covered 230% and 300% longer high-intensity running and sprint distance (<19.8 and 25.2 km−h) than central defenders and accelerated (>2 m/sCitation2) and decelerated (< −2 m/sCitation2) 39% and 55%, respectively, more often than central defenders. In spite of these differences in time–motion analysis data, central full backs had less (accelerometer) player load than central defenders. This finding highlights the potential application of accelerometers to measure player load at low velocities that may be underestimated by other measurement systems.Citation8,Citation33 Therefore, accelerometers may be a complementary tool for measuring the load from activities misrepresented by time–motion analysis (ie, high-intensity bouts classified as low-speed activities), which, as we know from previous studies, occur several 100 times in a match. In future studies, these systems should be included together with the physiological and perceptual measurements to gain more knowledge about demands caused by fast, discrete and maximal actions in combination with running.
Conclusion
The order of physiological and perceptual responses of the specific soccer actions from low to high (Run–Shot–Jump–Sprint–Sprint COD) were not similar to that of the acceleration load indicating that accelerometer loads are not similar to physiological and perceptual responses. This demonstrates that the vertical component from the accelerometer load seems to be exaggerated compared to the mediolateral and anteroposterior axes. It also questions whether accelerometer load is a valid measurement for energy costs or ratings of perceived exhaustion in types of activity that include high-speed running. However, soccer and other team sports usually have other time–motion analysis systems to investigate running at different intensities, but these systems have a problem with detecting high-intensity actions performed during low-velocity speed. Therefore, accelerometer load data may function as a complementary tool to investigate player loads during matches and training that have previously been misrepresented by time–motion analysis (ie, high-intensity bouts classified as low-speed activities).
Disclosure
The authors report no conflicts of interest in this work.
References
- MohrMKrustrupPBangsboJMatch performance of high-standard soccer players with special reference to development of fatigueJ Sports Sci200321751952812848386
- CarlingCLe GallFDupontGAnalysis of repeated high-intensity running performance in professional soccerJ Sports Sci201230432533622248291
- BradleyPSNoakesTDMatch running performance fluctuations in elite soccer: indicative of fatigue, pacing or situational influences?J Sports Sci201331151627163823808376
- BangsboJThe physiology of soccer: with special reference to intense intermittent exerciseActa Physiol Scand Suppl199461911558059610
- IaiaFMRampininiEBangsboJHigh-intensity training in footballInt J Sports Physiol Perform20094329130619953818
- CarlingCBloomfieldJNelsenLReillyTThe role of motion analysis in elite soccer: contemporary performance measurement techniques and work rate dataSports Med2008381083986218803436
- BoydLJBallKAugheyRJThe reliability of MinimaxX accelerometers for measuring physical activity in Australian footballInt J Sports Physiol Perform20116331132121911857
- BoydLJBallKAugheyRJQuantifying external load in Australian football matches and training using accelerometersInt J Sports Physiol Perform201381445122869637
- MontgomeryPGPyneDBMinahanCLThe physical and physiological demands of basketball training and competitionInt J Sports Physiol Perform201051758620308698
- di PramperoPEFusiSSepulcriLMorinJBBelliAAntonuttoGSprint running: a new energetic approachJ Exp Biol2005208Pt 142809281616000549
- OsgnachCPoserSBernardiniRRinaldoRdi PramperoPEEnergy cost and metabolic power in elite soccer: a new match analysis approachMed Sci Sports Exerc201042117017820010116
- DalenTIngebrigtsenJEttemaGHjeldeGHWisløffUPlayer load, acceleration, and deceleration during forty-five competitive matches of elite soccerJ Strength Cond Res201630235135926057190
- AlexanderJPHopkinsonTLWundersitzDWTSerpellBGMaraJKBallNBValidity of a wearable accelerometer device to measure average acceleration values during high-speed runningJ Strength Cond Res201630113007301326937772
- DrustBReillyTCableNTPhysiological responses to laboratory-based soccer-specific intermittent and continuous exerciseJ Sports Sci2000181188589211144865
- DrustBReillyTCableNTMetabolic and physiological responses to a laboratory based soccer-specific intermittent protocol on a non-motorised treadmillSpinksWScience and Football IVLondonRoutledge2002217225
- BishopNCBlanninAKRobsonPJWalshNPGleesonMThe effects of carbohydrate supplementation on immune responses to a soccer-specific exercise protocolJ Sports Sci1999171078779610573332
- GreigMPMcNaughtonLRLovellRJPhysiological and mechanical response to soccer-specific intermittent activity and steady-state activityRes Sports Med2006141295216700403
- MalloJMenaENevadoFParedesVPhysical demands of top-class soccer friendly matches in relation to a playing position using global positioning system technologyJ Hum Kinet201547117918826557202
- PolglazeTDawsonBHiscockDJPeelingPA comparative analysis of accelerometer and time-motion data in elite men’s hockey training and competitionInt J Sports Physiol Perform201510444645125364940
- ArrudaAFSCarlingCZanettiVAokiMSCouttsAJMoreiraAEffects of a very congested match schedule on body-load impacts, accelerations, and running measures in youth soccer playersInt J Sports Physiol Perform201510224825225117378
- AkenheadRHarleyJATweddleSPExamining the external training load of an English Premier League football team with special reference to accelerationJ Strength Cond Res20163092424243226817740
- DomenePAMoirHJPummellEKnoxAEastonCThe health-enhancing efficacy of Zumba® fitness: an 8-week randomised controlled studyJ Sports Sci201634151396140426571136
- MedboJIMamenAWeldeBVon HeimburgEStokkeRExamination of the Metamax I and II oxygen analysers during exercise studies in the laboratoryScand J Clin Lab Invest200262858559812564617
- Actilife Users Manual [computer program]PensacolaActigraph, LLC2009
- BorgGAPsychophysical bases of percieved exertionMed Sci Sports Exerc19821453773817154893
- NobleBJBorgGAJacobsICeciRKaiserPACategoryratio perceived exertion scale: relationship to blood and muscle lactates and heart rateMed Sci Sports Exerc19831565235286656563
- CohenJStatistical Power Analysis for the Behavioural Sciences2nd edErlbaumHillsdale1988
- GirardOMendez-VillanuevaABishopDRepeated-sprint ability – part I: factors contributing to fatigueSports Med201141867369421780851
- SasakiJEJohnDFreedsonPSValidation and comparison of Acti-Graph activity monitorsJ Sci Med Sport201114541141621616714
- MonteAMuolloVNardelloFZamparoPSprint running: how changes in step frequency affect running mechanics and leg spring behaviour at maximal speedJ Sports Sci201735433934527028346
- Santos-LozanoASantín-MedeirosFCardonGActigraph GT3X: validation and determination of physical activity intensity cut pointsInt J Sports Med2013341197598223700330
- MitschkeCKiesewetterPMilaniTThe effect of the accelerometer operating range on biomechanical parameters: stride length, velocity, and peak tibial acceleration during runningSensors2018181130
- GaudinoPIaiaFMAlbertiGStrudwickAJAtkinsonGGregsonWMonitoring training in elite soccer players: systematic bias between running speed and metabolic power dataInt J Sports Med2013341196396823549691