Abstract
The aim of this study was to investigate predictor variables of anthropometry, training, and previous experience in order to predict a half marathon race time for future novice recreational male half marathoners. Eighty-four male finishers in the ‘Half Marathon Basel’ completed the race distance within (mean and standard deviation, SD) 103.9 (16.5) min, running at a speed of 12.7 (1.9) km/h. After multivariate analysis of the anthropometric characteristics, body mass index (r = 0.56), suprailiacal (r = 0.36) and medial calf skin fold (r = 0.53) were related to race time. For the variables of training and previous experience, speed in running of the training sessions (r = −0.54) were associated with race time. After multivariate analysis of both the significant anthropometric and training variables, body mass index (P = 0.0150) and speed in running during training (P = 0.0045) were related to race time. Race time in a half marathon might be partially predicted by the following equation (r2 = 0.44): Race time (min) = 72.91 + 3.045 * (body mass index, kg/m2) −3.884 * (speed in running during training, km/h) for recreational male runners. To conclude, variables of both anthropometry and training were related to half marathon race time in recreational male half marathoners and cannot be reduced to one single predictor variable.
Introduction
Running is a popular sports discipline and can be performed over various distances.Citation1,Citation2 Different physiological, anthropometric, and training characteristics seem to influence running performances depending upon the length and the duration of the performance.Citation3–Citation6 Regarding the anthropometric characteristics, the relationship of skin-fold thickness to running performance has been discussed for a number of years. Hagan et al reported in 1981 that the sum of seven skin-folds was correlated to a marathon performance time.Citation7 Bale et al showed in 1986 that the total sum of skin-folds, the type and the frequency of training, and the running experience such as the number of years running were the best predictors of running performance and success over the 10,000 m distance.Citation8 A correlation of thicknesses of selected skin-folds with running performance has been reported for top class male and female runners of distances from 100 m to 10,000 m and the full marathon distance.Citation9,Citation10 High correlations were found for the front thigh and medial calf skin-fold with both 1500 m and 10,000 m race times in male runners.Citation9 Other anthropometric characteristics related to running performance apart from selected skinfold thicknesses were the sum of skin-folds,Citation11,Citation12 body mass,Citation13,Citation15 body mass index,Citation11,Citation14,Citation16 percent body fat,Citation11,Citation14,Citation17 and the circumference of upper arm.Citation14,Citation15,Citation18 These associations were mainly found in ultra-marathoners.
Apart from anthropometry, the volume and intensity of training sessions have also been reported to influence running performance. Bale et al showed that elite runners who averaged higher training frequencies, a higher weekly training volume and had more running experience performed better over the 10,000 m distance.Citation8 In marathon finishers, the longest distance covered per training session was related to race time.Citation19 In female marathoners, the number of training sessions per week and the number of years training were the best predictors of race performance at the marathon distance.Citation20 Scrimgeour et al reported that runners who trained for more than 100 km per week had significantly faster race times over 10 km to 90 km than athletes covering less than 100 km.Citation21 When the training of marathoners was analyzed in detail, several parameters such as training session days, number of total training sessions, total kilometers covered during a training session, average number of kilometers covered per training session, longest mileage covered per training session, the total of training minutes, maximal kilometers ran per week, average kilometers covered per week and the average kilometers covered per day were related to marathon performance times.Citation7,Citation19,Citation22 Hewson and Hopkins described a correlation between the weekly duration of continuous running at moderate intensity and the performance of runners specializing in longer distances.Citation23 The intensity of training sessions was also important regarding race performance. Peak running velocity was highly related to a 5000 m run time for both male and female athletes.Citation24
The lower thickness of the skin-folds of the lower limbs in high level runners seems to be due to training. Legaz and Eston investigated the change in skin-fold thicknesses across 3 years in high-level runners.Citation10 Training resulted in a significant increase in performance and in a decrease in the sum of six skin-folds, abdominal, front thigh, and medial calf skin-folds. In a sample of 24 male and female endurance runners, they described a significant association between the decrease in front thigh skin-fold thickness and improvement in performance due to training.Citation10
This background shows that the relationship of both skin-fold thicknesses and training variables to race performance has been investigated for running distances from 100 m to the full marathon length for male and female top athletes, but not for recreational male runners over the half marathon distance. In general, the largest group of competitors in half marathons and marathons are recreational runners, not professional runners.Citation25 Therefore, the question whether there were relationships between both selected skin-fold thicknesses and training variables with a half marathon race performance for male recreational runners can be raised.
The first aim of this study was to investigate which basic variables of physical characteristics, training, or previous experience were related to a half marathon race time in recreational male runners. Based on the existing literature, it was hypothesized that variables of both anthropometry and training would be related to a half marathon race time in recreational runners. We intended to create an equation to predict a half marathon race time for future novice male half marathoners, based upon basic measurements of anthropometry and training. An equation based upon basic measurements of anthropometry and training might help future half marathoners to better prepare for the first half marathon. The second aim was to investigate potential associations between skin-fold thicknesses and training characteristics such as volume and running speed. A significant association would help the runners to better plan their training with either high volume or fast training sessions.
Materials and methods
Subjects and race
The organizer of the ‘Half Marathon Basel’ in Basel, Switzerland, contacted all the male participants in the 2010 race via a separate newsletter, 3 months before the race, in which they were asked to participate in the study. A total of 691 male athletes started the ‘Half Marathon Basel’, from which 84 male starters volunteered to participate in the investigation. These athletes were all recreational and nonprofessional athletes, where a professional athlete was defined as a person who earns his livelihood with only the financial support of a sponsor, plus trophy money. Of the study group, all 84 subjects finished the ‘Half Marathon Basel’ within the time limit of 2.3 hours. The study was approved by the Institutional Review Board of the Canton of St Gallen, Switzerland. The subjects were informed of the experimental procedures and gave their informed written consent. The ‘Half Marathon Basel’ took place on 12th September 2010, in the City of Basel, Switzerland. The athletes started at 11am and had to run one flat lap on asphalt. The weather was fine and dry. The temperature was 13°C at the start and the relative humidity was at 63%. The organizer provided nutrition and drinks at eight aid stations.
Measurements and calculations
Before the start of the race body mass, body height, and thicknesses of skin folds were measured. Body mass was measured to the nearest 0.1 kg using a Beurer® BF15 scale (Beurer GmbH, Ulm, Germany). Body height was measured to the nearest 1 cm using a stadiometer. Body mass index (kg/m2) was calculated from body mass and body height. Skin-fold thicknesses were measured by the same investigator at the following eight sites: pectoral, triceps, mid-axilla, subscapular, abdominal, suprailiacal, front thigh, and medial calf. Skin-fold data were obtained using a skin fold caliper (GPM-Hautfaltenmessgerät, Siber and Hegner, Zurich, Switzerland) and recorded to the nearest 0.2 mm. The measurements were made three times on the right side of the body and the means were analyzed. Readings were performed 4 seconds after applying the caliper to ensure the reliability of the skin-fold measurements.Citation26 An intra-tester reliability check was conducted on 27 male runners prior to testing. Intra class correlation (ICC) within the two judges was excellent for all anatomical measurement sites (ICC > 0.9).Citation27 Percent body fat was calculated using the following formula according to Ball et al with percent body fat = 0.465 + 0.180 * (Σ7SF) −0.0002406 * (Σ7SF)Citation2 + 0.0661 * (age) where Σ7SF = the sum of the skin-fold thicknesses of pectoral, mid-axilla, triceps, subscapular, abdomen, suprailiacal, and front thigh mean skin-folds.Citation28
Upon enrolling in the study the athletes were asked to maintain a comprehensive training diary recording all their training sessions, showing distance and duration, in the 3 months before the race. The training records included the weekly number of training sessions, showing duration, distance, and running speed the weekly kilometers ran, the weekly hours ran, and the minimal and maximal kilometers ran per week. The athletes recorded their running speed during training in minutes/km. Additionally, they reported the number of years of active participation in running.
Statistical analysis
A power calculation was performed according to Gatsonis and Sampson.Citation29 To achieve a power of 80% (two-sided Type I error of 5%) to detect a minimal association between race time and anthropometric characteristics of 20% (ie, coefficient of determination r2 = 0.2) a sample of 40 participants was required. Normally distributed data are presented as mean and standard deviation (SD). In a first step to reduce the number of predictor variables, the association of the variables of anthropometry, training and pre-race experience with total race time was investigated using bivariate correlation analysis. Given the multiple tests, Bonferroni correction was applied for n = 23 variables (P = 0.002).Citation30 In a second step, multiple linear regression analysis was used to further investigate the relationship of variables with significance in the bivariate analysis to race time. A probability value of less than 0.05 was accepted as significant for the multiple linear regression analysis. The best predictor variables were used to create an equation that could predict the half marathon race time. Bland-Altman analysis was used to determine absolute limits of agreement between predicted and effective race time. The coefficient of variation of performance (CV% = 100 × SD/mean) for race time was calculated.
Results
The 84 participants completed the half marathon distance within 103.9 (±16.5) min (CV = 15.8%), running at a mean speed of 12.7 (±1.9) km/hour. In the bivariate analysis using the age and the anthropometric measurements, body mass index, the skin-fold thicknesses at pectoral, mid-axilla, triceps, abdominal, suprailiacal, and medial calf site and percent body fat were related to half marathon race time (see ). For the variables of experience and training, the weekly kilometers ran, the minimal and maximal distance ran per week, the number of running training sessions per week, the distance per running session, and the running speed of the training sessions were related to race time. When the significant anthropometric variables after bivariate analysis were inserted into a multivariate regression model, body mass index (P = 0.0097), both the suprailiacal (P = 0.044) and medial calf skin-fold thickness (P = 0.0350) were associated with half marathon race time (r2 = 0.45). For the training variables, running speed during training sessions (P = 0.0001) was related to race time after multivariate analysis (r2 = 0.47). When all significant variables of both anthropometry and training were inserted in a further multivariate regression model, body mass index and the speed of the training sessions (see ) correlated to race time. Race time in a half marathon might be partially predicted by the following equation (r2 = 0.44): Race time (minutes) = 72.91 + 3.045 * (body mass index, kg/m2) −3.884 × (speed in running during training, km/hours) for recreational male runners. The predicted race time using this equation was 104.0 (10.4) minutes and correlated highly significantly to the achieved race time (see ). shows the level of agreement using Bland–Altman method (Bias = −25.1 ± 25.1 minutes) between the effective and the predicted race time. Intra class correlation (ICC) between effective and predicted race time was 0.73.
Figure 1 The predicted half marathon race time correlated significantly to the achieved half marathon race time (n = 84) (r = 0.63, P < 0.0001).
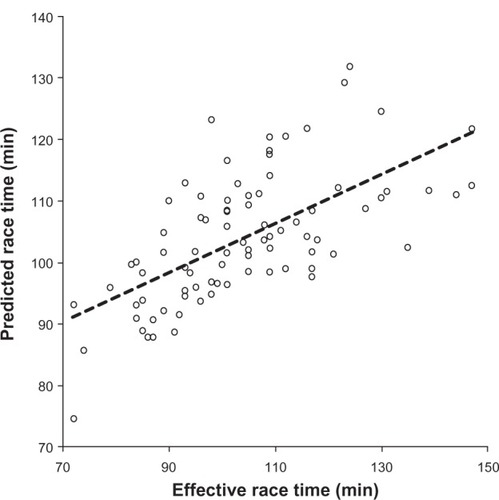
Figure 2 Bland–Altman plots comparing predicted with effective race time.
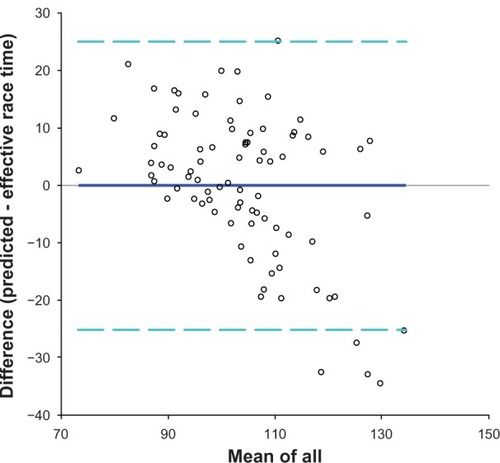
Table 1 Association between age, selected anthropometric and training variables with the half marathon race time for the 84 runners
Table 2 Associations between significant characteristics of anthropometry and training with race time after multiple linear regression (n = 84)
Skin-fold thicknesses with the exception of mid-axilla, triceps, and subscapular skin-fold and body fat were associated with both the weekly kilometers ran and the running speed during training (see ). Weekly running hours were not related to skin-fold thicknesses and body fat.
Table 3 Association between skin-fold thicknesses and training variables
Discussion
The first aim of this study was to investigate which basic variables of physical characteristics, training, and previous experience were related to the half marathon race time in recreational male runners. Based on the existing literature, it was hypothesized that variables of both anthropometry and training would be related to a half marathon race time, not only a single anthropometric characteristic such as a skin-fold thickness of the lower limbs. In accordance with our hypothesis, both body mass index as a variable of anthropometry and speed in running during the training sessions as a variable of training were related to the half marathon race time. Although skin-fold thicknesses of the lower limbs were related to running performance in elite athletes Citation9, lower limb skin-fold thicknesses no longer appeared to be predictive in runners when corrected in a multivariate analysis with characteristics of training and previous experience.Citation31–Citation33
Association of anthropometric measurements with the half marathon race time
The main intention of our study was to find an association between skin-fold thicknesses and the half marathon race time in male recreational runners, as has been described for male high-level runners over 1500 m and 10,000 m.Citation9 Arrese and Ostáriz reported significant and positive correlations between the front thigh and the medial calf skin-fold thickness with 1500 m and 10,000 m race times for elite male runners, but not for marathoners.Citation9 We can confirm their findings that the calf skin-fold thickness was also significantly and positively related to running performance in these recreational male runners over the half-marathon distance after bivariate analysis, but not for the front thigh skin-fold. An explanation of these different findings could be that Arrese and Ostáriz did not include runners over the half marathon distance, but highly trained male runners over distances from 100 m to 10,000 m and the full marathon distance with a coefficient of variance (CV) in race performance for male marathoners of 2.19%, drawn from the Top 50 sprinters and long-distance runners in Spain.Citation9 In contrast, the present study was focused on recreational male runners who were much more heterogeneous over the half marathon distance (CV = 15.8%).
In the multivariate analysis of the anthropometric measurements, body mass index and both the medial calf and the suprailiacal skin-fold thickness were also related to race time. The finding that the suprailiacal skin-fold thickness was related to half marathon race time might be due to the higher body mass index of these recreational runners compared to the elite runners of Arrese and Ostáriz.Citation9 The body mass index in the 10,000 m runners of Arrese and Ostáriz was 20.06 kg/m2,Citation9 which was considerably lower compared to the body mass index of 23.8 kg/m2 in these recreational runners. Several studies have yielded a relationship between body mass,Citation7,Citation8,Citation13–Citation15 body mass index,Citation11,Citation14,Citation16,Citation22,Citation34 body fat,Citation11,Citation14,Citation17,Citation22 and performance for long distance runners. In the present study, both percent body fat and body mass index were also significantly related to the half marathon race time in the bivariate analysis. However, in the multivariate analysis, body fat remained no longer a significant predictor variable of anthropometry. We must assume that skin-fold thicknesses and percent body fat are of lesser importance than body mass index for recreational male runners than it is for elite runners.
Association of training variables with the half marathon race time
For marathoners, the number of training session days, the number of total training sessions, the total kilometers covered during a training session, the mean number of kilometers covered per training session, the longest mileage covered per training session, the total of training minutes, the maximal kilometers ran per week, the mean kilometers covered per week, and the mean kilometers covered per day were related to the marathon race time.Citation19,Citation22,Citation23 For the recreational male half marathoners in this study, the weekly kilometers ran, the minimal and maximal distance ran per week, the hours ran per week, the number of running training sessions per week, and the running speed of the training sessions were related to the half marathon race time after bivariate analysis. In the multivariate analysis, however, only the running speed during training remained significant. Also, when controlled for the anthropometric measurements, the running speed during the training sessions remained the single predictor training variable. Additionally, for runners of distances less than a half marathon, the training speed was associated with performance. In 10,000 m runners, high-intensity training was related to performance,Citation35 and in distance runners the peak running velocity over 5000 m was highly predictive of the distance running performance.Citation24 We must assume that the intensity in training is more important than the volume for a fast race time in a half marathon.
Association of training variables with anthropometric characteristics
The second aim was to investigate potential associations between skin-fold thicknesses and training characteristics such as volume and running speed. Based upon previous studies of runners up to the marathon distance, an association between lower body skin-fold thicknesses and variables of training might be expected. Legaz and Eston described in a sample of 24 male and female endurance runners a significant association between the decrease in front thigh skin-fold thickness and improvement in performance due to training (r = −0.74, P < 0.001).Citation10 We found an association of skin-fold thicknesses and body fat with both weekly running kilometers and running speed during training. However, skin-fold thickness at mid-axilla, triceps, and subscapular were not associated with weekly running kilometers. In addition, weekly running hours were not related to skin-fold thicknesses and body fat. Nonetheless, we can confirm the findings of Legaz and Eston that anthropometric and training characteristics are related.Citation10 However, a decrease in skin-fold thickness during training might also be due to diet. Regarding the present results, future novice half marathoners should rather focus on a fast running speed during training since all skin-fold thicknesses were related to running speed in training, but not all skin-fold thicknesses were associated with weekly kilometers ran.
Strength, limitations, and implications for future research
The principal strength of this study is that little information about half marathon performance on recreational runners exists and this study provides data to the literature for half marathoners. A cross-sectional study is, however, limited regarding the influence and effects of anthropometry and training on race time in runners, since only an intervention trial can answer this question. Other limitations are the lack of fitness evaluation of these athletes. We focused this investigation on anthropometry, pre-race experience, and training. Other aspects such as somatotype of the athlete, nutrition, and influence of environment were not considered. Unfortunately we have no data about energy deficit, or disorder in fluid or electrolyte metabolism which also might affect endurance performance. The rather small correlation coefficient in the equation might be due to the fact that we did not include physiological characteristics such as critical power,Citation36 running velocity at the lactate turnpoint,Citation37 treadmill velocity,Citation38 or the running speed at lactate threshold and maximum lactate steady state.Citation39 In a recent laboratory study using twelve subjects, the velocity at both lactate threshold and maximum lactate steady state explained 85% and 87% of the variance in running performance.Citation39 However, to investigate more than 80 recreational half marathoners in a laboratory before a race is impossible due to logistical reasons. As an alternative, a field test could be performed to estimate maximum oxygen uptake.Citation40
Conclusion
To summarize, both variables of anthropometry and training predict a half marathon race time in recreational male runners and cannot be reduced to one single predictor variable such as skin-fold thicknesses. The thicknesses of skin-folds and body fat showed no association with half marathon race time after multivariate analysis, and running speed during training seems to be more important than volume. For future novice male half marathoners intending to start for the first time in a half marathon, race time might be partially predicted by the following equation (r2 = 0.44): Race time (minutes) = 72.91 + 3.045 * (body mass index, kg/m2) −3.884 * (speed in running during training, km/hour). Future studies should include physiological variables in order to increase the correlation coefficient of an equation to predict a half marathon race time for recreational male runners.
Acknowledgments
We thank Mary Miller for her help in translation.
Disclosure
The authors have no conflicts of interest in this work.
References
- MartiBAbelinTMinderCERelationship of training and life-style to 16-km running time of 4000 joggers. The ’84 Berne “Grand-Prix” StudyInt J Sports Med1988985913384526
- NettletonSHardeyMRunning away with health: the urban marathon and the construction of ‘charitable bodies’Health (London)19961044146016973680
- AndersonTBiomechanics and running economySports Med19962276898857704
- MorganDWMartinPEKrahenbuhlGSFactors affecting running economySports Med198973103302662320
- PateRRMaceraCABaileySPBartoliWPPowellKEPhysiological, anthropometric, and training correlates of running economyMed Sci Sports Exerc199224112811331435160
- SaundersPUPyneDBTelfordRDHawleyJAFactors affecting running economy in trained distance runnersSports Med20043446548515233599
- HaganRDSmithMGGettmanLRMarathon performance in relation to maximal aerobic power and training indicesMed Sci Sports Exerc1981131851897253871
- BalePBradburyDColleyEAnthropometric and training variables related to 10-km running performanceBr J Sports Med1986201701733814989
- ArreseALOstarizESSkinfold thicknesses associated with distance running performance in highly trained runnersJ Sports Sci200624697616368615
- LegazAEstonRChanges in performance, skinfold thicknesses, and fat patterning after three years of intense athletic conditioning in high level runnersBr J Sports Med20053985185616244197
- KnechtleBKnechtlePRosemannTSimilarity of anthropometric measures for male ultra-triathletes and ultra-runnersPercept Mot Skills201011180581821319620
- KnechtleBKnechtlePRosemannTSennOWhat is associated with race performance in male 100-km ultra-marathoners-anthropometry, training or marathon best time?J Sports Sci20112957157721360403
- KenneyWLHodgsonJLVariables predictive of performance in elite middle-distance runnersBr J Sports Med1985192072094092141
- KnechtleBKnechtlePRosemannTLepersRPredictor variables for a 100-km race time in male ultra-marathonersPercept Mot Skills201011168169321319608
- KnechtleBDuffBWelzelUKohlerGBody mass and circumference of upper arm are associated with race performance in ultraendurance runners in a multistage race – the Isarrun 2006Res Q Exerc Sport20098026226819650392
- HoffmanMDLebusDKGanongACCasazzaGAVan LoanMBody composition of 161-km ultramarathonersInt J Sports Med20103110610920222002
- HoffmanMDAnthropometric characteristics of ultramarathonersInt J Sports Med20082980881118401807
- KnechtleBKnechtlePSchulzeIKohlerGUpper arm circumference is associated with race performance in ultra-endurance runnersBr J Sports Med20084229529917599951
- YeungSSYeungEWWongTWMarathon finishers and non-finishers characteristics: a preamble to successJ Sports Med Phys Fitness20014117017611447358
- BalePRowellSColleyEAnthropometric and training characteristics of female marathon runners as determinants of distance running performanceJ Sports Sci198531151264094022
- ScrimgeourAGNoakesTDAdamsBMyburghKThe influence of weekly training distance on fractional utilization of maximum aerobic capacity in marathon and ultramarathon runnersEur J Appl Physiol198655202209
- HaganRDUptonSJDuncanJJGettmanLRMarathon performance in relation to maximal aerobic power and training indices in female distance runnersBr J Sports Med198721373580726
- HewsonDJHopkinsWGSpecifity of training and its relation to the performance of distance runnersInt J Sports Med1996171992048739574
- ScottBKHoumardJAPeak performance velocity is highly related to distance running performanceInt J Sports Med1994155045077890465
- VoightAMRobertsWOLunosSChowLSPre- and postmarathon training habits of nonelite runnersOpen Access J Sports Med201121318
- BecqueMDKatchVLMoffattRJTime course of skin-plus-fat compression in males and femalesHum Biol19865833423957328
- KnechtleBJoleskaIWirthAKnechtlePRosemannTSennOIntra- and inter-judge reliabilities in measuring the skin-fold thicknesses of ultra runners under field conditionsPercept Mot Skills201011110510621058591
- BallSDAltenaTSSwanPDComparison of anthropometry to DXA, new prediction equation for menEur J Clin Nutr2004581525153115162135
- GatsonisCSampsonARMultiple correlation: exact power and sample size calculationsPsychol Bull19891065165242813654
- AbdiHBonferroni and Šidák corrections for multiple comparisonsSalkindNJEncyclopedia of measurement and statisticsThousand Oaks, CASage2007
- KnechtleBKnechtlePRüstCARosemannTLeg skinfold thicknesses and race performance in male 24-hour ultra-marathonersProc (Bayl Univ Med Cent)20112411011421566757
- KnechtleBKnechtlePRosemannTLepersRPersonal best marathon time and longest training run, not anthropometry, predict performance in recreational 24-hour ultrarunnersJ Strength Cond Res2011 [Epub ahead of print]
- KnechtleBWirthAKnechtlePZimmermannKKohlerGPersonal best marathon performance is associated with performance in a 24-h run and not anthropometry or training volumeBr J Sports Med20094383683918385194
- LuciaAEsteve-LanaoJOlivánJPhysiological characteristics of the best Eritrean runners’ exceptional running economyAppl Physiol Nutr Metab20063153054017111007
- BillatVLepretrePMHeugasAMLaurenceMHSalimDKoralszteinJPTraining and bioenergetic characteristics in elite male and female Kenyan runnersMed Sci Sports Exerc20033529730412569219
- KolbeTDennisSCSelleyENoakesTDLambertMIThe relationship between critical power and running performanceJ Sports Sci1995132652697563294
- NoakesTDMyburghKHSchallRPeak treadmill running velocity during the VO2 max test predicts running performanceJ Sports Sci1990835452359150
- StrattonEO’BrienBJHarveyJTreadmill velocity best predicts 5000-m run performanceInt J Sports Med200930404519202577
- TolfreyKHansenSADuttonKMcKeeTJonesAMPhysiological correlates of 2-mile run performance as determined using a novel on-demand treadmillAppl Physiol Nutr Metab20093476377219767813
- FlourisADMetsiosGSFamisisKGeladasNKoutedakisYPrediction of VO2 max from a new field test based on portable indirect calorimetryJ Sci Med Sport201013707319560968